NASA Satellites Monitor Tropical Storm Ida

The GOES-12 satellite is monitoring the status of tropical storm Ida to help in predicting its path. Image Credit: GOES Project Science

NASA has been keeping an eye on tropical storm Ida off the Gulf Coast, which was downgraded from a hurricane earlier today. Its satellites have been helping meteorologists to measure the rainfall and windspeeds of the storm. Ida is predicted by the National Hurricane Center in Miami, Florida to make landfall near Pensacola, Florida on Tuesday morning (Nov. 10th), after which it is expected to drop in intensity and head East.

NASA has been using three different satellites to monitor the tropical storm. The Tropical Rainfall Measuring Mission (TRMM) satellite flew over the storm earlier today, just before it was downgraded from hurricane status. At that time, the data from TRMM showed scattered convective thunderstorms producing moderate to heavy rainfall of about 50mm (2 inches) per hour. The windspeeds were measured at 70 knots (80.5 mph), but have since dropped.

The Quick Scatterometer satellite (QuikScat) used microwaves to observe Ida’s winds. The satellite data showed the speed of the rotating winds in the storm near the ocean surface to be 50-55 knots (57-63 mph) at 7a.m. Eastern Time. The tropical force winds extend out up to 200 miles from the center of Ida.

The third satellite NASA is using is the Geostationary Operational Environmental Satellite, GOES-12. From the imaging taken with GOES-12, the GOES Project at NASA’s Goddard Space Flight Center in Greenbelt, Md. was able to make a movie of the storm’s movement from November 7th-9th. The movie and many other images of the storm, updated hourly, are available on the GOES Project Science website.

Though Ida is not a hurricane, it still poses a significant threat to those living in the region where it will make landfall. The National Hurricane Center noted that “Large and destructive waves will accompany a storm surge of 3 to 5 feet near the point of landfall.” Local advisories are in effect on the ground for residents of the Gulf coast from the Florida panhandle to New Orleans and Baton Rouge, Louisiana. These areas and more northern areas into eastern Tennessee Valley and southern Appalachians can expect 3 to 5 inches of rainfall, with isolated totals of 8 inches.

If you live in these areas, please take care to follow any official advisories on the storm, available on the National Hurricane Center website.

Source: Eurekalert

Two ESA Satellites Launch Successfully

UPDATE: Information about both SMOS and the Proba-2 satelite are on ESA Television. The program loop is embedded at the bottom of this post. Enjoy!

Last night at 2:50 am Central European Time, two European Space Agency (ESA) satellites were successfully launched from the Plesetsk Cosmodrome in Northern Russia. The Rockot launch vehicle was carrying both the Soil Moisture and Ocean Salinity (SMOS) satellite, and the Proba-2 satellite. SMOS will monitor the moisture exchange of the Earth between the ocean, air and land as well as the salinity of the oceans and the moisture of the soil in an effort to better understand how these factors influence the climate of our planet. Proba-2 will test out various instruments, including a small wide angle optical camera, and instruments for monitoring the plasma environment in orbit and the Sun’s corona.

SMOS is part of the ESA’s Earth Observation Envelope Program, an initiative to study in scientific detail from space the ongoing changes of the Earth. The GOCE satellite launched earlier this year to study the Earth’s gravity field and ocean circulation is another part of this program.

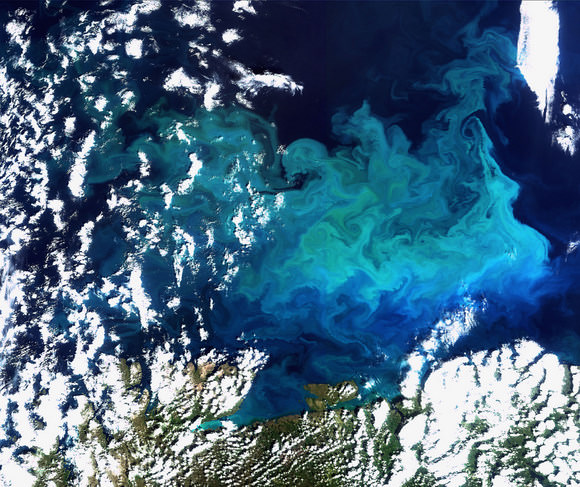
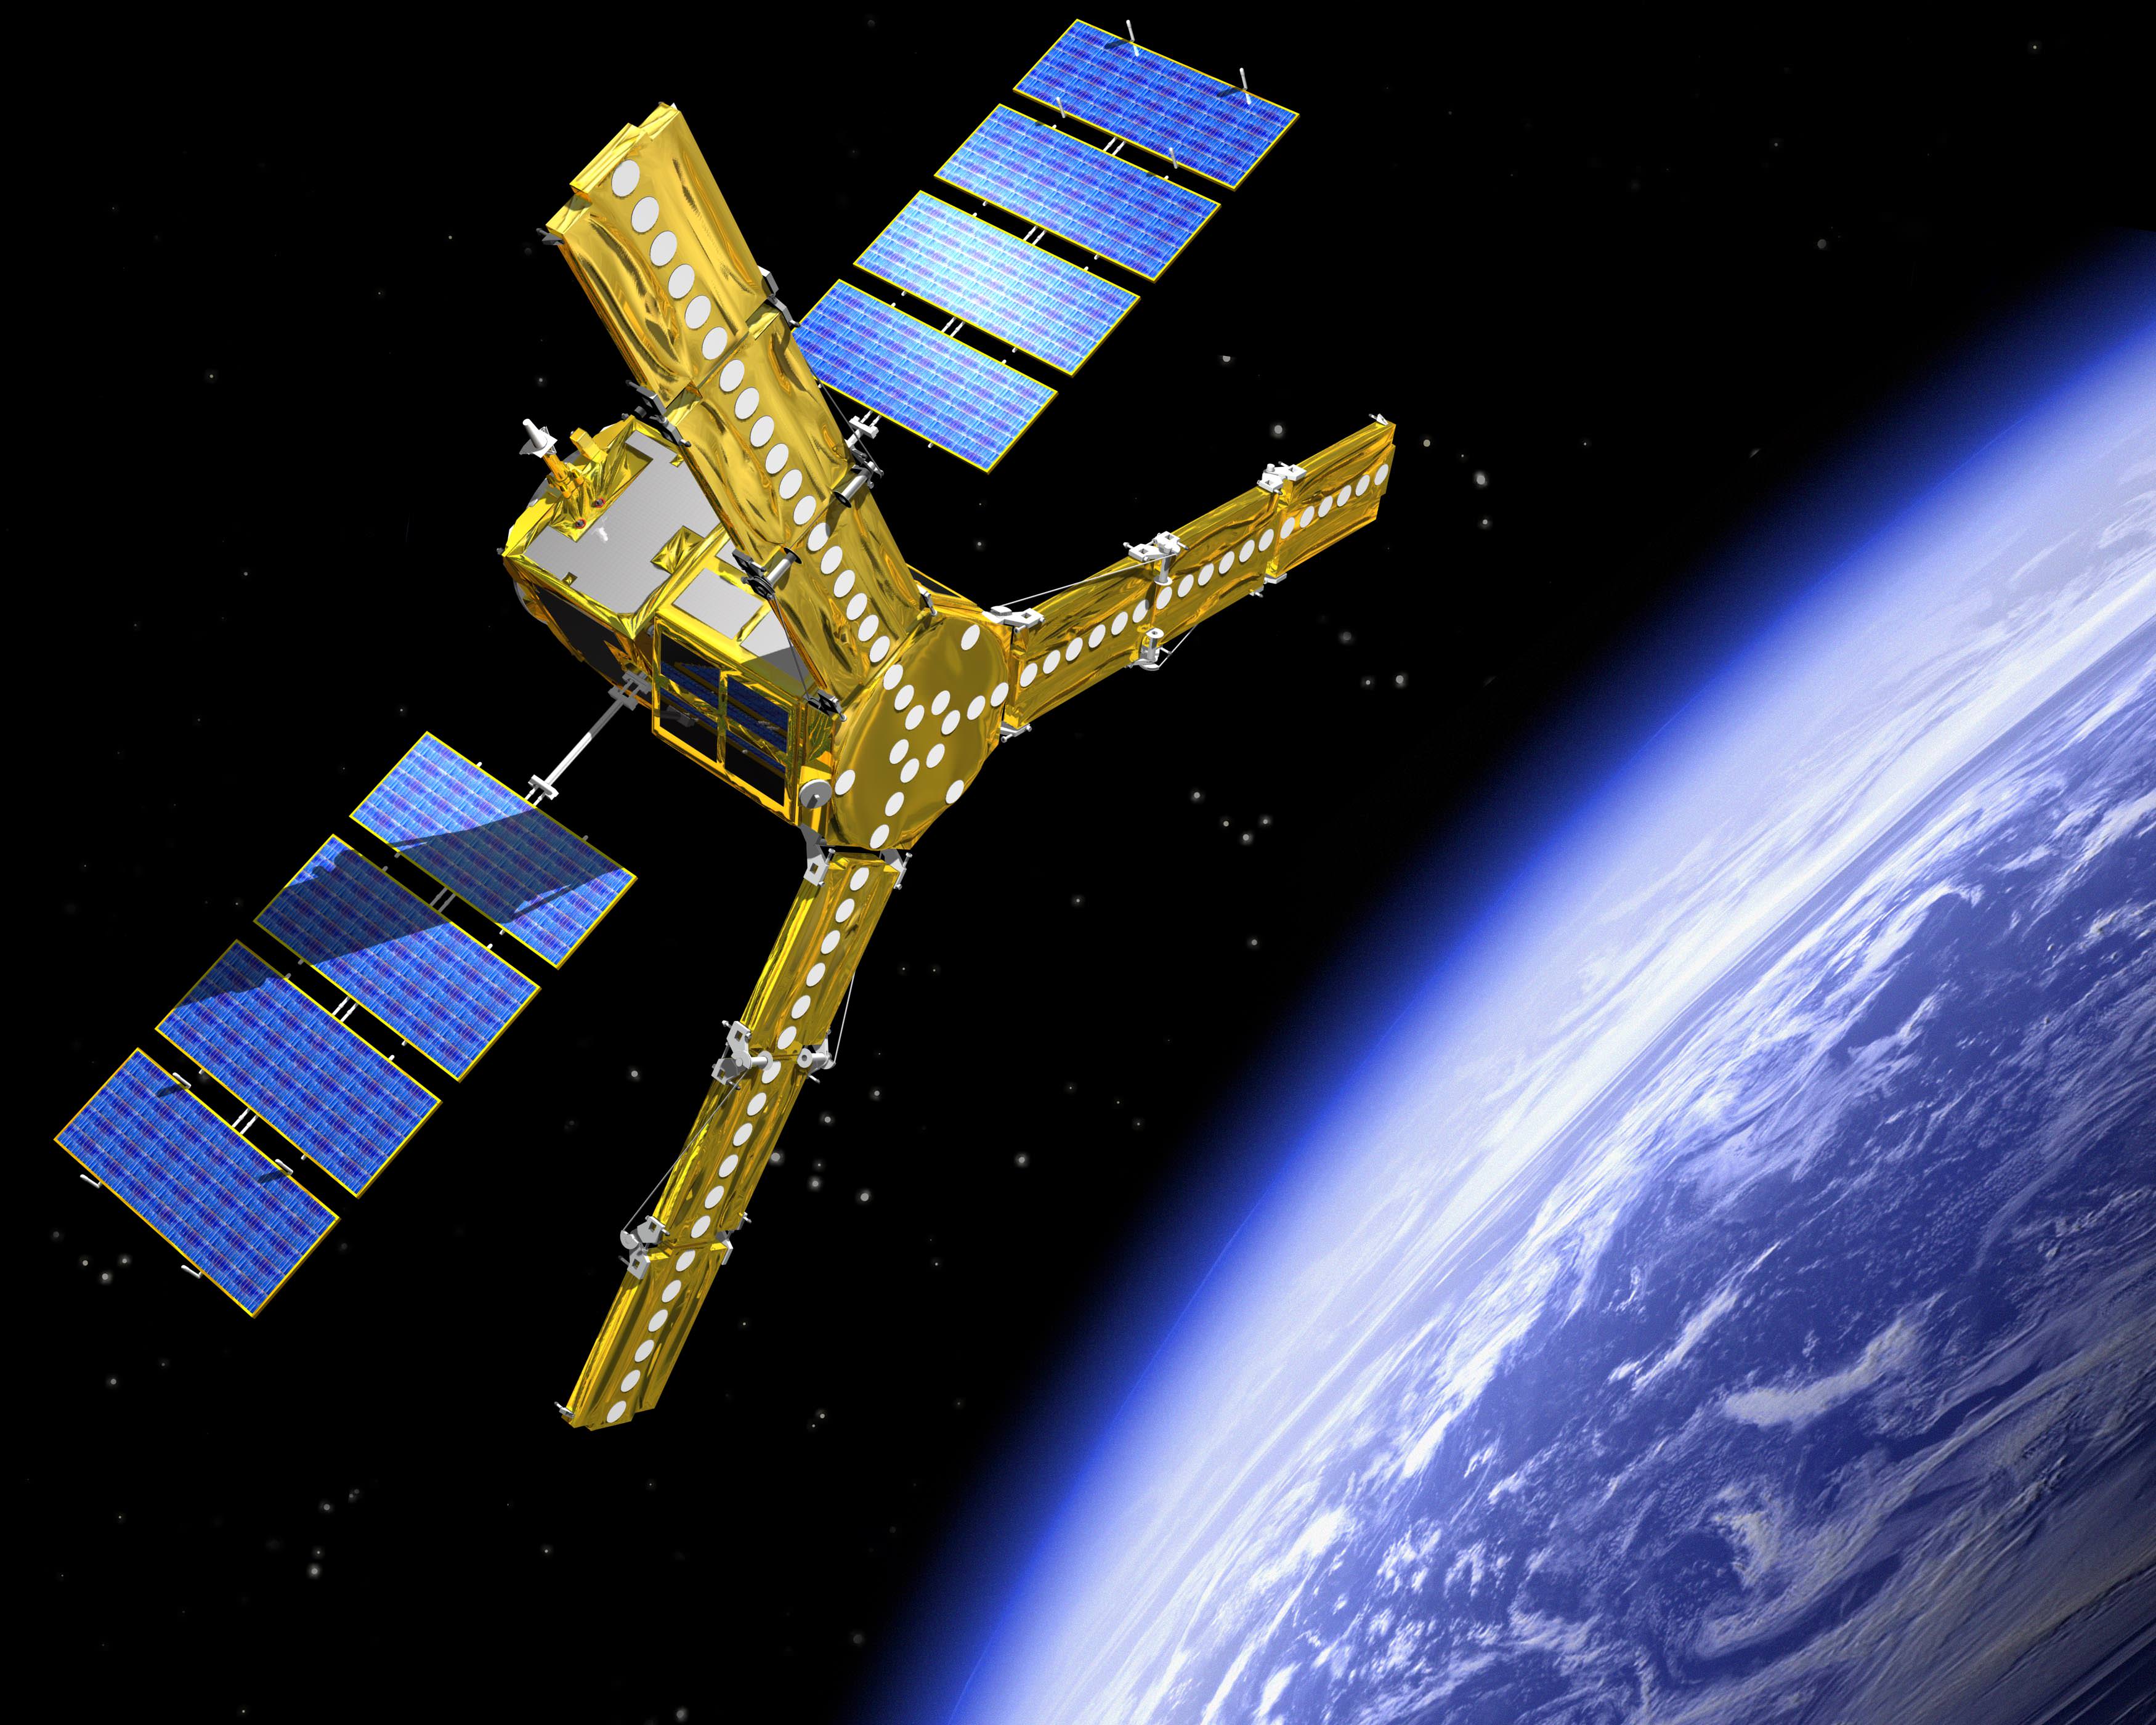
SMOS is the first satellite designed with the intent of measuring ocean salinity from space. To do this, it will implement a multi-part microwave antenna to monitor the oceans at a wavelength of about 23cm. At this frequency, an antenna of 5-10 meters (15-30 feet) is needed to make the measurements. This is too large to fit into a standard rocket payload bay, so the mission engineers employed what is called ‘synthetic aperture synthesis’. This is a technique used in radio astronomy that strings together separate antennae in different places, allowing the antennae to act as one larger antenna. A perfect example of this is the Very Large Array in New Mexico. The SMOS antenna has three foldable arms that are 3 meters (6 feet) long apiece, and extend to form a Y shape. Along the arms are 69 small antennae that all act together to take measurements as if they were one larger antenna.

Volker Liebig, ESA’s Director of Earth Observation Programs said in an ESA press release:

“The data collected by SMOS will complement measurements already performed on the ground and at sea to monitor water exchanges on a global scale. Since these exchanges – most of which occur in remote areas – directly affect the weather, they are of paramount importance to meteorologists. Moreover, salinity is one of the drivers for the Thermohaline Circulation, the large network of currents that steers heat exchanges within the oceans on a global scale, and its survey has long been awaited by climatologists who try to predict the long-term effects of today’s climate change.”

The Proba-2 satellite is the second in a series of ESA missions to test out new technologies in space. Image Credit:ESAThe other satellite piggybacking on the SMOS mission launch is the suitcase-sized Proba-2, part of  a series of missions in the ESA’s General Support Technology Program to test out new technology in space for further development on other ESA missions. Proba-2 is carrying a digital sun sensor, a high-precision magnetometer, and dual frequency GPS space receiver among other instruments for a Belgian study of solar physics and Czech study of plasma physics.

Both satellites arrived in their sun-synchronous orbits, and initial systems checks indicate that both are operating as expected. SMOS will orbit at 760 km (472 miles) above the Earth, and Proba-2 at 725 km (450 miles). SMOS, once calibrated, will reach full operational status in about six months, and Proba-2 will become fully operation in two months.

Source: ESA, Eurekalert

Arctic Sea Ice Extent is Third Lowest on Record

U.S. satellite measurements show Arctic sea ice extent in 2009 – the area of the Arctic Ocean covered by floating ice – was the third lowest since satellite measurements were first made in 1979. While the ice area at minimum was an increase from the past two years, it is still well below the average for the past 30 years. In the video above, Tom Wagner, NASA’s cryosphere program manager, describes the shrinking of Arctic sea ice and the significance of the problem for the rest of the planet.
Continue reading “Arctic Sea Ice Extent is Third Lowest on Record”

NASA 3-D Map Shows Flooding Rains of Typhoon Ketsana

Data from NASA's TRMM satellite was used to create an enhanced 3-D topographic rainfall map of Ketsana's flooding rains received in the Philippines. The dark yellow and orange areas indicate 375 mm (~15 inches) to over 475 mm (~19 inches), respectively. The red area over Manila indicates almost 2 feet of rain fell. Credit: SSAI/NASA, Hal Pierce

[/caption]
Data from the Tropical Rainfall Measuring Mission or TRMM satellite has been used to create a 3-D map of rainfall over the Phillipines from September 21-28, 2008. Armed with both a passive microwave sensor and a space-borne precipitation radar, TRMM has been measuring the amount of rainfall created by the tropical cyclone, Typhoon Ketsana (known in the Phillippines as “Ondoy”). A record 13.43 inches of rain fell in Manila in six hours between 8 a.m. and 2 p.m. local time, which is equivalent to about a month’s worth of rain for the area. In just 24 hours, Ketsana dropped 17.9 inches (455 mm) of rain in Manila in just 24 hours on Saturday, September 26.

The TRMM-based, near-real time Multi-satellite Precipitation Analysis (TMPA) at the NASA Goddard Space Flight Center, Greenbelt, Md. is used to monitor rainfall over the global Tropics. TMPA rainfall totals for the 7-day period 21 to 28 September 2009 for the northern Philippines and the surrounding region showed that the highest rainfall totals occurred south of the storm’s track in an east-west band over central Luzon that includes Manila. Amounts in this region are on the order of 375 mm (~15 inches) to over 475 mm (~19 inches). The highest recorded amount from the TMPA near Manila was 585.5 mm (almost 24 inches).

Ketsana maintained minimal tropical storm intensity as it crossed central Luzon on the afternoon of September 26 (local time). The main deluge in the Manila area, located on the western side of Luzon, began around 8:00 a.m. local time even though the center of Ketsana had yet to make landfall on the eastern side of the island.

Click here to watch an animation of the TRMM satellite data.

The enhanced rainfall over on the Manila-side of the island as the storm approached was because of an interaction between Ketsana’s circulation and the seasonal southwest monsoon.

On-the-ground photos of the devastation Ketsana’s rains caused can been seen at the Boston Globe’s Big Picture.

More info about TRMM.
Source: NASA

GOCE Satellite Begins Mapping Earth’s Gravity in Lower Orbit Than Expected

Anaglyph images created from an ESA video animation of global gravity gradients. A more accurate global map will be generated by ESA's GOCE craft. Credit: ESA and Nathaniel Burton Bradford.

[/caption]
Is Earth’s gravity field as intriguing and misshapen as this image above? We’re about to find out. The sexy looking Gravity field and steady-state Ocean Circulation Explorer or GOCE satellite has completed its calibration and is now in its science orbit to map the tiny variations of Earth’s gravity in unprecedented detail. And it turns out the sun’s current period of low solar activity has a side benefit for the GOCE mission. Less solar activity means a calmer environment for GOCE in its low Earth orbit, so its current orbit of 255 km is a few kilometers lower than engineers had originally planned. This is good news – the gravity measurements being made at the moment will be even more accurate.

“The completion of the commissioning and first in-flight calibration marks an important milestone for the mission, ” said Rune Floberghagen, ESA’s GOCE Mission Manager. “We are now entering science operations and are looking forward to receiving and processing excellent three-dimensional information on the structure of Earth’s gravity field.”

Anaglyph created from an ESA GOCE craft animation. Credit:  ESA and Nathanial Burton Bradford
Anaglyph created from an ESA GOCE craft animation. Credit: ESA and Nathanial Burton Bradford

Gravity is stronger closer to Earth, so GOCE was designed to orbit as low as possible while remaining stable as it flies through the fringes of our atmosphere. GOCE’s sleek aerodynamic design helps this the satellite to cut though the tenuous fringes of Earth’s atmosphere at this low altitude. Moreover, the electric ion thruster at the back continuously generates tiny forces to compensate for any drag that GOCE experiences along its orbit.

To help avoid drag and ensure that the gravity measurements are of true gravity, the satellite has to be kept stable in ‘free fall’. Any buffeting from residual air at this low altitude could potentially drown out the gravity data.

Space gradiometry and the use of the sophisticated electric propulsion are both ‘firsts’ in satellite technology, so the commissioning and calibration were particularly important for the success of the mission. This phase was completed in the summer, ready for the tricky task of bringing GOCE down to its operational altitude, which took a couple of months.

Worldwide gravity gradients from simulations. GOCE is now gathering data such as shown here to map Earth's gravity with unprecedented accuracy and spatial resolution. Credit:  ESA
Worldwide gravity gradients from simulations. GOCE is now gathering data such as shown here to map Earth's gravity with unprecedented accuracy and spatial resolution. Credit: ESA

Over two six-month uninterrupted periods, GOCE will map these subtle variations with extreme detail and accuracy. This will result in a unique model of the ‘geoid’ – the surface of an ideal global ocean at rest.

A precise knowledge of the geoid is crucial for accurate measurement of ocean circulation and sea-level change, both of which are influenced by climate. The data from GOCE are also much-needed to understand the processes occurring inside Earth. In addition, by providing a global reference to compare heights anywhere in the world, the GOCE-derived geoid will be used for practical applications in areas such as surveying and leveling.

Stay tuned for some unique data about our home planet from GOCE.

Thanks to Nathanial Burton-Bradford for the terrific anaglyphs he created from a GOCE animation. See more of Nathanial’s images on his Flickr page.

Source: ESA

From Space: Huge River of Dust Over Australia

A river of dust over Eastern Australia on Sept. 24, 2009. NASA image courtesy Jeff Schmaltz, MODIS Rapid Response Team at NASA GSFC. Caption by Holli Riebeek.

[/caption]This isn’t a special effect image from a new catastrophe movie; it is an actual satellite image of the dust storm sweeping over and around eastern Australia, heading across the Tasman Sea toward New Zealand. A dense wall of dust descended upon Sydney on Sept. 23, creating an apocalyptic scene (see these images from Boston Globe’s Big Picture) and the river of dust continues unabated across water. The Moderate Resolution Imaging Spectroradiometer (MODIS) on NASA’s Terra satellite captured this image of the storm on September 24, at 11:10 a.m., New Zealand time (23:10 UTC on September 23). The distance between the far northern edge of the plume and the southern edge is about 3,450 kilometers (2,700 miles), roughly equivalent to the distance between New York City and Los Angeles. Below, see how the storm progressed across the Sea later in the day.

Dust storm over Australia during the afternoon of Sept. 24, 2009. NASA image courtesy Jeff Schmaltz, MODIS Rapid Response Team at NASA GSFC.

By the early afternoon of September 24, 2009, when the same satellite acquired this image, the thick dust that had covered the eastern shore of Australia previouly, stretched in a long plume from northern Queensland to New Zealand. This image shows the northern portion of the plume off the coast of Queenland. The tan dust is densely concentrated in a compact plume that mirrors the coastline. The gem-like blue-green Great Barrier Reef is visible beneath the plume near the top of the image where the tan dust mingles with gray-brown smoke from wildfires.

Source: NASA Earth Observatory

Looking Down the Eye of Typhoon Choi-Wan

Choi Wan on Sept. 17, 2009. Credit: the Moderate Resolution Imaging Spectroradiometer (MODIS) on NASA’s Aqua Satellite.

[/caption]
Here’s a look at Typhoon Choi-Wan. This is a big storm covering a huge area, and luckily it is now weakening as it continues to move northeast over the Pacific Ocean. This image was taken on Sept. 18, 2009, by the Moderate Resolution Imaging Spectroradiometer (MODIS) on NASA’s Aqua Satellite. Although the storm maintains its tightly wound symmetric shape, the striking clear eye is gone, unlike the image below, which was taken on Sept. 15. Now a category 3 storm, Choi-wan now has winds of about 200 kilometers per hour (125 miles per hour or 110 knots), whereas on the 15th, sustained winds were clocked at between 250 kilometers per hour (155 miles per hour or 135 knots) and 240 km/hr (150 mph or 130 knots), according to the Joint Typhoon Warning Center. The storm continues to skirt along the coast of Japan, causing huge waves, but is not expected to make landfall.

Typhoon Choi-Wan on Sept. 15. Credit:  The Moderate Resolution Imaging Spectroradiometer (MODIS) on NASA’s Aqua satellite.
Typhoon Choi-Wan on Sept. 15. Credit: The Moderate Resolution Imaging Spectroradiometer (MODIS) on NASA’s Aqua satellite.

Choi-wan was a Category 4 super typhoon in this image, and the eye is clearly visible. NASA satellite imagery showed that the tops of the thunderstorms are so high they reached the tropopause, the level of atmosphere between the troposphere and stratosphere. Those high thunderstorms mean very heavy rainfall for the area underneath. The cloud tops extended to the 200 millibar level in the atmosphere where temperatures are as cold or colder than -63 Fahrenheit.

Other infrared imagery also showed the large temperature contrast between the icy cloud tops in the storm against the warm waters in the Western Pacific Ocean that continue to power the storm.

Earth From Space: Plankton Bloom

This Envisat image captures a plankton bloom in the Barents Sea. Credit: ESA

[/caption]
What a gorgeous shot of our blue planet! This Envisat satellite image taken on August 19, 2009 captures a plankton bloom larger than the country of Greece stretching across the Barents Sea off the tip of northern Europe. The land visible across the bottom of the image belongs to Norway (left) and Russia’s Murmansk Oblast.

Plankton, the most abundant type of life found in the ocean, are microscopic marine plants that drift on or near the surface of the sea. Microscopic plankton have been called ‘the grass of the sea’ because they are the basic food on which all other marine life depends.

The colorful blossoming bloom in the Barents Sea, a rather deep shelf sea with an average depth around 230 m, is approximately 136,000 sq km. In comparison, Greece has a land area of 131,940 sq km.

For more about this image, see this page from ESA.

Loch Ness Monster On Google Earth?

Loch Ness: NOT. Source: The Sun

[/caption]
As only a British tabloid (and Fox News) could, reports came out this week of the Loch Ness Monster being spotted on Google Earth. “This amazing image on Google Earth could be the elusive proof that the Loch Ness Monster exists,” The Sun reported. Well, for one thing, this doesn’t look *anything* like Nessie. Doesn’t he have a long black neck? And another thing about this: it looks surprisingly like a …. boat. Imagine that, a boat on a lake captured by Google Earth! Astounding!
Close-up view from Google Earth. Look closely and you’ll see the squared off back end of the boat (the stern), the rounded stern bow in front, and the tentacle-looking things are just the boat’s wake. This looks very much like another image of a boat on Loch Ness on Bing (below). Click on the picture to get to the image on Bing and zoom out for the full effect.

Another boat on Loch Ness from Bing.

To see it on Google Earth, go to coordinates Latitude 57°12’52.13″N, Longitude 4°34’14.16″W. Take a tour of Loch Ness (it is pretty there!) and you’ll see lots of other suspicious looking white things in the lake that are (gasp!) more boats!

How Close Did Hurricane Bill Come to the US East Coast?

Hurricane Bill skirts the Eastern Coast of the US. NASA image by Jeff Schmaltz, MODIS Rapid Response Team, Goddard Space Flight Center.

[/caption]
Hurricane Bill kept its distance from the US mainland, seemingly skirting along the eastern seaboard and fitting perfectly within the coastline curves on this NASA satellite image. Thankfully, the storm largely missed the eastern states, with the center of the storm well off the coast. It appears Bill will keep its distance from the Canadian coast as well. It has now been downgraded to a tropical storm, and is expected to weaken over the next 24 hours. As of late Sunday night, the storm had maximum sustained winds near 120 kilometers (75 miles) per hour with higher gusts. This image was taken by the Moderate Resolution Imaging Spectroradiometer (MODIS) on NASA’s Aqua satellite, taken at 2:00 p.m. EDT (14:00 UTC) on August 23, 2009.
Source: NASA Earth Observation website