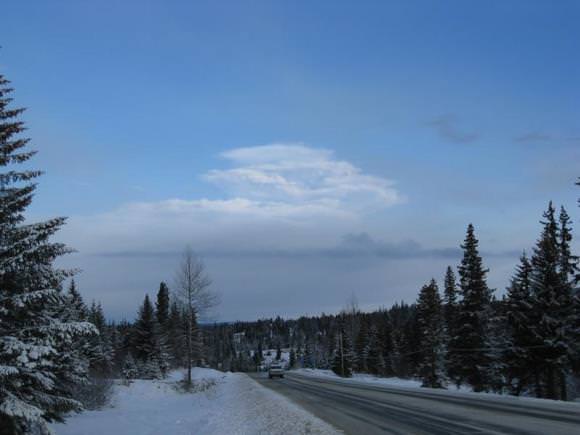
An ash cloud looms in the distance near Kachemak Bay Bluffs. Credit: Steve Baird, AVO
[/caption]
Alaska’s Mount Redoubt erupted twice Thursday morning, creating a 12-mile-high cloud of ash. The Alaska Volcano Observatory reported the first eruption came about 8:30 a.m., sending an ash cloud more than 9,100 meters (30,000) feet in the air. A second eruption came about an hour later, and blasted ash 20,000 meters (65,000 feet) high. After the second eruption, mud flows called lahars near the base of the volcano ran into the nearby Drift River. The National Weather Service also issued a flash flood warning for regions surrounding the Drift River, as eruptions can cause snow and ice to melt, causing the river to swell with melt water. The ash is predicted to drift as far as Anchorage, which lies about 160 km (100 miles) northeast of the volcano.
Redoubt ash plume. NASA images created by Jesse Allen, using data provided courtesy of the MODIS Rapid Response team
The volcano erupted with five smaller blasts on Monday, but had been relatively quiet for the past two days. Since the earlier eruptions occurred during the night, satellite images were not available during the peak times of eruptions, but scientists are hoping satellites were able to capture the latest eruptions in action.
Airlines have canceled flights around the area, as ash poses a significant threat to aircraft engines. Some regions surrounding Mount Redoubt have been evacuated.
Geologists with the U.S. Geological Survey have said a lot of snow and ice remains on the mountain, increasing the danger from mud flows that already have downed hundreds of trees and carved a huge gouge out of a glacier.
Redoubt volcano crater showing rapidly melting glacier and enlarged "ice piston" feature. Picture Date: March 21, 2009 Image Creator: Cyrus Read, Image courtesy of AVO/USGS.
[/caption]
Overnight, Alaska’s Redoubt volcano erupted with five large explosions. The National Weather Service has issued an Ashfall Advisory, with light ashfall already reported in some regions. Located about 100 miles southwest of Anchorage, Redoubt’s last eruption occurred in 1989-1990, causing widespread mudfalls or “lahars” and coated Anchorage and other nearby areas with ash. The ash affected air traffic as far south as Texas. Redoubt’s 3,108-meter (10,197-foot) peak has been belching steam for several weeks, with seismologists anticipating a possible eruption. Visible evidence of increased volcanic activity appeared at the alaska volcano summit from late January through February. Holes appeared in the ice, and streams of melt water cut across the surface of the Drift Glacier on Redoubt’s north flank.
The four explosions were recorded at 10:38 pm and 11:02 pm local time on March 22, and then at 2:14 am, 1:39 am and 4:37 am local time on March 23.
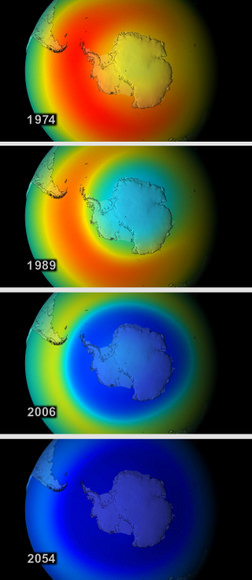
Imagine the year 2065. Two-thirds of Earth’s ozone is gone. The infamous ozone hole over Antarctica is a year-round fixture with a twin over the North Pole. People living in mid-latitude cities like Washington, D.C., get sunburned after five minutes. DNA-mutating UV radiation is up 650 percent, with likely harmful effects on plants, animals and human skin cancer rates.
Such is the world we would have inherited if 193 nations had not agreed to ban ozone-depleting substances, according to atmospheric chemists at NASA, Johns Hopkins University in Baltimore and the Netherlands Environmental Assessment Agency in Bilthoven. The researchers have unveiled new computer simulations this week of a worldwide disaster that humans managed to avoid.
In retrospect, the researchers say, the Montreal Protocol was a “remarkable international agreement that should be studied by those involved with global warming and the attempts to reach international agreement on that topic.”
This time series from the ozone "World Avoided" model shows the concentration of ozone over the South Pole at four key times. Reds represent normal to high concentrations; blues show depleted areas. Credit: NASA Goddard's Scientific Visualization Studio
Ozone is Earth’s natural sunscreen, absorbing and blocking most of the incoming UV radiation from the sun and protecting life from DNA-damaging radiation. The gas is naturally created and replenished by a photochemical reaction in the upper atmosphere where UV rays break oxygen molecules into individual atoms that then recombine into three-part molecules (O3). As it is moved around the globe by upper level winds, ozone is slowly depleted by naturally occurring atmospheric gases. It is a system in natural balance.
But chlorofluorocarbons — invented in 1928 as refrigerants and as inert carriers for chemical sprays — upset that balance. Researchers discovered in the 1970s and 1980s that while CFCs are inert at Earth’s surface, they are quite reactive in the stratosphere (10 to 50 kilometers altitude, or 6 to 31 miles), where roughly 90 percent of the planet’s ozone accumulates. UV radiation causes CFCs and similar bromine compounds in the stratosphere to break up into elemental chlorine and bromine that readily destroy ozone molecules.
In the 1980s, ozone-depleting substances opened a wintertime “hole” over Antarctica and opened the eyes of the world to the effects of human activity on the atmosphere. In January 1989, the Montreal Protocol went into force, the first-ever international agreement on regulation of chemical pollutants.
In the new study, published online in the journal Atmospheric Chemistry and Physics, Goddard scientist Paul Newman and his team simulated “what might have been” if chlorofluorocarbons (CFCs) and similar chemicals were not banned. The simulation used a comprehensive model that included atmospheric chemical effects, wind changes, and radiation changes. The “World avoided” video can be viewed here in Quicktime (for more formats, go here).
By the simulated year 2020, 17 percent of all ozone is depleted globally. An ozone hole starts to form each year over the Arctic, which was once a place of prodigious ozone levels.
By 2040, global ozone concentrations fall below the same levels that currently comprise the “hole” over Antarctica. The UV index in mid-latitude cities reaches 15 around noon on a clear summer day, giving a perceptible sunburn in about 10 minutes. Over Antarctica, the ozone hole becomes a year-round fixture.
By the end of the model run in 2065, global ozone drops 67 percent compared to 1970s levels. The intensity of UV radiation at Earth’s surface doubles; at certain shorter wavelengths, intensity rises by as much as 10,000 times. Skin cancer-causing radiation soars.
“Our world avoided calculation goes a little beyond what I thought would happen,” said Goddard scientist and study co-author Richard Stolarski, who was among the pioneers of atmospheric ozone chemistry in the 1970s. “The quantities may not be absolutely correct, but the basic results clearly indicate what could have happened to the atmosphere.”
“We simulated a world avoided,” added Newman, “and it’s a world we should be glad we avoided.”
As it is, production of ozone-depleting substances was mostly halted about 15 years ago, though their abundance is only beginning to decline because the chemicals can reside in the atmosphere for 50 to 100 years. The peak abundance of CFCs in the atmosphere occurred around 2000, and has decreased by roughly 4 percent to date. Stratospheric ozone was depleted by 5 to 6 percent at middle latitudes, but has somewhat rebounded in recent years.
Europe’s Gravity field and steady-state Ocean Circulation Explorer (GOCE) is headed into orbit, after a successful launch at 10:21 a.m. EDT (14:21 GMT) on Tuesday from the Plesetsk Cosmodrome in northern Russia.
The successful liftoff came after delays stretching back to last September, but Tuesday’s launch went off without any complications.
“It was a nice liftoff,” said Mission Scientist Mark Drinkwater.
Monday’s launch failed to progress when the doors of the launch service tower simply did not open. That after a previous failure last September, when problems cropped up with the guidance and navigation subsystems on the Russian Breeze KM rocket.
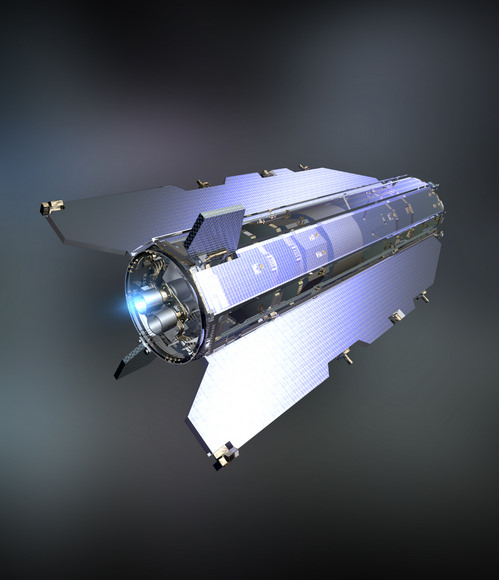
GOCE is the first of a new family of ESA satellites, called Earth Explorers, designed to study our planet and its environment in order to improve our knowledge and understanding of Earth-system processes and their evolution, to characterize the challenges of global climate change. Its specific mission is to map Earth’s gravity field with unprecedented accuracy, providing insight into ocean circulation, sea-level change, climate change, volcanism and earthquakes.
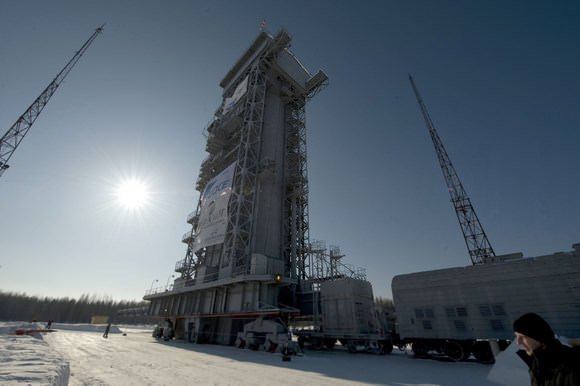
Europe’s Gravity field and steady-state Ocean Circulation Explorer (GOCE) seems to be stuck on the pad.
The climate change satellite was expected to launch out of Russia at 14:21 GMT (10:21 EDT) today, from the Plesetsk Cosmodrome in northern Russia. The weather was fine and mission managers were optimistic with seconds to liftoff — and then, everything froze. With seven seconds left on the countdown clock, an unexpected hold went into place and ESA broadcasters simply stopped talking.
Update, 12:30 p.m. EDT: The ESA has announced that launch failed when the doors of the launch service tower did not open. The tower was held in position and did not move back as required for a launch. An investigation is under way, and the agency intends to try again tomorrow at the same time (15:21 CET; 14:21 GMT; 10:21 a.m. EDT).
GOCE is the first of a new family of ESA satellites, called Earth Explorers, designed to study our planet and its environment in order to improve our knowledge and understanding of Earth-system processes and their evolution, to characterize the challenges of global climate change.
The satellite is supposed to launch into a Sun-synchronous, near-circular polar orbit by a Russian Rockot vehicle – a converted SS-19 ballistic missile. Its specific mission is to map Earth’s gravity field with unprecedented accuracy, providing insight into ocean circulation, sea-level change, climate change, volcanism and earthquakes.
GOCE has been undergoing preparations for launch since it was taken out of storage around three weeks ago. Launch campaign activities included a series of mechanical and electrical tests, mating to the Upper Stage and finally encapsulation in the launcher fairing. A video of the anticipated fairing separation was produced pre-launch, and is available here.
Today’s go-ahead followed a successful countdown rehearsal conducted by ESA’s Mission Control Team, the Russian Mission Control Centre and the international tracking station network on Friday.
“We’ve been in this room for many hours and many days in the past. We want to do the real thing now,” said Paolo Laberinti, head of verification and testing, just moments before the seemingly foiled launch.
This isn’t the first time GOCE has encountered problems. The craft had to stand down from launch in September 2008 when problems were discovered with the guidance and navigation subsystems on the Russian Breeze KM rocket. GOCE had to be de-mated from the rocket and brought back into the clean room.
Stay tuned for updates to this post as the ESA releases details about the failure.
[/caption]
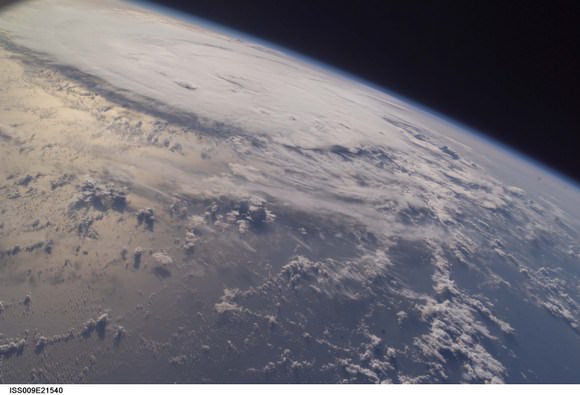
It’s not exactly what Al Gore had in mind, but its close. Live streaming video is now available every day of the week from the International Space Station. The video will show views of Earth and the exterior structure of the station, as seen from cameras mounted outside the ISS, and other times, activities going on inside the station. If you regularly watch NASA TV online, just go to the same website, and now there’s another choice of channels. Just click on the “Live Space Station Video” tab to enjoy. The Earth views will usually be seen during what is the crew off-duty or sleep periods, usually from about 6 pm to 6 am GMT (1 p.m. to 1 a.m. CST.) During times when the crew is awake and working, selected video will be available, accompanied by audio of communications between Mission Control and the astronauts. Be advised that during working hours when there are special events going on — for example, today as I’m writing this there is a spacewalk taking place — the public channel offers better views and commentary.
During times when the shuttle is docked to the station, the stream will include video and audio of those activities. Whenever video isn’t available, a graphical world map will be shown that depicts the station’s location in orbit above the Earth using real-time telemetry sent to Mission Control from the station.
Since the station orbits the Earth once every 90 minutes, it sees a sunrise or a sunset every 45 minutes. When the station is in darkness, external camera video may appear black, but also may provide great views of city lights below.
The streaming video is being webcast as part of NASA’s celebration of the 10th anniversary of the space station in orbit.
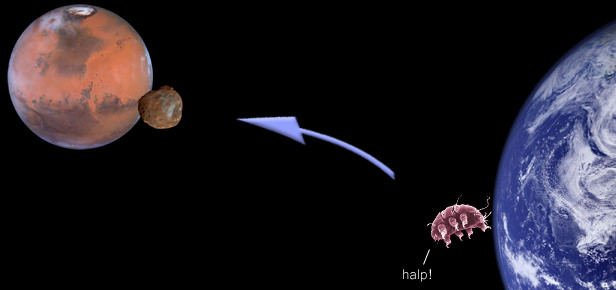
How ironic. Not content with searching for life on Mars, the Russian space agency and the US-based Planetary Society will soon be sending terrestrial life to the Martian moon Phobos. The mini-interplanetary travellers will consist of bacteria, spores, seeds, crustaceans, insects and fungi. Why? To see how biological life, in various forms, deals with space travel spanning three years.
So if you thought that a human (or monkey) would be the first of Earth’s ambassadors to land on Mars or one of its moons, you’d be very mistaken…
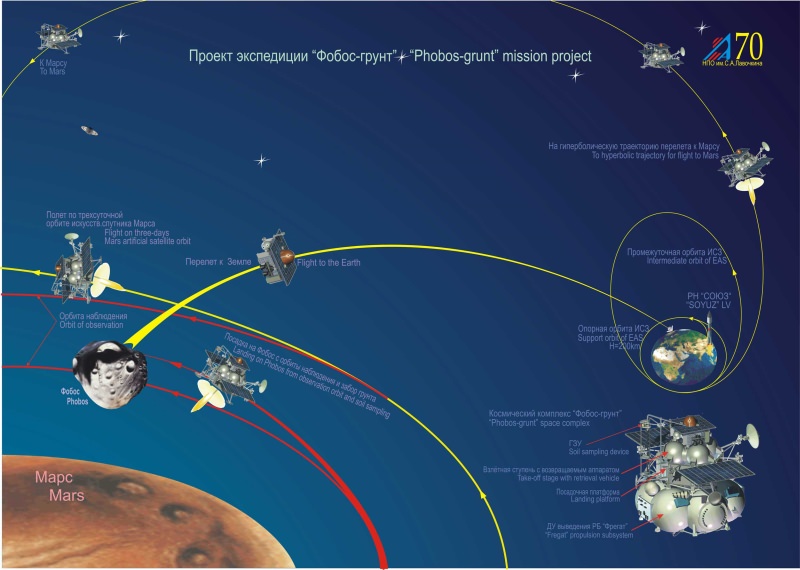
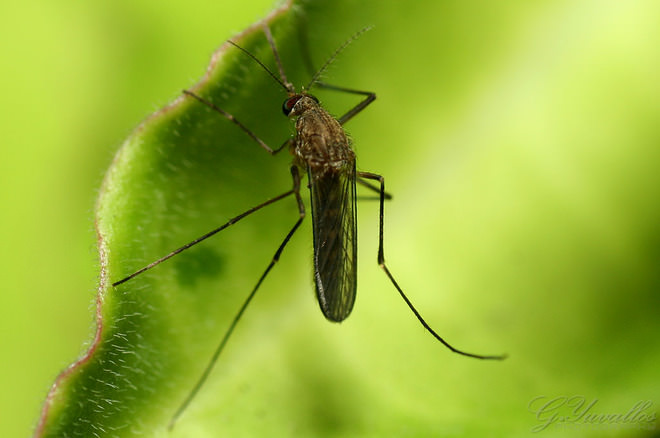
The Phobos-Grunt mission profileRussia has been carrying out a variety of biological space tests to see how life deals with the hazards of spaceflight recently. In one experiment carried out in collaboration with Japanese scientists, a mosquito was attached to the hull of the International Space Station (ISS) to see… what would happen.
The mosquito was a part of the Biorisk project, and the scientists knew the insect had the ability to drop into a “suspended animation” during times of draught in Africa. The African mosquito can turn its bodily water into tricallosa sugar, slowing its functions nearly to a stop. When the rain returns, the crystallised creature is rehydrated and it can carry on its lifecycle. The Biorisk mosquito however survived 18 months with no sustenance, exposed to temperatures ranging from -150°C to +60°C. When returned to Earth, Russian scientists gave the hardy mozzie a health check, declaring:
“We brought him back to Earth. He is alive, and his feet are moving.” — Anatoly Grigoryev, Vice President of the Russian Academy of Sciences.
So that’s the idea behind sending creatures into space: we need to understand how animals and plants deal with space travel. This will aid the understanding of how humans will cope in space for long periods, plus we need to understand if there are any harmful effects from growing foodstuffs away from our planet. This is why the Russian space agency wants to go one step further when it launches its Phobos-Grunt mission next year, to send biological specimens on a voyage of a lifetime. A return trip to the Martian moon Phobos.
Say hello to our interplanetary ambassador, the tardigrade (FUNCRYPTA)On board, it is hoped the US-based Planetary Society will be able to send a small package filled with 10 different species including tardigrades (“water bears”), seeds and bacteria. The main purpose of this experiment will be to test the panspermia hypothesis, where it is thought that life may travel from planet to planet, hitching a ride on fragments of planetary material. Most of the biological samples will be in a dormant state (i.e. the plant spores), and tests will be carried out when Phobos-Grunt returns to Earth to see if the bacteria survived, seeds germinate and spores… do what ever spores do.
Russia on the other hand has far loftier goals; the space agency will attach a small petting zoo. Inside the Russian experiment will include crustaceans, mosquito larvae (already proven to be enthusiastic space travellers), bacteria and fungi. The Russian experiment will specifically look at how cosmic radiation can effect these different types of life during an interplanetary trip (essential ahead of any manned attempt to the Red Planet).
Naturally, there are some concerns about contamination to the moon (if Phobos-Grunt doesn’t do the “return” part of the mission), but the chances of any extraterrestrial life being harboured on this tiny piece of airless rock are low. Having said that, we just don’t know, so the mission scientists will have to be very careful to ensure containment. Besides, there’s something unsettling about infecting an alien world with our bacteria before we’ve even had the chance to get there ourselves…
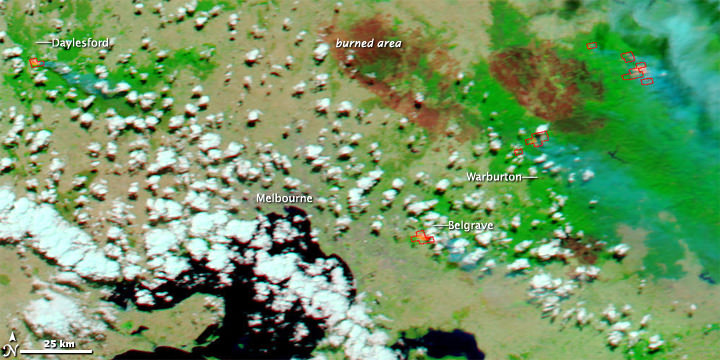
Bushfires in Australis on Feb. 23. NASA image courtesy the MODIS Rapid Response Team.
[/caption]
Australia has been battling natural disasters on opposite ends of the spectrum: fire and water. Deadly bushfires and massive flooding have plagued different parts of the country. Bushfires in Victoria, Australia, have flared up again during this last week of February, 2009. This region has been battling deadly fires for over a month, only brief periods of respite. According to news reports from the Australian Broadcasting Corporation on February 23, new emergency evacuation warnings over the weekend had forced hundreds of residents from communities across the state into shelters. This image from the Moderate Resolution Imaging Spectroradiometer (MODIS) on NASA’s Aqua satellite shows the fires on February 23 in natural color. Red outlines show the locations where MODIS detected active fires. Below, see an image in different wavelengths highlighting the burned areas, with more images showing the widespread flooding in western Australia.
Bushfires around Marysville, Victoria. NASA image created by Jesse Allen, using data provided courtesy of NASA/GSFC/METI/ERSDAC/JAROS, and U.S./Japan ASTER Science Team
The bushfire pictures use a combination of visible and near-infrared wavelengths of light to make the smoke more transparent and to highlight burned areas. Unburned vegetation is red, while burned areas are charcoal. Other areas where bushfires were threatening communities were Daylesford, Warburton, and Belgrave. Floods in Australia. NASA images courtesy the MODIS Rapid Response Team at NASA GSFC
While southeastern Australia battles deadly fires and high heat, much of the rest of Australia is flooded. Wet-season rains brought severe flooding to Western Australia, Queensland, and New South Wales. The most widespread flooding was in Queensland, where more than one million square kilometers flooded, reported the AFP wire service. The image above shows flooding along the Flinders River system in northern Queensland. Below is an image of the area taken on December 16, 2008 before the rain started. On the earlier image, the Flinders River system is discernible only by the lines of green vegetation that follow their courses through the dry land. But two months later, the flooded river system, with its myriad of channels, covered more than 100 kilometers. Flinders Rivers System in Dec. 2008. Credit: NASA
Below, floodwaters surround the town of Normantown Australia—population 1,150—in this satellite image. Water had been encroaching on the town, located along the Norman River in the far northwest of Australia’s Queensland territory, since the start of 2009. The curves of the normal river channel are visible under the water to the right of the town. According to the Australian Broadcasting Corporation nearly 120 centimeters (50 inches) of rain had fallen in the region since the start of the new year.
[/caption]
There was a bit of a buzz late last week about a Google Earth image that some said might show the location of the mythical city Atlantis off the coast of Africa. Reportedly a British aeronautical engineer was playing around with the new Google Earth 5.0, which includes undersea data, and noticed an interesting pattern about 600 miles west of the Canary Islands, that resembled a street grid. Even an excited geologist was quoted as saying this deserved a better look. But Google verified the pattern is just an artifact of the data collection process. Bathymetric (or sea floor terrain) data is often collected from boats using sonar to take measurements of the sea floor. The lines reflect the path of the boat as it gathers the data.
Sorry to dash everyone’s myth-seeking hopes!
“It’s true that many amazing discoveries have been made in Google Earth including a pristine forest in Mozambique that is home to previously unknown species and the remains of an Ancient Roman villa,” a Google spokesperson said. “In this case, however, what users are seeing is an artifact of the data collection process. Location of grid pattern. Credit: Google Earth
“The lines reflect the path of the boat as it gathers the data,” she said. “The fact that there are blank spots between each of these lines is a sign of how little we really know about the world’s oceans.”
The legend of Atlantis has excited public imagination for centuries. In recent years “evidence” of the lost kingdom has been found off the coast of Cyprus and in southern Spain.
Atlantis is a legendary island first mentioned in the writings of Plato, as a great city that sank into the sea.
In Plato’s account, Atlantis was a naval power lying “in front of the Pillars of Hercules” that conquered many parts of Western Europe and Africa 9,000 years before the time of Solon, or approximately 9600 BC. After a failed attempt to invade Athens, Atlantis sank into the ocean “in a single day and night of misfortune”.
Scholars dispute whether and how much Plato’s story or account was inspired by traditional stories of the time.
If you want to see the image yourself, go to Google Earth at this location: 31 15’15.53N 24 15’30.53W.
Scientists have long suspected that climatic variables like sea surface temperature and precipitation could foreshadow outbreaks of disease. Now, they have confirmation.
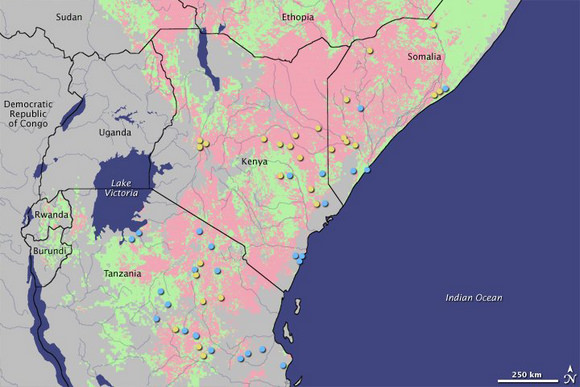
Responding to a deadly 1997 outbreak of the mosquito-borne disease Rift Valley fever, researchers had developed a “risk map,” pictured above, using NASA and National Oceanic and Atmospheric Administration measurements of sea surface temperatures, precipitation, and vegetation cover. As reported in a recent NASA-led study, the map gave public health officials in East Africa up to six weeks of warning for the 2006-2007 outbreak of the deadly Rift Valley fever in northeast Africa — enough time to lessen human impact.
On the map above, pink areas depict increased disease risk, while pale green areas reflect normal risk. Yellow dots represent reported Rift Valley fever cases in high-risk areas, while blue dots represent occurrences in non-risk areas. The researchers have detailed the map’s effectiveness in the Proceedings of the National Academy of Sciences.
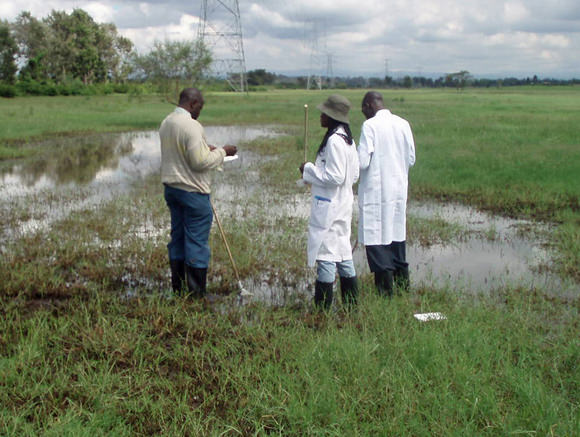
Scientists study a typical dambo habitat at Sukari Farm, a long-term Rift Valley Fever study site just outside Nairobi, Kenya. Dambos are natural breeding grounds for disease-carrying mosquitoes and can be observed from space with the aid of satellites. Credit: Assaf Anyamba
During an intense El Niño event in 1997, the largest known outbreak of Rift Valley fever spread across the Horn of Africa. About 90,000 people were infected with the virus, which is carried by mosquitoes and transmitted to humans by mosquito bites or through contact with infected livestock. That outbreak prompted the formation of a working group — funded by the U.S. Department of Defense Global Emerging Infections Surveillance and Response System — to try to predict future outbreaks.
The working group didn’t start from scratch. The link between the mosquito life cycle and vegetation growth was first described in a 1987 Science paper by co-authors Kenneth Linthicum of the U.S. Department of Agriculture and Compton Tucker of NASA’s Goddard Space Flight Center. Later, a 1999 Science paper described a link between Rift Valley fever and the El Niño-Southern Oscillation, a cyclical, global phenomenon of sea surface temperature changes that can contribute to extreme climate events around the world.
Building on that research, Assaf Anyamba of NASA Goddard and the University of Maryland, and his colleagues, set out to predict when conditions were ripe for excessive rainfall — and thus an outbreak. They started by examining satellite measurements of sea surface temperatures. One of the first indicators that El Niño will boost rainfall is a rise in the surface temperature of the eastern equatorial Pacific Ocean and the western equatorial Indian Ocean. Perhaps the most telling clue is a measure of the mosquito habitat itself. The researchers used a satellite-derived vegetation data set that measures the landscape’s “greenness.” Greener regions have more than the average amount of vegetation, which means more water and more potential habitat for infected mosquitoes. The resulting risk map for Rift Valley fever, showing areas of anomalous rainfall and vegetation growth over a three-month period, is updated and issued monthly as a means to guide ground-based mosquito and virus surveillance.
As early as September 2006, the monthly advisory from Anyamba and colleagues indicated an elevated risk of Rift Valley fever activity in East Africa. By November, Kenya’s government had begun collaborating with non-governmental organizations to implement disease mitigation measures—restricting animal movement, distributing mosquito bed nets, informing the public, and enacting programs to control mosquitoes and vaccinate animals. Between two and six weeks later—depending on the location—the disease was detected in humans.
After the 2006-2007 outbreak, Anyamba and colleagues assessed the effectiveness of the warning maps. They compared locations that had been identified as “at risk” with the locations where Rift Valley fever was reported. Of the 1,088 cases reported in Kenya, Somalia, and Tanzania, 64 percent fell within areas delineated on the risk map. The other 36 percent of cases did not occur within “at risk” areas, but none were more than 30 miles away, leading the researchers believe that they had identified most of the initial infection sites.
The potential for mapping the risk of disease outbreaks is not limited to Africa. Previous research has shown that risk maps are possible whenever the abundance of a virus can be linked to extremes in climate conditions. Chikungunya in east Africa and Hantavirus and West Nile virus in the United States, for example, have been linked to conditions of rainfall extremes.
“We are coming up on almost 30 years of vegetation data from satellites, which provides us with a good basis for predicting,” said Linthicum, co-author on the 1987 paper, upon his return from a Rift Valley fever workshop in Cairo, Egypt last month. “At this meeting, it was clear that using this tool as a basis for predictions has become accepted as the norm.”