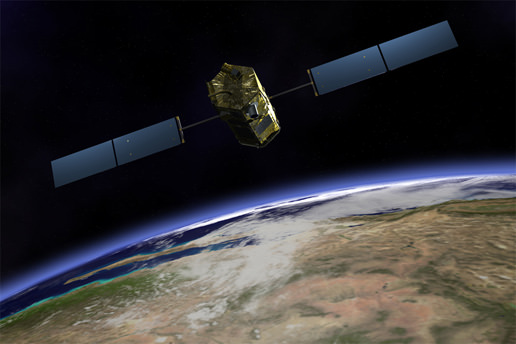
NASA’s first spacecraft dedicated to studying atmospheric carbon dioxide is ready for launch. The Orbiting Carbon Observatory, or OCO, is scheduled for liftoff aboard a Taurus XL rocket on February 24 from the Vandenberg Air Force Base, California at 1:51:30 a.m. PST. The spacecraft’s final polar orbit will be 438 miles. Carbon dioxide is the leading greenhouse gas driving changes in Earth’s climate. OCO will provide the first complete picture of human and natural carbon dioxide sources as well as their “sinks,” the places where carbon dioxide is pulled out of the atmosphere and stored.
OCO will map the global geographic distribution of the CO2 sources and sinks in the atmosphere and study their changes over time. The new observatory will dramatically improve global carbon dioxide data, collecting about eight million precise measurements every 16 days for at least two years.
CO2 is a critical component of the Earth’s atmosphere. Since the beginning of the industrial age, the concentration of CO2 has increased by about 38%, from about 280 parts per million to over 380 parts per million. Scientific studies indicate that CO2 is one of several gases that trap heat near the surface of the Earth. These gases are known as greenhouse gases. Many scientists have concluded that substantial increases in the abundance of CO2 will generate an increase in the Earth’s surface temperature. Historical records provide evidence of this trend, which is often called global warming. Current research indicates that continuing increases in atmospheric CO2 may modify the environment in a variety of ways. These changes may impact ocean currents, the jet stream and rain patterns. Some parts of the Earth might actually cool while the average temperature increases, and so this phenomenon is also called climate change.
OCO should help determine how much human-produced CO2 is contributing to climate change.
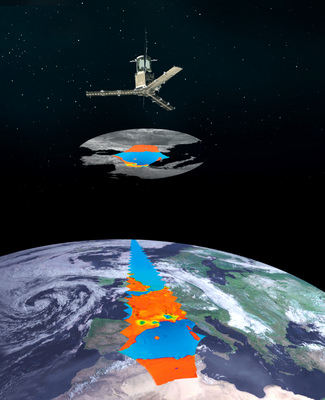
The European Space Agency’s Soil Moisture and Ocean Salinity (SMOS) satellite has been cleared for takeoff, following nearly a year in limbo while the mission team awaited the go-ahead from a private launch company.
Originally expected to launch in 2008, SMOS has been in storage at Thales Alenia Space’s facilities in Cannes, France since last May, awaiting a launch appointment at the Russian Plesetsk Cosmodrome, north of Moscow. If all goes according to plan, the craft will now launch between July and October, the second ESA mission in a series of six designed to observe Earth from space and bolster an understanding of climate change. The first of the satellites in its new Living Planet Program, The Gravity field and steady-state Ocean Circulation Explorer (GOCE), is scheduled to go up March 16.
Over its lifetime of about 20 months, GOCE will map global variations in the gravity field – crucial for deriving accurate measurements of ocean circulation and sea-level change, both of which are affected by climate change.
SMOS, circulating at a low orbit of around 750 km (466 miles) above the Earth, will be the first mission dedicated to mapping soil moisture and ocean salinity. Salinity in the oceans has a significant impact on ocean circulation, which in turn helps drive the global climate. Among other applications, understanding the salinity and temperature of the seas will lead to easier predictions of the zones where hurricanes intensify. A specialized radiometer has been developed for the mission that is capable of observing both soil moisture and ocean salinity by capturing images of emitted microwave radiation around the frequency of 1.4 GHz (L-band). SMOS will carry the first-ever, polar-orbiting, space-borne, 2-D interferometric radiometer. The mission is designed to last three years.
Here’s a rundown of the final four planned crafts in the series:
ADM-Aeolus (Atmospheric Dynamics Mission), with a 2010 launch date, will collect data about the global wind profile to improve weather forecasting.
CryoSat-2, set to launch in late 2009, will determine variations in the thickness of the Earth’s continental ice sheets and marine ice cover to further our understanding of the relationship between ice and global warming. CryoSat-2 replaces CryoSat, which was lost at launch in 2005.
Swarm, due for launch in 2010, is a constellation of three satellites to study the dynamics of the magnetic field to gain new insights into the Earth system by studying Earth’s interior and its environment.
EarthCARE (Earth Clouds Aerosols and Radiation Explorer), lanching in 2013, is a joint European-Japanese mission that aims to improve the representation and understanding of the Earth’s radiative balance in climate and numerical weather forecast models.
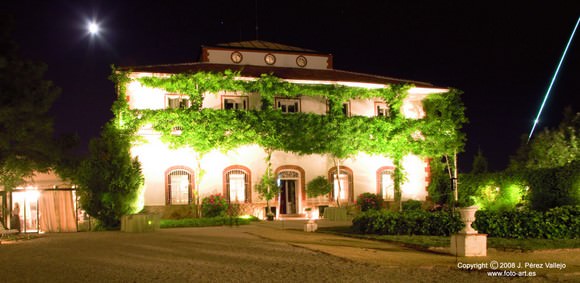
The Bejar bolide photographed from Torrelodones, Madrid, Spain. The incoming fireball is the streak to the right of the floodlit house. The bright light at the top is the overexposed Moon. Credit: J. Perez Vallejo/SPMN.
Astronomers have analyzed the cometary fireball that blazed across the sky over Europe last year and concluded it was a dense object, about a meter (3.2 feet) across and with a mass of nearly two tons — large enough that some fragments probably survived intact and fell to the ground as meteorites.
Last July, people in Spain, Portugal and France watched the brilliant fireball produced by a boulder crashing down through the Earth’s atmosphere. In a paper to be published in the journal Monthly Notices of the Royal Astronomical Society, astronomer Josep M. Trigo-Rodríguez, of the Institute of Space Sciences in Spain, and his co-authors present dramatic images of the event. The scientists also explain how the boulder may originate from a comet which broke up nearly 90 years ago, and suggest that chunks of the boulder (and hence pieces of the comet) are waiting to be found on the ground.
“If we are right, then by monitoring future encounters with other clouds of cometary debris, we have the chance to recover meteorites from specific comets and analyse them in a lab,” Dr Trigo-Rodríguez said. “Handling pieces of comet would fulfil the long-held ambitions of scientists — it would effectively give us a look inside some of the most enigmatic objects in the Solar System.”
Fireballs (or bolides) are the name given by astronomers to the brightest meteors, popularly referred to as shooting stars. On the afternoon of July 11, a brilliant fireball was recorded over southwestern Europe. At maximum intensity, the object was more than 150 times brighter than the full Moon. It was first picked up at a height of 61 miles (98.3 km) and disappeared from view 13 miles (21.5 km) above the surface of the Earth, tracked by three stations of the Spanish Fireball Network above Bejar, near Salamanca in Spain. At the same time, a professional photographer took a picture of the fireball from the north of Madrid.
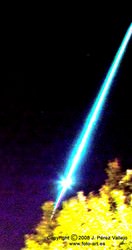
A close-up image of the Bejar bolide, photographed from Torrelodones, Madrid, Spain. Credit: J. Perez Vallejo/SPMN.
From these images, the astronomers have demonstrated that before its fiery demise, the boulder traveled on an unusual orbit around the Sun, which took it from beyond the orbit of Jupiter to the vicinity of Earth. This orbit is very similar to that of a cloud of meteoroids known as the Omicron Draconids, which on rare occasions produces a minor meteor shower and probably originates from the breakup of Comet C/1919 Q2 Metcalf in 1920. The authors suggest the boulder was once embedded in the nucleus of that comet.
Comet C/1919 Q2 Metcalf was discovered by Joel Metcalf from Vermont in August 1919, and was visible until February 3, 1920. The orbit was not well determined and no subsequent appearances are known. The Omicron Draconids meteor stream was discovered to be following a similar orbit to this comet by Allan F. Cook in 1973. The stream characteristically produces bright fireballs and rare meteor outbursts.
In the mid-1980s, the astronomers Tamas I. Gombosi and Harry L.F. Houpis first suggested that the nuclei of comets consist of relatively large boulders cemented together by a ‘glue’ of smaller particles and ice. If the rocky and icy nucleus of a comet disintegrates, then these large boulders are set loose into space. If the Bejar bolide was formed in this way, it confirms the glue model for at least some comets.
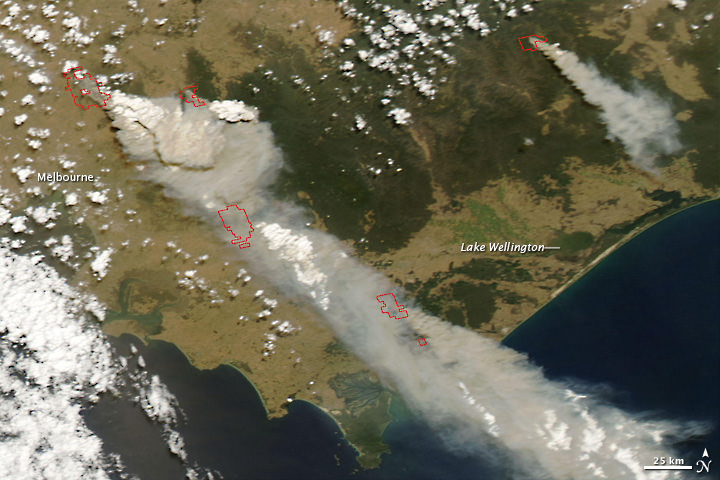
Satellite image of bushfires in southeast Australia taken Feb. 7, 2009. NASA image courtesy the MODIS Rapid Response Team, NASA Goddard Space Flight
[/caption]
UPDATE: Satellite Images from February 9 have now been added below.
As of this writing, 94 people (update 2/9/09) 135 have been killed by out-of-control bushfires in southeast Australia. This image from the Moderate Resolution Imaging Spectroradiometer (MODIS) on NASA’s Aqua satellite shows multiple large fires (outlined in red) burning in Victoria on February 7. Huge plumes of smoke spread southeast, driven by fierce winds. Click here to see a larger version of the image, which shows a larger area, and a dust storm blowing over interior deserts to the northwest. News sources report these fires sprang up and exploded in size in just a few short hours. According to ABC News, authorities suspect arsonists are responsible for some of the fires. NASA says images captured by another satellite, the Terra MODIS sensor, just a few hours prior to this image showed no sign of these fires. Twice-daily images of southeastern Australia are available from the MODIS Rapid Response Team, and Universe Today will try to update the images when they are available. See more below.
Satellite image aquired Feb. 9 of southeastern Australia bushfires. NASA image courtesy the MODIS Rapid Response Team, GSFC.
The bushfire pictures above and below shows the Barry Mountains of central Victoria on February 9, 2009. The image at top is a natural-color (photo-like) view captured by the Moderate Resolution Imaging Spectroradiometer (MODIS) on NASA’s Aqua satellite. Places where the sensor detected active fire are outlined in red. The image below is the same scene shown in false color, using visible, near-infrared, and shortwave infrared light. Burned areas are brick red, and places of intense heat—often a sign of open flame in this kind of image—are glowing pink. Smoke turns a transparent blue, which makes it easier to see the ground. False color image acquired Feb. 9. NASA image courtesy the MODIS Rapid Response Team, GSFC
Southeast Australia has a history of severe fire problems, with some historic deadly fires such as Ash Wednesday of 1983, and lesser fires almost every year. The state of Victoria averages about 19 large fires (over 1,000 hectares) per year, but the fires this year are considered to be the worst ever. These fires are often fast like grassfire but more intense. 700 homes have been destroyed, and it is feared the death toll will rise to over 100. Twenty-six fires continue to burn across Victoria; 12 of those are out of control. Satellite image of Australian bushfires from January 30, 2009. NASA image created by Jeff Schmaltz, MODIS Rapid Response Team, Goddard Space Flight Center.
This image was taken on January 30, during the beginning of when some of the fires began to break out. A crippling heat wave and strong winds contributed to an outbreak of forest and grassland fires in Victoria.
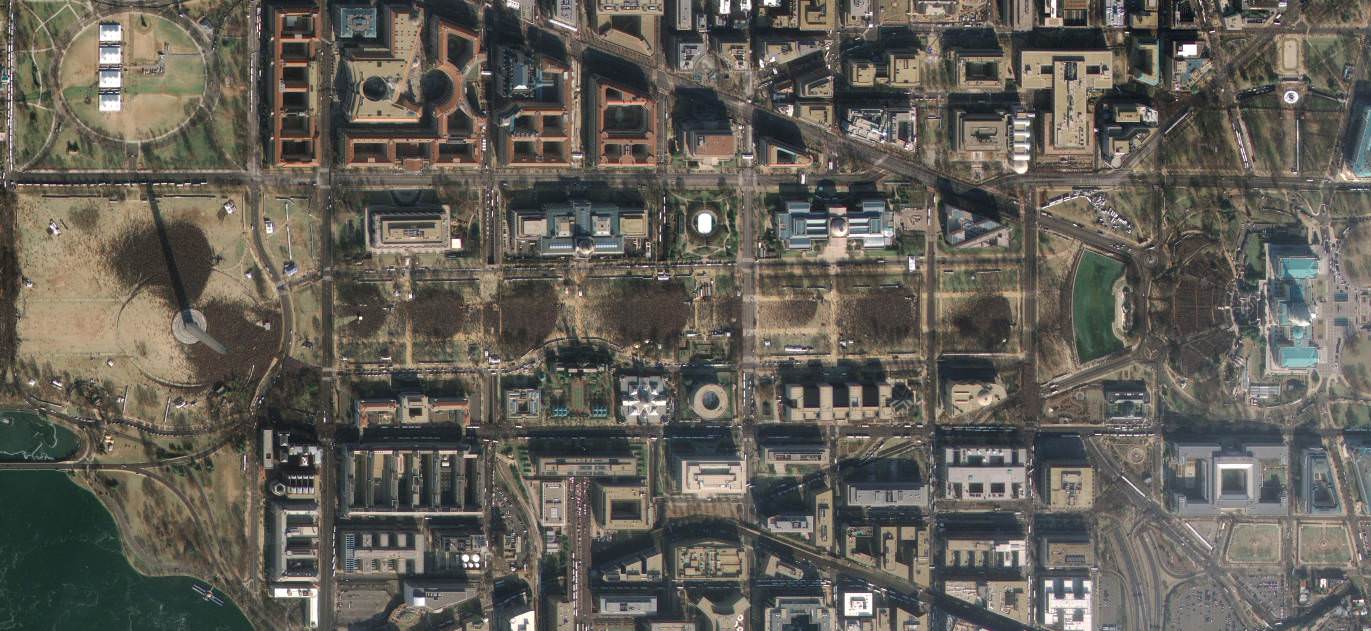
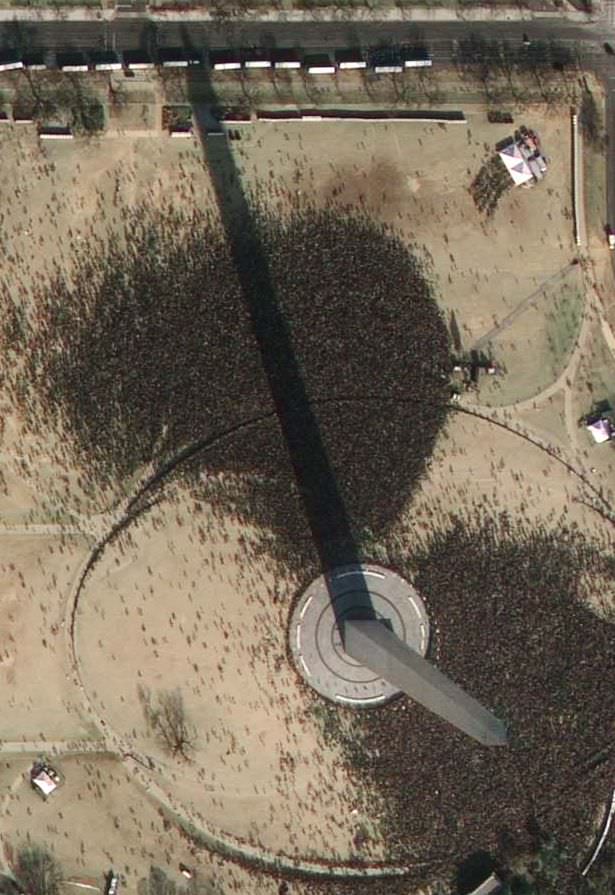
Today's inauguration as seen from over 400 miles high (GeoEye)
[/caption]
Travelling at 17,000 mph at an altitude of 423 miles, the 4,300 lb GeoEye-1 snapped a very high resolution image of Washington D.C. just before Barack Obama became the 44th President of the United States. Looking like crowds of ants vying for space around Capitol Hill and the White House, hundreds of thousands of spectators gathered to watch this historic day unfold…
GeoEye-1 took this satellite photo of Barack Obama's inauguration ceremony (GeoEye)While Washington D.C. celebrated the inauguration of President Barack Obama, the staff at the satellite imagery company GeoEye were hard at work, processing a unique view of the nation’s capital. One of the world’s most advanced imaging satellites (used by Google Maps and Google Earth) called GeoEye-1 was able to grab this incredible image from orbit, providing a view none of the cameras on the ground could experience.
GeoEye commissioned this orbital photograph in response to numerous media requests. The satellite is able to attain a resolution of 0.41 meters, although this preliminary view has been shrunk by media sources for distribution. It does however, capture a unique view of what is a historic day not only for the US but for the World.
More information about GeoEye-1:
“In August 2008, Google signed a deal with the satellite imagery company GeoEye for exclusive use of the images produced by the company’s new GeoEye-1 satellite. GeoEye-1 was launched on board a United Launch Alliance Delta II rocket from Vandenberg Air Force Base, California, on September 6th 2008. The satellite is currently in a Sun-synchronous orbit, over 400 miles above the surface of Earth, imaging the surface in unprecedented detail. A US government licence actually limits the resolution of available images to 0.5 metres (the camera on GeoEye-1 can attain a resolution of 0.41 metres). GeoEye-1’s competitors can resolve objects down to 0.6 metres at the smallest. The GeoEye products are currently used by Google for several projects, such as Google Earth and Google Maps.”
–Universe Today article, “Google Satellite” Will Have an Orbital View Over Obama’s Inauguration
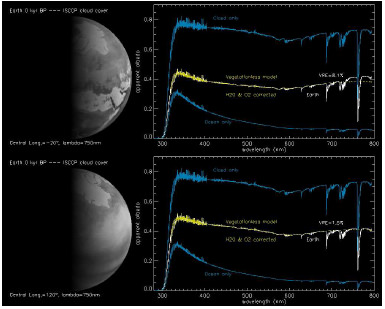
Earth scenes and corresponding spectra reconstructed for two observer’s positions. Credit: Arnold, et al.
[/caption]
What if another civilization had telescopes and spacecraft better than ours? Would Earth be detectable from another planet a few light-years away? Likewise, what will it take for us to detect life on an Earth-like planet within a similar distance? It’s interesting to consider those questions, and now, there is data to help answer them. In December 1990, when the Galileo spacecraft flew by Earth in its circuitous journey to Jupiter, scientists pointed some of the instruments at Earth just to see how the old home planet looked from space. Since we knew life could definitely be found on Earth, this exercise helped create some criteria that if found elsewhere, would point to the existence of life there as well. But what if Earth’s climate was different from what it is now? Would that signature still be detectable? And could potential biomarkers from extra solar planets holding climates much colder or warmer than ours be obvious? A group of researchers in France input some various criteria garnered from different epochs in Earth’s history to test out this hypothesis. What did they find?
One of the most telling of the criteria from the Galileo flyby revealing life on Earth was what is called the vegetation red edge –a sharp increase in the reflectance of light at a wavelength of around 700 nanometers. This is the result of chlorophyll absorbing visible light but reflecting near infrared strongly. The Galileo probe found strong for this evidence on Earth in 1990.
Luc Arnold and his team at the Saint-Michel-l’Observatoire in France wanted to determine some different parameters where plant life similar to Earth’s would still be detectable via the vegetative red edge on an Earth-like planet orbiting a star several light years away. Earth from space.
At that distance the planet would be a non-resolvable (in visible light) point-like dot, so the first question to consider is whether the red edge would be visible at different angles. The planet is likely to be rotating, and for example, on Earth, the continents that have the most vegetation are mainly in the northern hemisphere. If that hemisphere wasn’t leading the view, would a bio-signature still be detectable? They also wanted to allow for the different seasons, where a hemisphere in winter would be less likely to have vegetative biomarkers than one in summer, and potential heavy cloud cover.
They also input different climate criteria from the last Quaternary climate extremes, using climate simulations have been made by general circulation models. They used data from the present time and compared that to an ice age, The Last Glacial Maximum (LGM) which occurred about 21,000 years ago. Temperatures globally were on the order of 4 degrees C colder than today, and ice sheets covered most of the northern hemisphere. Then, they used a warmer time, during the Holocene epoch 6,000 years ago, when the Earth’s northern hemisphere was about 0.5 degrees C warmer than today. The sea level was rising and the Sahara Desert contained more vegetation.
Surprisingly, the researchers found even during winter in an ice age, the vegetation red signal would not be significantly reduced, compared to today’s climate and even the warmer climate.
So if another Earth is out there, the vegetaion red edge should allow us to find that Earth-like planet. But we need better telescopes and spacecraft to find it.
The best hope on the horizon is the Terrestrial Planet Finder. ESA has a similar instrument in the works called Darwin.
The teams behind these instruments say they could spot Earth-like planets orbiting stars at distances of up to 30 light years with an exposure measured in a couple of hours.
Arnold’s team says that spotting the signs of life on such a planet would be much harder. The vegetation red edge might only be seen with an exposure of 18 weeks with a telescope like the Terrestrial Planet Finder’s. An 18 week exposure of a planet orbiting another star would be an almost impossible task.
So when might we eventually see vegetation on another planet? The Terrestrial Planet Finder (TPF) looks unlikely to be launched before 2025 and even then might not have the power to do the job.
More ambitious telescopes later in the century, such as a formation of 150 3-meter mirrors would collect enough photons in 30 minutes to freeze the rotation of the planet and produce an image with at least 300 pixels of resolution, and up to thousands depending on array geometry. “At this level of spatial resolution, it will be possible to identify clouds, oceans and continents, either barren or perhaps (hopefully) conquered by vegetation,” the researchers write.
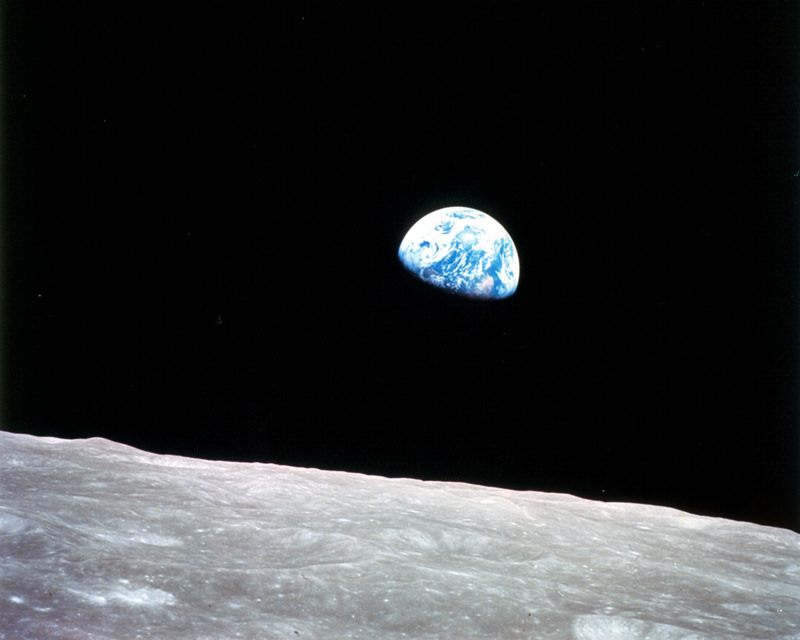
Apollo 8's famous Earthrise picture. Would you like to have this view? Credit: NASA
[/caption]
The Apollo 8 mission was a seminal moment not in only the history of spaceflight, but in human history as well. The mission came during a time when the US and the world were divided by war and racial issues. It’s been said that Apollo 8 “saved” 1968 from being an otherwise divisive and disheartening year, and because of the success of the mission – in terms of both technical and philosophical matters — the Apollo 8 crew of Frank Borman, Jim Lovell and Bill Anders were named “Men of the Year” by Time Magazine. Apollo 8 was the first human mission to orbit the moon, but it wasn’t supposed to be. And the mission was responsible for one of the most iconic images of our time.
Read more about Apollo 8 and watch an excellent video NASA put together to commemorate the mission on its 40th anniversary
Originally the mission was slated to test the lunar lander hardware in Earth orbit. But the lunar lander wasn’t ready and then other political issues came into play. NASA was told, incorrectly it turned out, by the CIA that the Soviet Union was preparing its own manned lunar mission and was ready to launch. As NASA wanted to be first to the moon and also fulfill President John Kennedy’s call for a US manned lunar landing by the end of the decade, they took a gamble and designated Apollo 8 to go and orbit the moon.
The decision was controversial. NASA’s giant Saturn V rocket, the only rocket capable of taking humans to the Moon, had been fraught with problems and instrument failures on its two test flights. Also, fresh in everyone’s minds was the fire in 1967 in which killed three astronauts – Gus Grissom, Ed White and Roger Chaffee – during a ground test of an Apollo capsule. Apollo 8 launch. Credit: NASA
Yes, it was a gamble, but it paid off. The crew launched on December 21, and it was the first manned launch of the Saturn V rocket. It went well, although Anders tells the story how he felt severe vibrations during the first moments of launch, and feeling almost like a bug on top of a car antenna, vibrating back and forth. But the giant rocket, 363 feet tall and weighing 6.25 million pounds performed well and following a rocket burn for trans-lunar injection, the astronauts were on their way to the moon.
Early on Christmas Eve, Apollo 8 reached its destination. The astronauts fired the propulsion system to slow the rocket, putting them into lunar orbit. For its first three obits, the astronauts kept its windows pointing down towards the Moon and frantically filmed the craters and mountains below. One of their main tasks was to do reconnaissance for the future Apollo landings.
It was not until Apollo 8 was on its fourth orbit that Borman decided to roll the craft away from the Moon and to point its windows towards the horizon in order to get a navigational fix. A few minutes later, he spotted a blue-and-white object coming over the horizon. Transcripts of the Apollo 8 mission reveal the astronauts’ wonder and amazement at what they were seeing: Earth, from a quarter of million miles away, rising from behind the Moon. “Oh my God! Look at the picture over there. Here’s the Earth coming up,” Borman shouted. This was followed by a flurry of exclamations by Anders and Lovell and a scramble to find a camera. Anders found one first and the first image he took was black-and-white, showing Earth just peeping over the horizon. Then Anders found a roll of 70mm color film for the Hasselblad camera, and he took the photograph of Earthrise that became an icon of 20th-century, portraying technological advances and heightening ecological awareness. Apollo 8 crew. Credit: NASA
This was the way humans first recorded their home planet from another world. “It was the most beautiful, heart-catching sight of my life,” Borman said later, “one that sent a torrent of nostalgia, of sheer homesickness, surging through me. It was the only thing in space that had any color to it. Everything else was either black or white. But not the Earth.”
Jim Lovell said that Earth was “a grand oasis in the vast loneliness of space.”
The three astronauts agree the most important thing they brought back from the mission was the photography, not only of the moon, but of Earth.
To commemorate the 40th anniversary of Apollo 8, the crew of the International Space Station’s Expedition 18, Commander Mike Fincke and Flight Engineers Sandy Magnus and Yury Lonchakov will send a message to be aired on a message that will air on NASA Television as part of the daily Video File, beginning at 11 a.m. CST, Friday, Dec. 19. The video also will be broadcast in high definition on the NASA TV HD channel at 10
a.m., noon and 3 p.m. on Friday, Dec. 19, and Tuesday, Dec. 23.
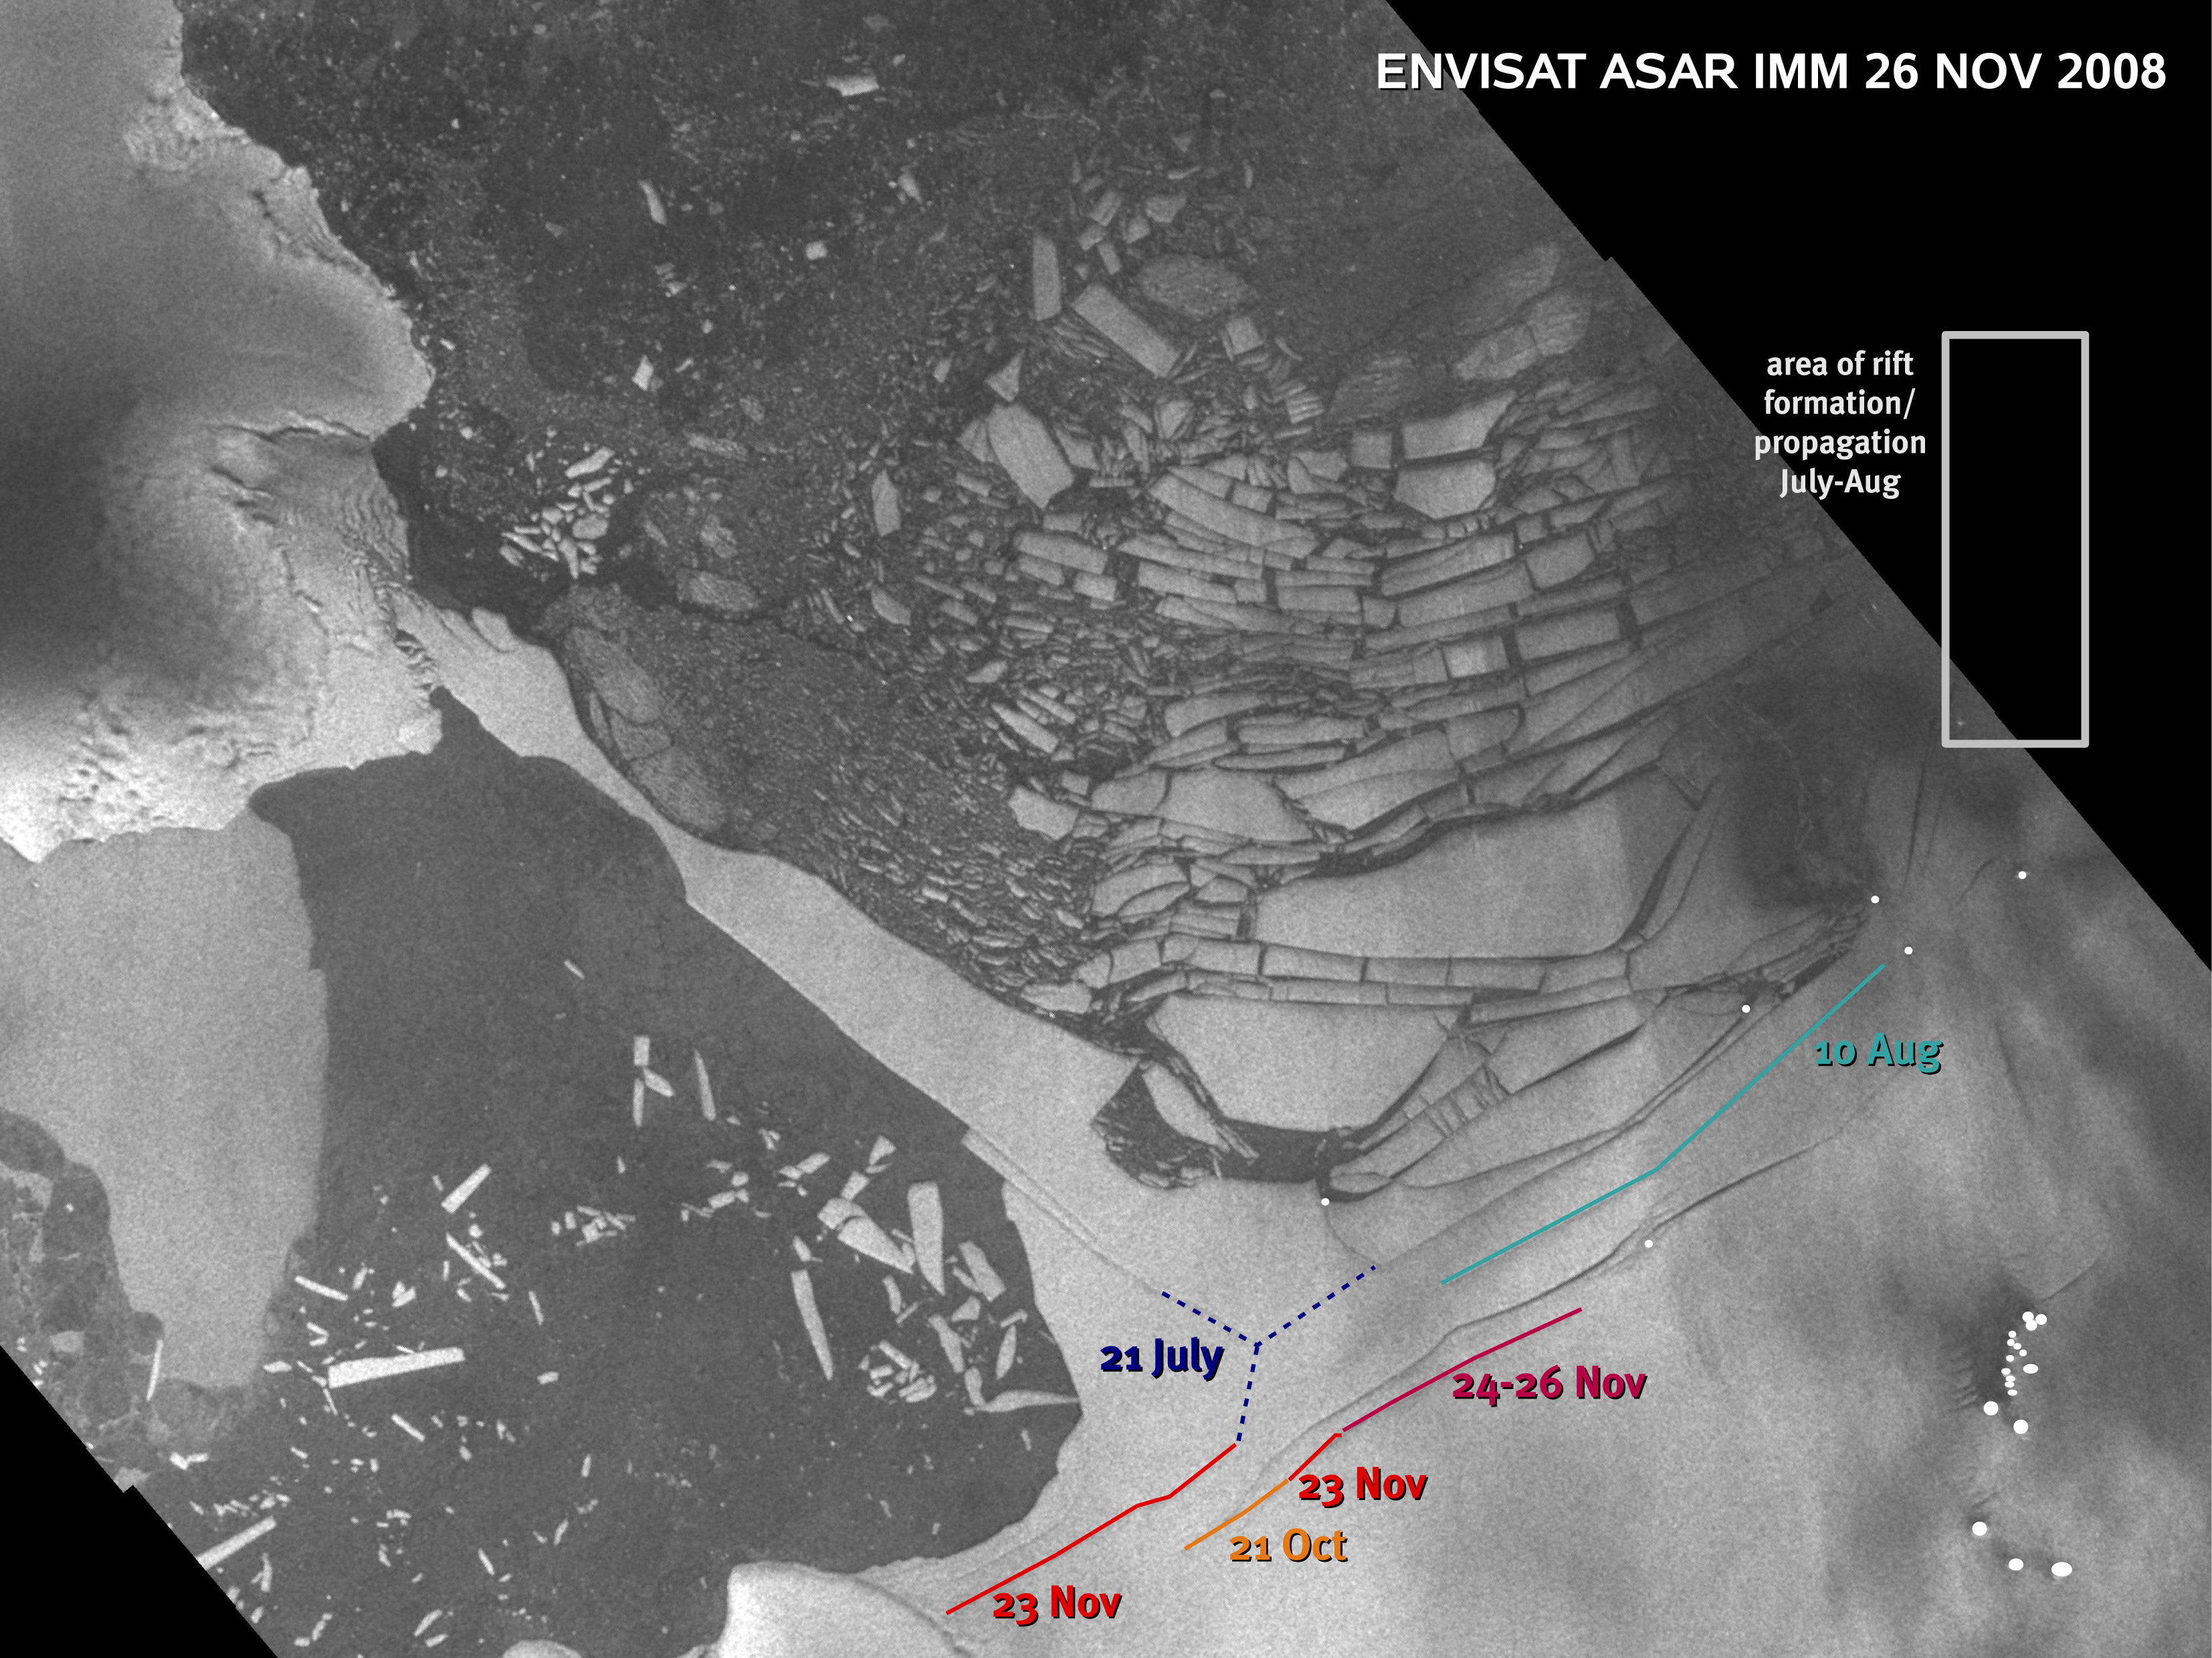
Wilkins Ice Shelf, Credits: A. Humbert, Münster University, Germany (based on ESA Envisat images)
[/caption]
Recent satellite images show new rifts have developed on the Wilkins Ice Shelf which could possibly lead to the opening of the ice bridge that has been preventing the shelf from disintegrating and breaking away from the Antarctic Peninsula. The ice bridge connects the Wilkins Ice Shelf to two islands, Charcot and Latady. As seen in the image above acquired Envisat on November 26, 2008, new rifts (denoted by different colored lines and dates of the events) have formed to the east of Latady Island and appear to be moving in a northerly direction. “These new rifts, which have joined previously existing rifts on the ice shelf (blue dotted line), threaten to break up the chunk of ice located beneath the 21 July date, which would cause the bridge to lose its stabilization and collapse,” said Dr. Angelika Humbert from the Institute of Geophysics at Münster University.
The Wilkins Ice Shelf, a broad plate of floating ice south of South America on the Antarctic Peninsula, had been stable for most of the last century before it began retreating in the 1990s. The peninsula has been experiencing extraordinary warming in the past 50 years of 2.5°C.
In the past 20 years, seven ice shelves along the Antarctic Peninsula have retreated or disintegrated, including the most spectacular break-up of the Larsen B Ice Shelf in 2002, which Envisat captured within days of its launch. Map showing break-up events of Larsen-B and Wilkins ice shelves, as observed by Envisat, in Antarctica. Credits: ESA
In February 2008 an area of about 400 km² broke off from the Wilkins Ice Shelf, narrowing the ice bridge down to a 6 km strip. At the end of May 2008 an area of about 160 km² broke off, reducing the ice bridge to just 2.7 km. Between 30 May and 9 July 2008, the ice shelf experienced further disintegration and lost about 1,350 km².
If the ice shelf breaks away from the peninsula, it will not cause a rise in sea level since it is already floating. However, ice shelves on the Antarctic Peninsula are sandwiched by extraordinarily raising surface air temperatures and a warming ocean, making them important indicators for on-going climate change.
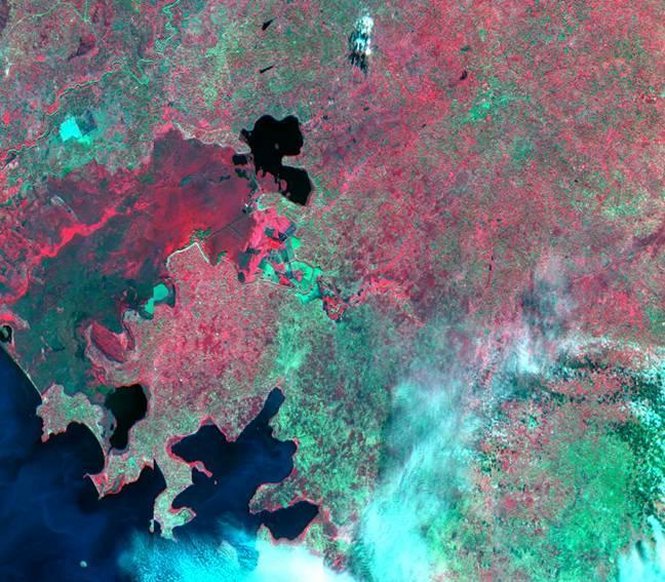
Real-time imagery of a flood-prone region near Lake Victoria will provide information in case of disaster. Image Credit: NASA
[/caption]
Outside of the scientific understanding of our Universe that comes from being a spacefaring civilization, there are many benefits to our continued presence in space. Satellites, besides their obvious benefits like research and communication, also can help keep an eye on the Earth, and are valuable tools in case of disasters such as hurricanes and floods. In other words, satellites can save lives, not to mention allow you to find your own house using Google Earth.
NASA and U.S. Agency for International Development (USAID) recently announced that they will be putting the tool of satellite monitoring in the hands of African countries, giving them previously inaccessible information related to floods, climate change, and other large-scale environmental factors.
NASA and USAID recently unveiled SERVIR-Africa (servir being the Spanish word for “to serve”) in Africa, a monitoring system that provides satellite imaging of the continent using existing United States satellite missions. The project has been in use in southern Mexico, Central America, and the Caribbean since 2005 (thus the Spanish namesake, I’m guessing).
Dan Irwin, SERVIR project director at NASA’s Marshall Space Flight Center in Huntsville, Ala said, “SERVIR-Africa will benefit from the breadth and depth of valuable NASA Earth science satellite and model analyses. Science and technology are key, but ultimately it is the combination of local knowledge along with space-based observations that makes real time monitoring of Africa’s environment effective.”
SERVIR-Africa will provide satellite imaging via the internet to the Regional Center for Mapping of Resources for Development in Nairobi, Kenya. The center is an intergovernmental organization comprised of 15 member states in eastern and southern Africa and is already a pioneer in geospatial mapping in the region.
Data acquired from NASA’s satellites will help predict whether regions of the country are flood-prone, and map regions hit by floods to aid in rescue and cleanup efforts. It’s also possible to create an early-warning tool to predict the spread of vector-borne diseases such as Rift Valley Fever, and monitor climate change on the continent to better understand impacts on many of Africa’s diverse ecosystems. Satellite information will also be used to track urbanization, create more accurate maps and more efficiently manage natural resources.
Better information on climate and flooding will likely translate to the reduction of famine due to poor crops, and will aid in the preservation of already-damaged ecosystems in Africa.
In addition to these long-term benefits, African countries will be better equipped when responding to immediate disasters. SERVIR provided real-time data that led to warnings for specific regions in Panama when heavy rainfall caused large landslides in November 2006, and currently monitors the Alantic ocean for potential hurricanes.
[/caption]
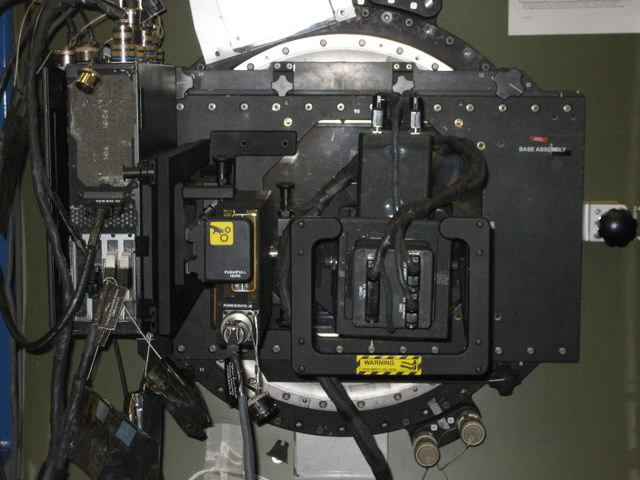
A new camera that will assist farmers, ranchers, foresters and educators is heading to the International Space Station. Students and faculty from the University of North Dakota built the Agricultural Camera, known as AgCam, which will be delivered by Space Shuttle Endeavour on the STS-126 mission to the ISS. The astronauts will install the system on the station but once its set up, students will control the camera remotely, sending commands from the Operations Center at UND.
AgCam will take images in visible and infrared light of growing crops, rangeland, grasslands, forests and wetlands in the northern Great Plains and Rocky Mountain regions. “The beauty of the AgCam is the combination of features it has to provide important data to a wide variety of people,” George Seielstad, the director of AgCam at told Universe Today. “Plus, students have the opportunity to do real engineering and provide valuable data to protect our environment.”
The information from AgCam will provide useful data about crops and other vegetation. “We’re getting two spectral bands, near infrared and red (in the visible),” said Seielstad, from Florida, where he and several of his team are to attend the launch at Kennedy Space Center, “but the difference between those two are the most critical for determining the health of the vegetation of any kind, be it crops, prairie, grassland, pasture, or a forest. So those two bands are critical.” The AgCam will also provide better resolution than Landsat, at 15-20 meter resolution.
AgCam web logo, showing the type of spectral images that will be available. Credit: UMAC
But the big advantage is the frequency of over passes. “The space station comes over sometimes more than once a day in a particular area,” said Seielstad. “But routinely, it comes over at least two or three times a week. Even if it’s cloudy one of those times you’re getting an image a week, and that hasn’t been available before.”
Seielstad said regular images will help people in the agricultural industries to monitor their crops and the environment. “The best thing is the change of getting an image regularly instead of only every once in awhile. It will be like getting a motion picture of your crop rather than the snapshot two or three times a season.”
The camera will only be operational during the growing season in the northern plains of the US, from about April to October. And even though there are times that the ISS goes over the region only at night, Seielstad said there are more times the camera will be gathering data than not during the growing season. “There will be some gaps in the data collection, but it’s a vast improvement from what is currently available,” he said.
Another advantage is the quick delivery of data. “The data comes back to us from the ISS, through the Marshall Space Flight Center to the UND operations center,” said Seielstad. “It can quickly be turned into usable data and sent out . You might be looking at data that’s only 24-48 hours old, which is very fast turnaround.”
All the data will be available to anyone on the AgCam website. “There are several Indian reservations in the area we serve and they manage their own resources, so it will be valuable for them as well,” said Seielstad. “Educators can also make use of it too as a tool to bring into the classroom.
“For every parameter, there are other satellites that can provide similar data, but it yet doesn’t exist in the full combination of what the AgCam will provide,” said Seielstad. AgCam imagery also may assist in disaster management, such as flood monitoring and wild fire mapping.


