[/caption]
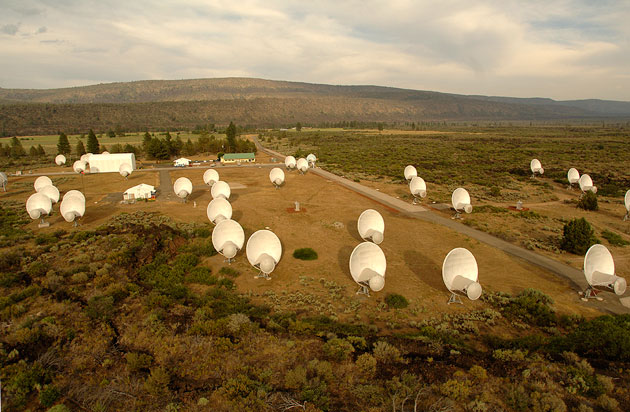
The Allen Telescope Array (ATA) has come online with its initial configuration of 42 antennas. The project, led by the SETI Institute, is a non-governmental project funded by Microsoft co-founder Paul Allen in which eventually 350 small radio antennas will scan the sky for signs of extraterrestrial intelligence. To test the system, the ATA sucessfully picked up the New Horizons probe on its way to Pluto. Senior SETI scientist Seth Shostak said at an event in San Francisco Tuesday night that the array could become strong enough by 2025 to look deep enough into space to find extraterrestrial signals. “We’ll find E.T. within two dozen years,” he said.
That’s, of course, assuming the distance we can look into space will be increased with new instruments yet to be built, and that the projected computing power under Moore’s Law actually happens.
Shostak estimated that if the assumptions about computing power and the strength of forthcoming research instruments are correct, we should be able to search as far out as 500 light years into space by 2025, a distance he predicted would be enough–based on scientist Frank Drake’s estimate of there being 10,000 civilizations in our galaxy alone capable of creating radio transmitters–to find evidence of intelligent life that is broadcasting its existence.
Only time will tell.
For the New Horizons observation, made Sept. 10, operators of the ATA used a synthesized beam formed with 11 of the array’s 6.1-meter (20 foot) antennas – a method called “beamforming” that electronically combines the antennas into a single virtual telescope. The 8.4-GHz spacecraft carrier signal was then fed into the SETI Prelude detection system.
“We’re happy to be the ATA’s new friend in the sky, helping SETI to verify the operations of their electronics,” says New Horizons Principal Investigator Alan Stern. “It’s also nice to know that someone else is checking in on us during our long voyage to Pluto and beyond.”
And what does New Horizons look like to the Allen Telescope Array? This plot shows 678 hertz (Hz) of spectrum collected over 98 seconds. The New Horizons signal can be easily seen as a bright diagonal line, drifting at rate of -0.6 > Hz/second. What New Horizons looks like to The ATA. Credit: SETI Institute
[/caption]
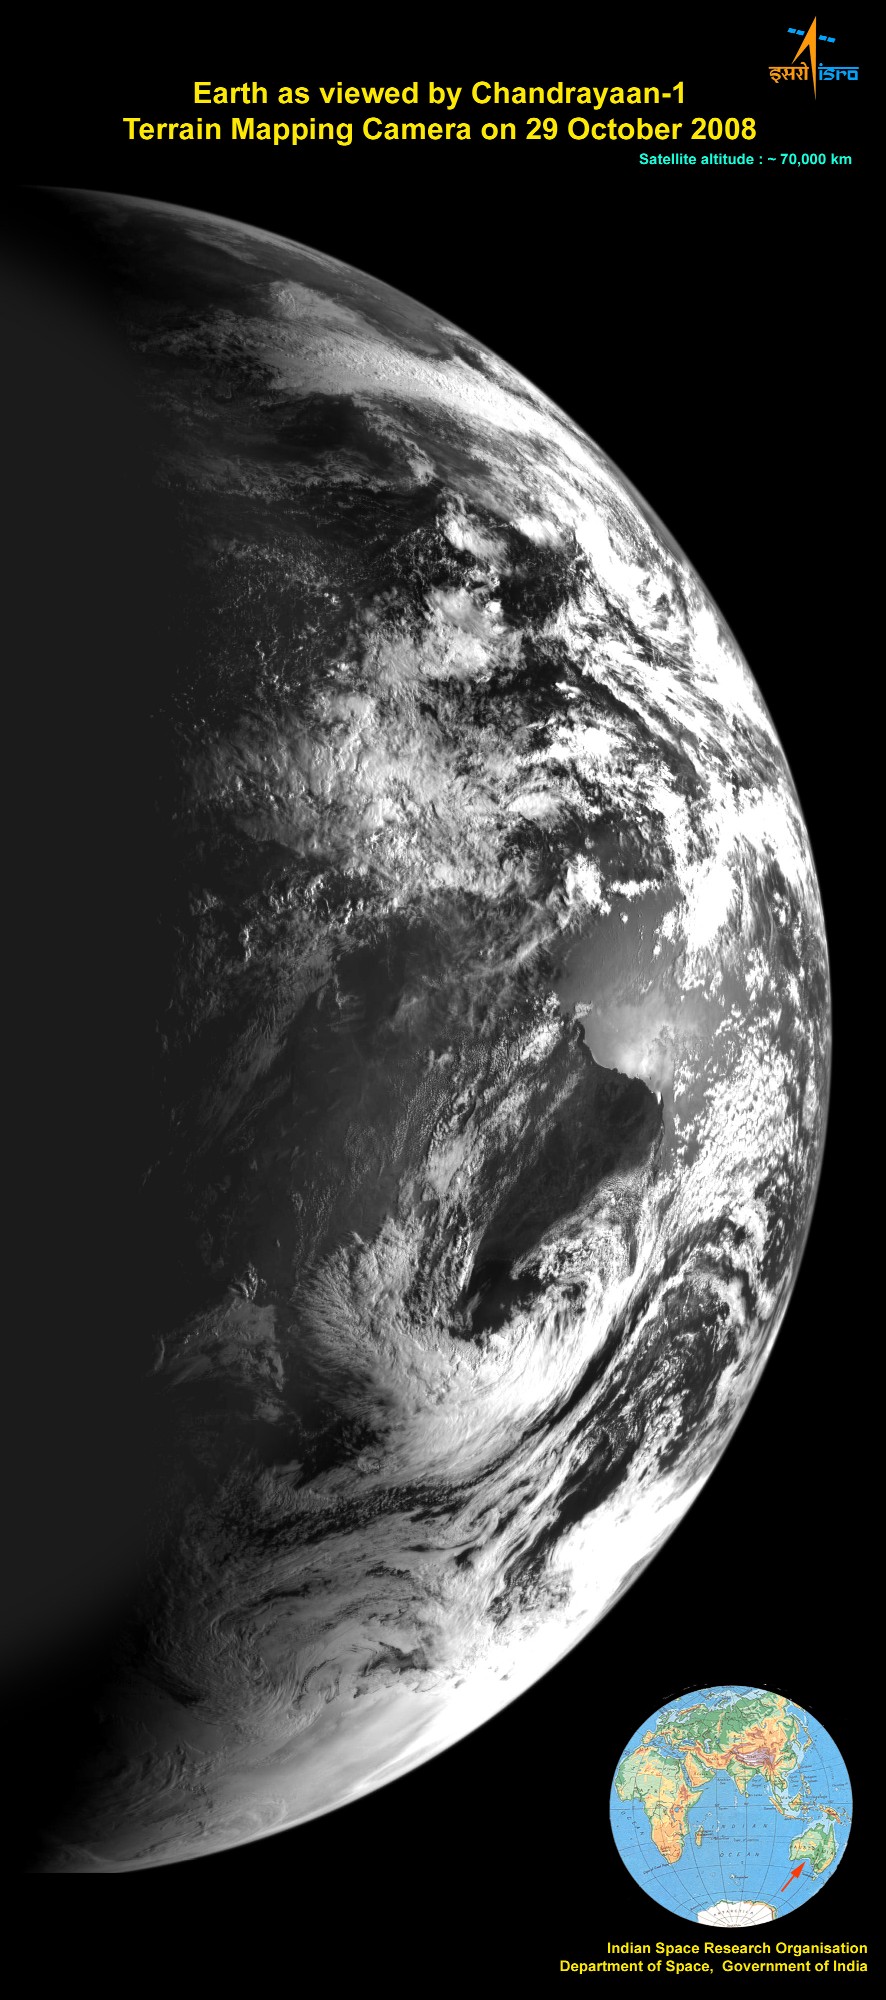
While the Chandrayaan-1 spacecraft wends its way to the Moon with gradually longer elliptical loops around the Earth, mission scientists decided to test out the main camera on board, the Terrain Mapping camera (TMC). The camera snapped this picture of Earth on October 29, 2008, at a distance of 70,000 km, showing Australia. If you’re having a hard time making out the image, it might be because the image is flipped, as though looking at it in a mirror. Emily Lakdawalla over at the Planetary Society blog figured this out and has flipped the image for us (see below). Why is the original image backwards? Emily explains, “Data doesn’t come down from spacecraft in familiar formats like JPEG or TIFF; it’s a stream of ones and zeroes, with a format unique to the science instrument, and scientists and engineers write their own software for translating that into raw image data. There are varying conventions for whether bits are written right or left, and if you take that raw image data and open it up in a piece of off-the-shelf image processing software, the image might be backwards.” As Emily says, the error is not really important. The image is beautiful, and gives reason for great anticipation of the first images it will return of the moon.
In the meantime, there’s another, closer image of Earth from 9,000 km, too…
Here’s the image from 9,000 km:
Chandrayaan-1: Earth from 9,000 km. Credit: ISRO
TMC is one of the eleven scientific instruments on Chandrayaan-1. The camera can take black and white pictures of an object by recording the visible light reflected from it. The instrument has a resolution of about 5 metres.
And here’s Emily’s “visually correct” version of the original Chandrayaan-1 image:
Chandrayaan-1 will execute one more maneuver to raise its orbit, and send the spacecraft to the vicinity of the moon at a distance of about 384,000 km from the Earth. Once the Chandrayaan-1 spacecraft reaches the vicinity of the Moon, the spacecraft will be slowed sufficiently to enable the gravity of the moon capture it into an elliptical orbit. The spacecraft will make observations from the initial orbit, and then the orbit will be lowered a 100 km circular polar orbit. Following this, the Moon Impact Probe (MIP) will be ejected, impacting the lunar surface. Then the main mission will commensce, with Chandrayaan-1 exploring the moon from orbit with its array of instruments for two years.
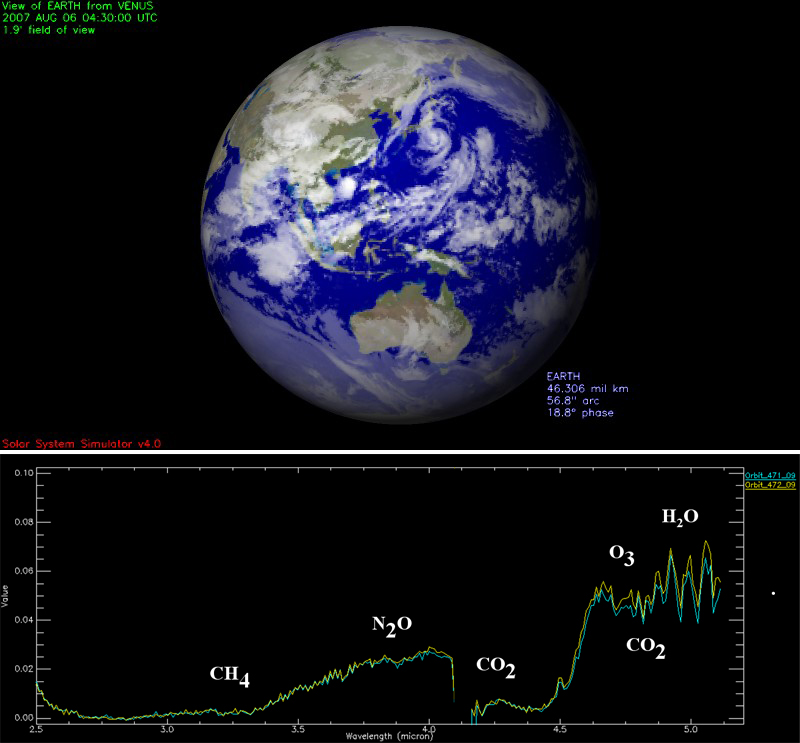
Earth atmospheric molecules detected by Venus Express (ESA)
[/caption]If you are an astronomer looking for a habitable exoplanet orbiting a far-off star, what do you look for? We know from personal experience that we need oxygen and water to live on Earth, so this is a good place to start; look for exoplanets with the spectroscopic signature of O2 and H2O. But this isn’t enough. Venus has oxygen and water in its atmosphere too, so if we only used these two indicators as a measure for habitability, we would be sorely disappointed to find a water and oxygen-rich Venus-like world which has little chance of supporting life (as we know it).
In an effort to understand what a “habitable planet” looks like from afar, European Space Agency (ESA) scientists have decided to do a bit of retrospective astronomy. Venus Express, currently in orbit around Venus, is being used to look back at the blue dot we call home to help us understand what a real habitable planet looks like…
Venus Express (sister ship of ESA’s Mars Express) was launched in November 2005 to begin its seven month journey to Venus. As the spacecraft left Earth orbit, it turned around to take a picture of the blue globe with its Visible and Infrared Thermal Imaging Spectrometer (VIRTIS), but the significance of this quick observation wasn’t realised until a year after Venus Express had entered Venusian orbit. Could the robotic craft be used to watch the Earth from afar?
Giuseppe Piccioni, Venus Express VIRTIS Co-Principal Investigator, in Italy, has been heading a sustained campaign of Earth observations using the VIRTIS instrument orbiting a planet 0.3 AU closer to the Sun. Although Venus has often been referred to as “Earth’s sister planet” the difference couldn’t be more stark. With atmospheric pressures some hundred times that of the Earth, with a choking cocktail of poisonous gases and high surface temperatures, Venus is hardly conducive for life. Earth, on the other hand, has a bountiful ecosystem where life has thrived for over three billion years. However, Piccioni is aware that if viewed from a distance, both Earth and Venus contain some of the basic ingredients for life; how can we be sure distant exoplanets are more Earth-like or more Venus-like? After all, planet habitability doesn’t seem to depend on just oxygen and water.
“We see water and molecular oxygen in Earth’s atmosphere, but Venus also shows these signatures. So looking at these molecules is not enough,” says Piccioni. So, in an attempt to seek out other forms of life, the Italian astronomer is looking toward Earth to pick out more subtle signals for the presence of life on alien worlds.
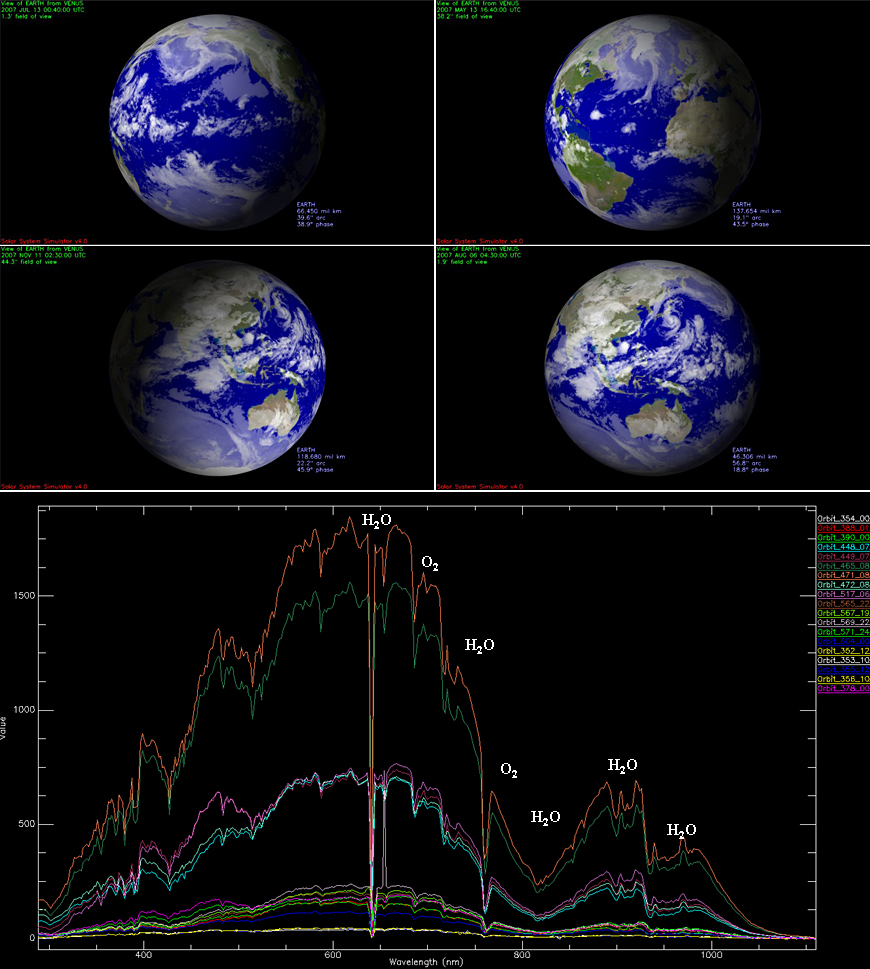
Earth’s oxygen and water as detected by Venus Express. The simulated images of Earth are to show which side of the planet was facing Venus at the time; in actuality Earth would appear as a one-pixel dot (ESA)Venus Express can observe Earth about three times a month, and over the last two years, VIRTIS has captured 40 terrestrial images for analysis. The light captured from these Earth observations cover spectral wavelengths from visible through to near-infrared, but when viewed from Venus, the Earth appears only as a small dot, no bigger than a single pixel in Venus Express’ cameras. Far from being a hindrance, this small dot will help future exoplanet hunters.
Although there are no surface features, this small dot still holds a lot of information. By splitting the light observed into its component wavelengths, the composition of the terrestrial atmosphere can be analysed. Therefore, spectroscopic signals from plant life could be detected for example. “Green plants are bright in the near infrared,” said David Grinspoon, a Venus Express Interdisciplinary Scientist from the Denver Museum of Nature & Science, Colorado, who suggested the programme of sustained Earth observation. “We want to know what can we discern about the Earth’s habitability based on such observations. Whatever we learn about Earth, we can then apply to the study of other worlds,” he added.
Exoplanet hunters are finding more and more alien worlds orbiting stars many light years away, it is only a matter of time before we have the technological ability to image the one-pixel spot of an Earth-like world. By understanding how our habitable planet looks from Venus, we can begin to understand whether these exoplanets are indeed “Earth-like” in every sense of the word…
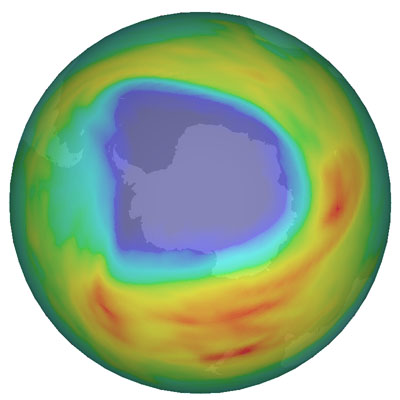
Ozone hole during 7 October 2008 as measured by the Scanning Imaging Absorption Spectrometer for Atmospheric Cartography (SCIAMACHY) atmospheric sensor onboard ESA’s Envisat. Credits: KNMI/ESA
[/caption]
Is the ozone hole was recovering? Maybe not. The protective atmospheric layer of ozone around our planet has been thinning over Antarctica for many years. New satellite data indicates the 2008 ozone hole is larger both in size and ozone loss than 2007 but is not as large as the record year of 2006. This year the area of the thinned ozone layer over the South Pole reached about 27 million square kilometers, compared to 25 million square kilometers in 2007 and a record ozone hole extension of 29 million square kilometers in 2006, which is about the size of the North American continent. Ozone is a protective atmospheric layer found about 25 kilometers in altitude that acts as a sunlight filter, shielding life on Earth from harmful ultraviolet rays. A thinner ozone layer can increase the risk of skin cancer and cataracts and harm marine life. What causes the ozone layer to change from year to year, and if CFC’s have been banned, why isn’t the ozone recovering?
The depletion of ozone is caused by extreme cold temperatures at high altitude and the presence of ozone-destructing gases in the atmosphere such as chlorine and bromine. Most of these gases originate from man-made products like chlorofluorocarbons (CFCs), which were phased out under the 1987 Montreal Protocol. But they continue to linger in the atmosphere.
Depending on the weather conditions, the size the Antarctic ozone hole varies every year. As the polar spring arrives in September or October, the combination of returning sunlight and the presence of so-called stratospheric clouds (PSCs) over the Antarctic leads to a release of highly ozone-reactive chlorine radicals present in the atmosphere that break ozone down into individual oxygen molecules. A single molecule of chlorine has the potential to break down thousands of molecules of ozone.
Chlorine activation and ozone hole extension early September 2007 and 2008. Credits: DLR
Colder temperatures in the stratosphere over Antarctica, combined with a high formation rate of PSCs caused more lingering chlorine radicals to be released, making the current hole one of the largest. 2006 saw the largest hole. A unit of measurement called a Dobson Unit describes the thickness of the ozone layer, and this year (2008) about 120 Dobson Units were observed compared to around 100 Dobson Units in 2006.
The analysis is based upon the Scanning Imaging Absorption Spectrometer for Atmospheric Cartography (SCIAMACHY) atmospheric sensor onboard ESA’s Envisat, the Global Ozone Monitoring Experiment (GOME) aboard ESA’s ERS-2 and its follow-on instrument GOME-2 aboard EUMETSAT’s MetOp.
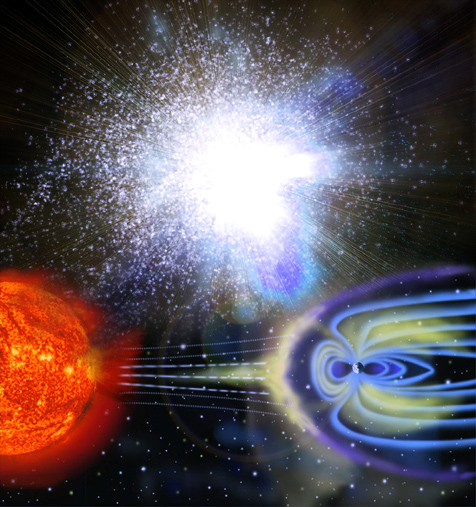
Could the magnetic field of the Earth really reverse in 2012? I wouldn't bet on it...
[/caption]Apparently, on December 21st 2012, our planet will experience a powerful event. This time we’re not talking about Planet X, Nibiru or a “killer” solar flare, this event will originate deep within the core of our planet, forcing a catastrophic change in our protective magnetic field. Not only will we notice a rapid reduction in magnetic field strength, we’ll also see the magnetic poles rapidly reverse polarity (i.e. the north magnetic pole will be located over the South Pole and vice versa). So what does this mean to us? If we are to believe the doomsayers, we’ll be exposed to the vast quantities of radiation blasting from the Sun; with a reversing magnetic field comes a weakening in the Earth’s ability to deflect cosmic rays. Our armada of communication and military satellites will drop from orbit, adding to the chaos on the ground. There will be social unrest, warfare, famine and economic collapse. Without GPS, our airliners will also plough into the ground…
Using the Mayan Prophecy as an excuse to create new and explosive ways in which our planet may be destroyed, 20 12 2012 doomsayers use the geomagnetic shift theory as if it is set in stone. Simply because scientists have said that it might happen within the next millennium appears to be proof enough that it will happen in four years time. Alas, although this theory has some scientific backing, there is no way that anyone can predict when geomagnetic reversal might happen to the nearest day or to the nearest million years…
Firstly, let’s differentiate between geomagnetic reversal and polar shift. Geomagnetic reversal is the change in the magnetic field of the Earth, where the magnetic north pole shifts to the South Polar Region and the south magnetic pole shifts to the North Polar Region. Once this process is complete, our compasses would point toward Antarctica, rather than northern Canada. Polar shift is considered to be a less likely event that occurs a few times in the evolutionary timescale of the Solar System. There are a couple of examples of planets that have suffered a catastrophic polar shift, including Venus (which rotates in an opposite direction to all the other planets, therefore it was flipped upside down by some huge event, such as a planetary collision) and Uranus (which rotates on its side, having been knocked off-axis by an impact, or some gravitational effect caused by Jupiter and Saturn). Many authors (including the doomsayers themselves) often cite both geomagnetic reversal and polar shift as being one of the same thing. This isn’t the case.
So, on with geomagnetic reversal…
How often does it happen? The Earths interior (University of Chicago)The reasons behind the reversal of the magnetic poles is poorly understood, but it is all down to the internal dynamics of Planet Earth. As our planet spins, the molten iron in the core flows freely, forcing free electrons to flow with it. This convective motion of charged particles sets up a magnetic field which bases its poles in the North and South Polar Regions (a dipole). This is known as the dynamo effect. The resulting magnetic field approximates a bar magnet, allowing the field to envelop our planet.
This magnetic field passes through the core to the crust and pushes into space as the Earth’s magnetosphere, a protective bubble constantly being buffeted by the solar wind. As the solar wind particles are usually charged, the Earth’s powerful magnetosphere deflects the particles, only allowing them into the polar cusp regions where the polar magnetic fieldlines become “open.” The regions at which these energetic particles are allowed to enter glow as aurorae.
Usually this situation can last for aeons (a stable magnetic field threaded through the North and South Polar Regions), but occasionally, the magnetic field is known to reverse and alter in strength. Why is this?
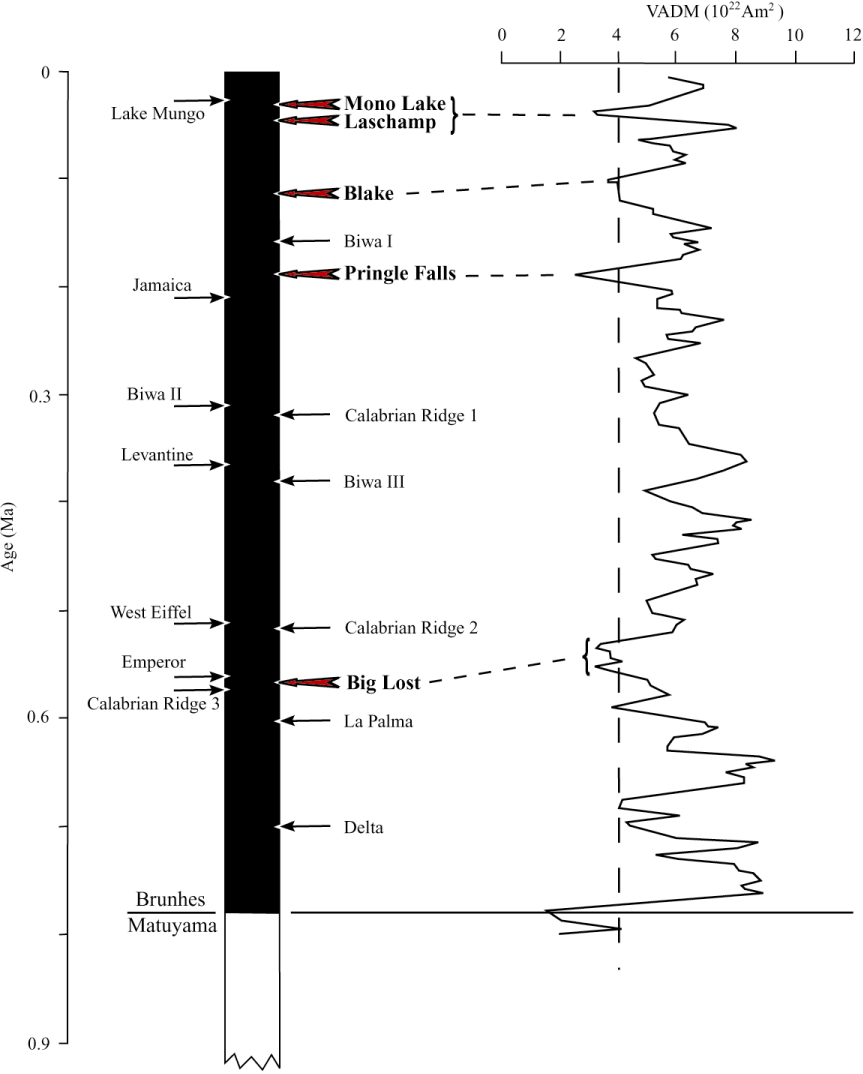
A chart showing Earths polarity reversals over the last 160 million years. Black = normal polarity, White = reversed polarity. From Lowrie (1997)
Again, we simply do not know. We do know that this magnetic pole flip-flop has occurred many times in the last few million years, the last occurred 780,000 years ago according to ferromagnetic sediment. A few scaremongering articles have said geomagnetic reversal occurs with “clockwork regularity” – this is simply not true. As can be seen from the diagram (left), magnetic reversal has occurred fairly chaotically in the last 160 million years. Long-term data suggests that the longest stable period between magnetic “flips” is nearly 40 million years (during the Cretaceous period over 65 million years BC) and the shortest is a few hundred years.
Some 2012 theories suggest that the Earth’s geomagnetic reversal is connected to the natural 11-year solar cycle. Again, there is absolutely no scientific evidence to support this claim. No data has ever been produced suggesting a Sun-Earth magnetic polarity change connection.
So, already this doomsday theory falters in that geomagnetic reversal does not occur with “clockwork regularity,” and it has no connection with solar dynamics. We are not due a magnetic flip as we cannot predict when the next one is going to occur, magnetic reversals occur at seemingly random points in history.
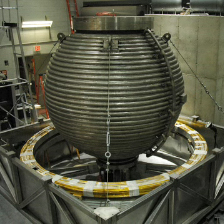
What causes geomagnetic reversal? The model Earth, can a magnetic field be modelled in the lab? (Flora Lichtman, NPR)Research is afoot to try to understand the internal dynamics of our planet. As the Earth spins, the molten iron inside churns and flows in a fairly stable manner for millennia. For some reason during geomagnetic reversal, some instability causes an interruption to the steady generation of a global magnetic field, causing it to flip-flop between the poles.
In a previous Universe Today article, we discussed the efforts of geophysicist Dan Lathrop’s attempts to create his own “model Earth,” setting a 26 tonne ball (containing a molten iron analogue, sodium) spinning to see if the internal motion of the fluid could set up a magnetic field. This huge laboratory experiment is testament to the efforts being put into understanding how our Earth even generates a magnetic field, let alone why it randomly reverses.
A minority view (which, again is used by doomsayers to link geomagnetic reversal with Planet X) is that there may be some external influence that causes the reversal. You will often see associated with the Planet X/Nibiru claims that should this mystery object encounter the inner Solar System during its highly elliptical orbit, the magnetic field disturbance could upset the internal dynamics of the Earth (and the Sun, possibly generating that “killer” solar flare I discussed back in June). This theory is a poor attempt to link several doomsday scenarios with a common harbinger of doom (i.e. Planet X). There is no reason to think the strong magnetic field of the Earth can be influenced by any external force, let alone a non-existent planet (or was that a brown dwarf?).
The magnetic field strength waxes and wanes… Variations in geomagnetic field in western US since last reversal. The vertical dashed line is the critical value of intensity below which Guyodo and Valet (1999) consider several directional excursions to have occurred.New research into the Earth’s magnetic field was published recently in the September 26th issue of Science, suggesting that the Earth’s magnetic field isn’t as simple as we once believed. In addition to the North-South dipole, there is a weaker magnetic field spread around the planet, probably generated in the outer core of the Earth.
The Earth’s magnetic field is measured to vary in field strength and it is a well known fact that the magnetic field strength is currently experiencing a downward trend. The new research paper, co-authored by geochronologist Brad Singer of the University of Wisconsin, suggests that the weaker magnetic field is critical to geomagnetic reversal. Should the stronger dipole (north-south) field reduce below the magnetic field strength of this usually weaker, distributed field, a geomagnetic reversal is possible.
“The field is not always stable, the convection and the nature of the flow changes, and it can cause the dipole that’s generated to wax and wane in intensity and strength,” Singer said. “When it becomes very weak, it’s less capable of reaching to the surface of the Earth, and what you start to see emerge is this non-axial dipole, the weaker part of the field that’s left over.” Singer’s research group analysed samples of ancient lava from volcanoes in Tahiti and Germany between 500,000 and 700,000 years ago. By looking at an iron-rich mineral called magnetite in the lava, the researchers were able to deduce the direction of the magnetic field.
The spin of the electrons in the mineral is governed by the dominant magnetic field. During times of strong dipolar field, these electrons pointed toward the magnetic North Pole. During times of weak dipolar field, the electrons pointed to wherever the dominant field was, in this case the distributed magnetic field. They think that when the weakened dipolar field drops below a certain threshold, the distributed field pulls the dipolar field off-axis, causing a geomagnetic shift.
“The magnetic field is one of the most fundamental features of the Earth,” Singer said. “But it’s still one of the biggest enigmas in science. Why [the flip] happens is something people have been chasing for more than a hundred years.”
Our meandering magnetic pole The movement of Earth's north magnetic pole across the Canadian arctic, 1831--2001 (Geological Survey of Canada)Although there appears to be a current downward trend in magnetic field strength, the current magnetic field is still considered to be “above average” when compared with the variations measured in recent history. According to researchers at Scripps Institution of Oceanography, San Diego, if the magnetic field continued to decrease at the current trend, the dipolar field would effectively be zero in 500 years time. However, it is more likely that the field strength will simply rebound and increase in strength as it has done over the last several thousand years, continuing with its natural fluctuations.
The positions of the magnetic poles are also known to be wondering over Arctic and Antarctic locations. Take the magnetic north pole for example (pictured left); it has accelerated north over the Canadian plains from 10 km per year in the 20th Century to 40 km per year more recently. It is thought that if the point of magnetic north continues this trend, it will exit North America and enter Siberia in a few decades time. This is not a new phenomenon however. Ever since James Ross’ discovery of the location of the north magnetic pole for the first time in 1831, it’s location has meandered hundreds of miles (even though today’s measurements show some acceleration).
So, no doomsday then?
Geomagnetic reversal is an engrossing area of geophysical research that will continue to occupy physicists and geologists for many years to come. Although the dynamics behind this event are not fully understood, there is absolutely no scientific evidence supporting the claim that there could be a geomagnetic reversal around the time of December 21st, 2012.
Besides, the effects of such a reversal have been totally over-hyped. Should we experience geomagnetic reversal in our lifetimes (which we probably won’t), it is unlikely that we’ll be cooked alive by the Solar Wind, or be wiped out by cosmic rays. It is unlikely that we’ll suffer any mass extinction event (after all, early man, homo erectus, lived through the last geomagnetic shift, apparently with ease). We’ll most likely experience aurorae at all latitudes whilst the dipolar magnetic field settles down to its new, reversed state, and there might be a small increase in energetic particles from space (remember, just because the magnetosphere is weakened, doesn’t mean we wont have magnetic protection), but we’ll still be (largely) protected by our thick atmosphere.
Satellites may malfunction and migrating birds may become confused, but to predict world collapse is a hard pill to swallow.
In conclusion:
Geomagnetic reversal is chaotic in nature. There is no way we can predict it.
Simply because the magnetic field of the Earth is weakening does not mean it is near collapse. Geomagnetic field strength is “above average” if we compare today’s measurements with the last few million years.
The magnetic poles are not set in geographical locations, they move (at varying speeds) and have done ever since measurements began.
There is no evidence to suggest external forcing of internal geomagnetic dynamics of the Earth. Therefore there is no evidence of the solar cycle-geomagnetic shift connection. Don’t get me started on Planet X.
So, do you think there will be a geomagnetic reversal event in 2012? I thought not.
Once again, we find another 2012 doomsday scenario to be flawed in so many ways. There is no doubt that geomagnetic reversal will happen in the future for Earth, but we’re talking about time scales anything from an optimistic (and unlikely) 500 years to millions of years, certainly not in the coming four years…
Sources: NASA, US News, SciVee, How To Survive 2012, AGU
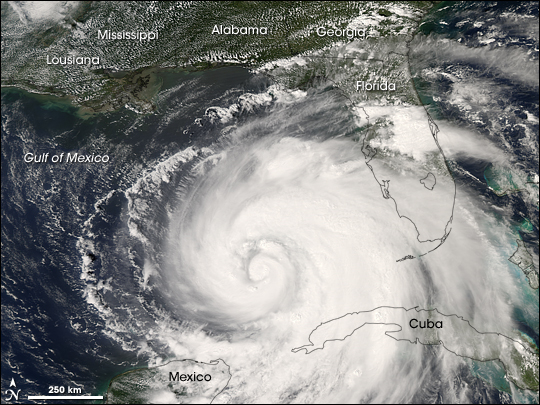
Hurricane Ike is bearing down on the US gulf coast, and even before landfall, is causing problems. Nearly 1 million people along the Texas coast have been ordered to evacuate, the other 3 million people in the Houston metro area have been asked not to leave, in hopes of avoiding the panic of three years ago, when evacuations ordered in advance of Hurricane Rita sent millions onto highways causing traffic jams and deadly accidents. The airports in Houston will close tomorrow, and NASA’s Johnson Space Center closed today. Image of Ike taken from the ISS. Credit: NASA Astronauts on board the International Space Station had this view of Ike from their orbital perch 220 statute miles above the Earth. (See below for a larger, close-up image.) Mission managers for the ISS have taken up residence in a hotel far inland, armed with laptops and a secure high speed internet connection in order to maintain contact with the orbiting space station. Ike is currently a Category 2 hurricane according to the National Hurricane Center, but forecasters were predicting that Ike might reach Category 3 strength in the warm waters of the Gulf prior to its projected landfall on the central Texas coastline.
TRMM (Tropical Rainfall Measuring Mission) spacecraft observed this view of Hurricane Ike on September 10, 2008 at 1745 UTC. The storm was a category 2 hurricane with sustained winds of 85 knots (97.75 mph) and a pressure reading of 958 millibars. At this time, the storm has two nearby well-defined wind maxima of roughly equal strength. There is a 17 km tower in the outer eye.
Click here for an animation from the TRMM spacecraft data.
The astronauts on board the International Space Station had this incredible view of the hurricane as it approached the Gulf Coast.
Ike was a Category 4 storm before its passage over Cuba stripped it of some of its power. It re-emerged in the Gulf of Mexico as a Category 1 storm and re-strengthened.
As of 10:00 a.m., Sept. 11, hurricane warnings are up from Morgan City Louisiana to Baffin Bay, Texas. Hurricane conditions could reach the coast within the warning area by late Friday, Sept. 12.
Ike is a Category 2 hurricane with maximum sustained winds near 100 mph. He is forecast to strengthen to a Category 3 storm before reaching the Texas coastline. Ike is moving west-northwest near 10 mph and will be near the coast late on Sept. 12, however, because Ike is large, tropical storm force winds will be felt far in advance.
Sources: NASA’s ISS Page, NASA Earth Observatory Page, The Weather Channel. Here are even more hurricane photos and hurricane images.
Artist rendition of the GOCE Satellite in orbit. Credit: ESA
[/caption]
The launch of ESA’s GOCE satellite (the ‘sexy’ spacecraft) will be delayed. During launch preparations yesterday (Sunday, Sept. 7) a problem was discovered with a guidance and navigation subsystems on the launch vehicle’s upper stage. To fix the problem, guidance and navigation unit will have to be replace. The upper stage, which includes the GOCE satellite, will have to be de-mated from the rest of the Breeze KM rocket and brought in from the launch site to be repaired. The launch, which will take place at the Plesetsk cosmodrome in northern Russia, is now scheduled for October 5 at 16:21 CEST.
The satellite and upper stage will be brought to an integration room. Once in the clean room, the protective fairing that shelters the satellite will be opened and the spacecraft and its adaptor system will be dismounted in order to allow access to the Breeze KM equipment to be replaced.
GOCE, which stands for Gravity field and steady-state Ocean Circulation Explorer will investigate and map Earth’s gravitational field. ESA officials say the satellite and its mission will not be affected by this launch delay.
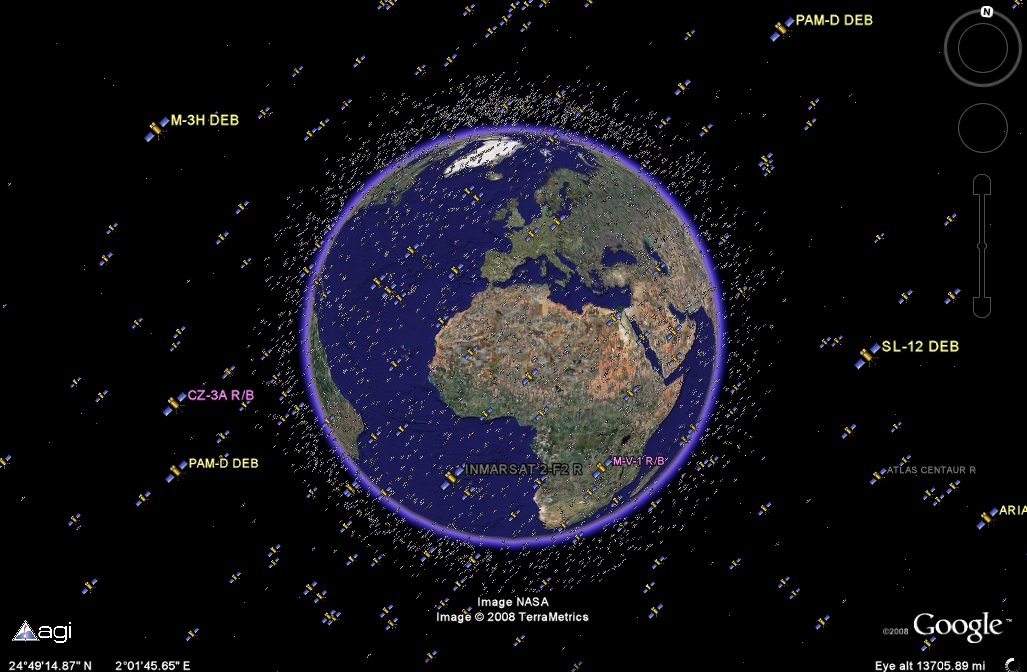
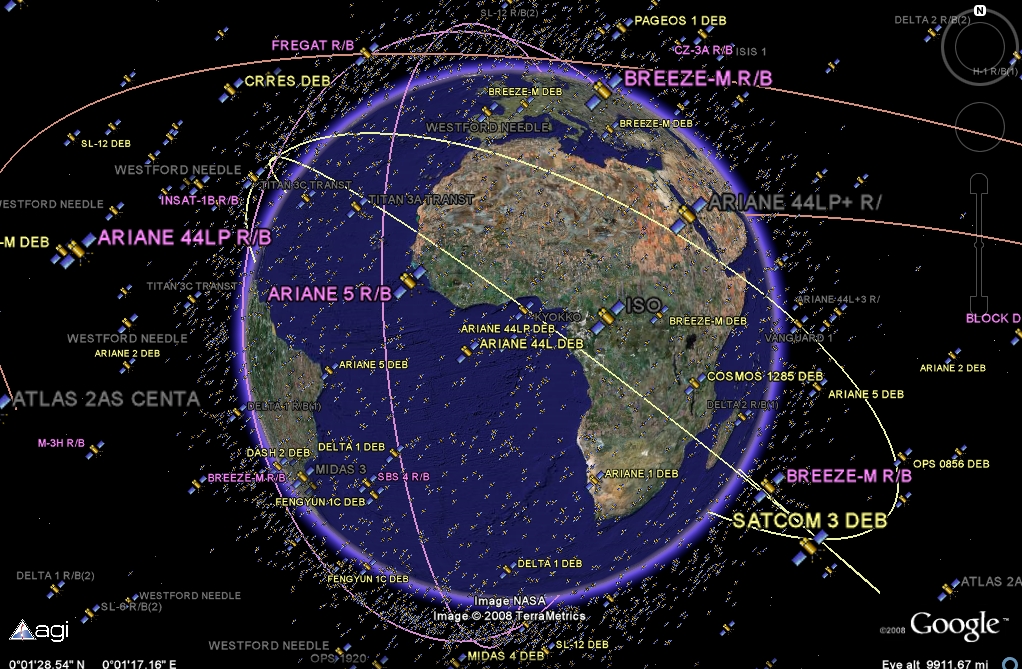
It's getting crowded out there: active and inactive satellites are tracked (Google/Analytical Graphics)
[/caption]
OK, I’ve just wasted an hour in simulated space, checking out some of the active and junked satellites orbiting our planet. Google Earth can be an addictive thing at the best of times, but when 13,000 of the satellites in Earth orbit can be viewed by a new plug-in for the program, you may find yourself hooked for longer than usual. The United States Strategic Command keeps very close tabs on what is orbiting our planet and where they are at any given time, and now with the help of Google Earth, you can explore the satellites, plot their orbital trajectories and see just how crowded space can be. Never before have geostationary communication satellites been so interesting!
Just trackin': playing around with the orbital trajectory option (Google/Analytical Graphics)
Tracking space junk is paramount to all our activities in space. Every time we put a “useful” satellite into orbit – to service our communication needs, monitor the weather or spy on other countries – we are amplifying the growing space junk problem surrounding Earth. In February, I wrote a Universe Today article reporting on Google Earth’s ability to plot all known bits of space junk orbiting the Earth. I think it shocked many to see the problem in dazzling 3D. Now a new plug-in has been released detailing the positions of 13,000 alive and dead satellites being tracked by the US military.
At the end of last month, the danger of discarded satellite parts became all too real for the crew of the International Space Station. Nancy wrote about the heroic efforts of the (soon to be dumped) ATV that boosted the station clear of passing debris from a disintegrated Russian satellite. According to officials, the ATV carried out a 5 minute burn, slowing the station and lowering its orbit by 1.5 km (1 mile). The chunk of Russian spy satellite was allowed to pass without incident.
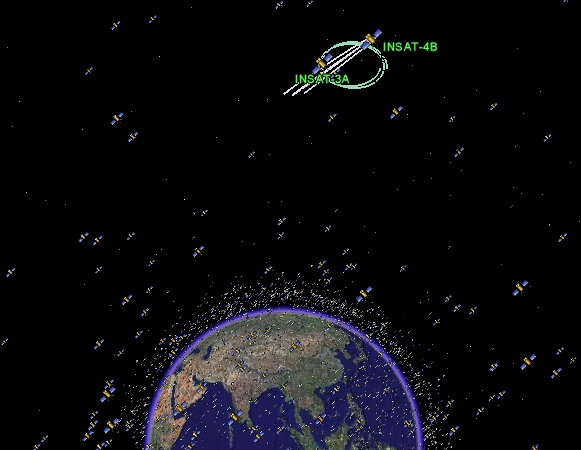
InSat-4, active communications satellites serving India. They're in geosynchronous orbit don't you know? (Google/Analytical Graphics)
Now you can see the space debris being carefully watched by the US and do some satellite tracking yourself. This new Google Earth plug-in (.kmz file for Google Earth) allows you not only to get information on the 13,000 objects tracked by the US Strategic Command, it also lets you plot their orbits. All the way from low Earth to geostationary orbits, you can access information about who launched the satellite, whether it is active or not, its launch date, mass and orbital information (apogee/perigee). By clicking “Display Trajectory in Fixed Frame” in the information panel that appears when you select the satellite, the orbital path is displayed. It is worth noting that this is the orbital trajectory in relation to the Earth’s rotation (or the “fixed frame”), so geostationary satellites will appear to have no orbital motion, as you’d expect.
I spent a long time clicking on the various satellites, constantly surprised by the huge number of inactive satellites there were. I also checked out some information on satellites I’d never heard of (like the active InSat-3A/4B geostationary communication satellites I found oscillating around each other, pictured).
Although it is shocking to see the sheer number of satellites out there (reminding me that Kessler Syndrome could be a very real threat in the future), learning about the stuff orbiting Earth was great fun.
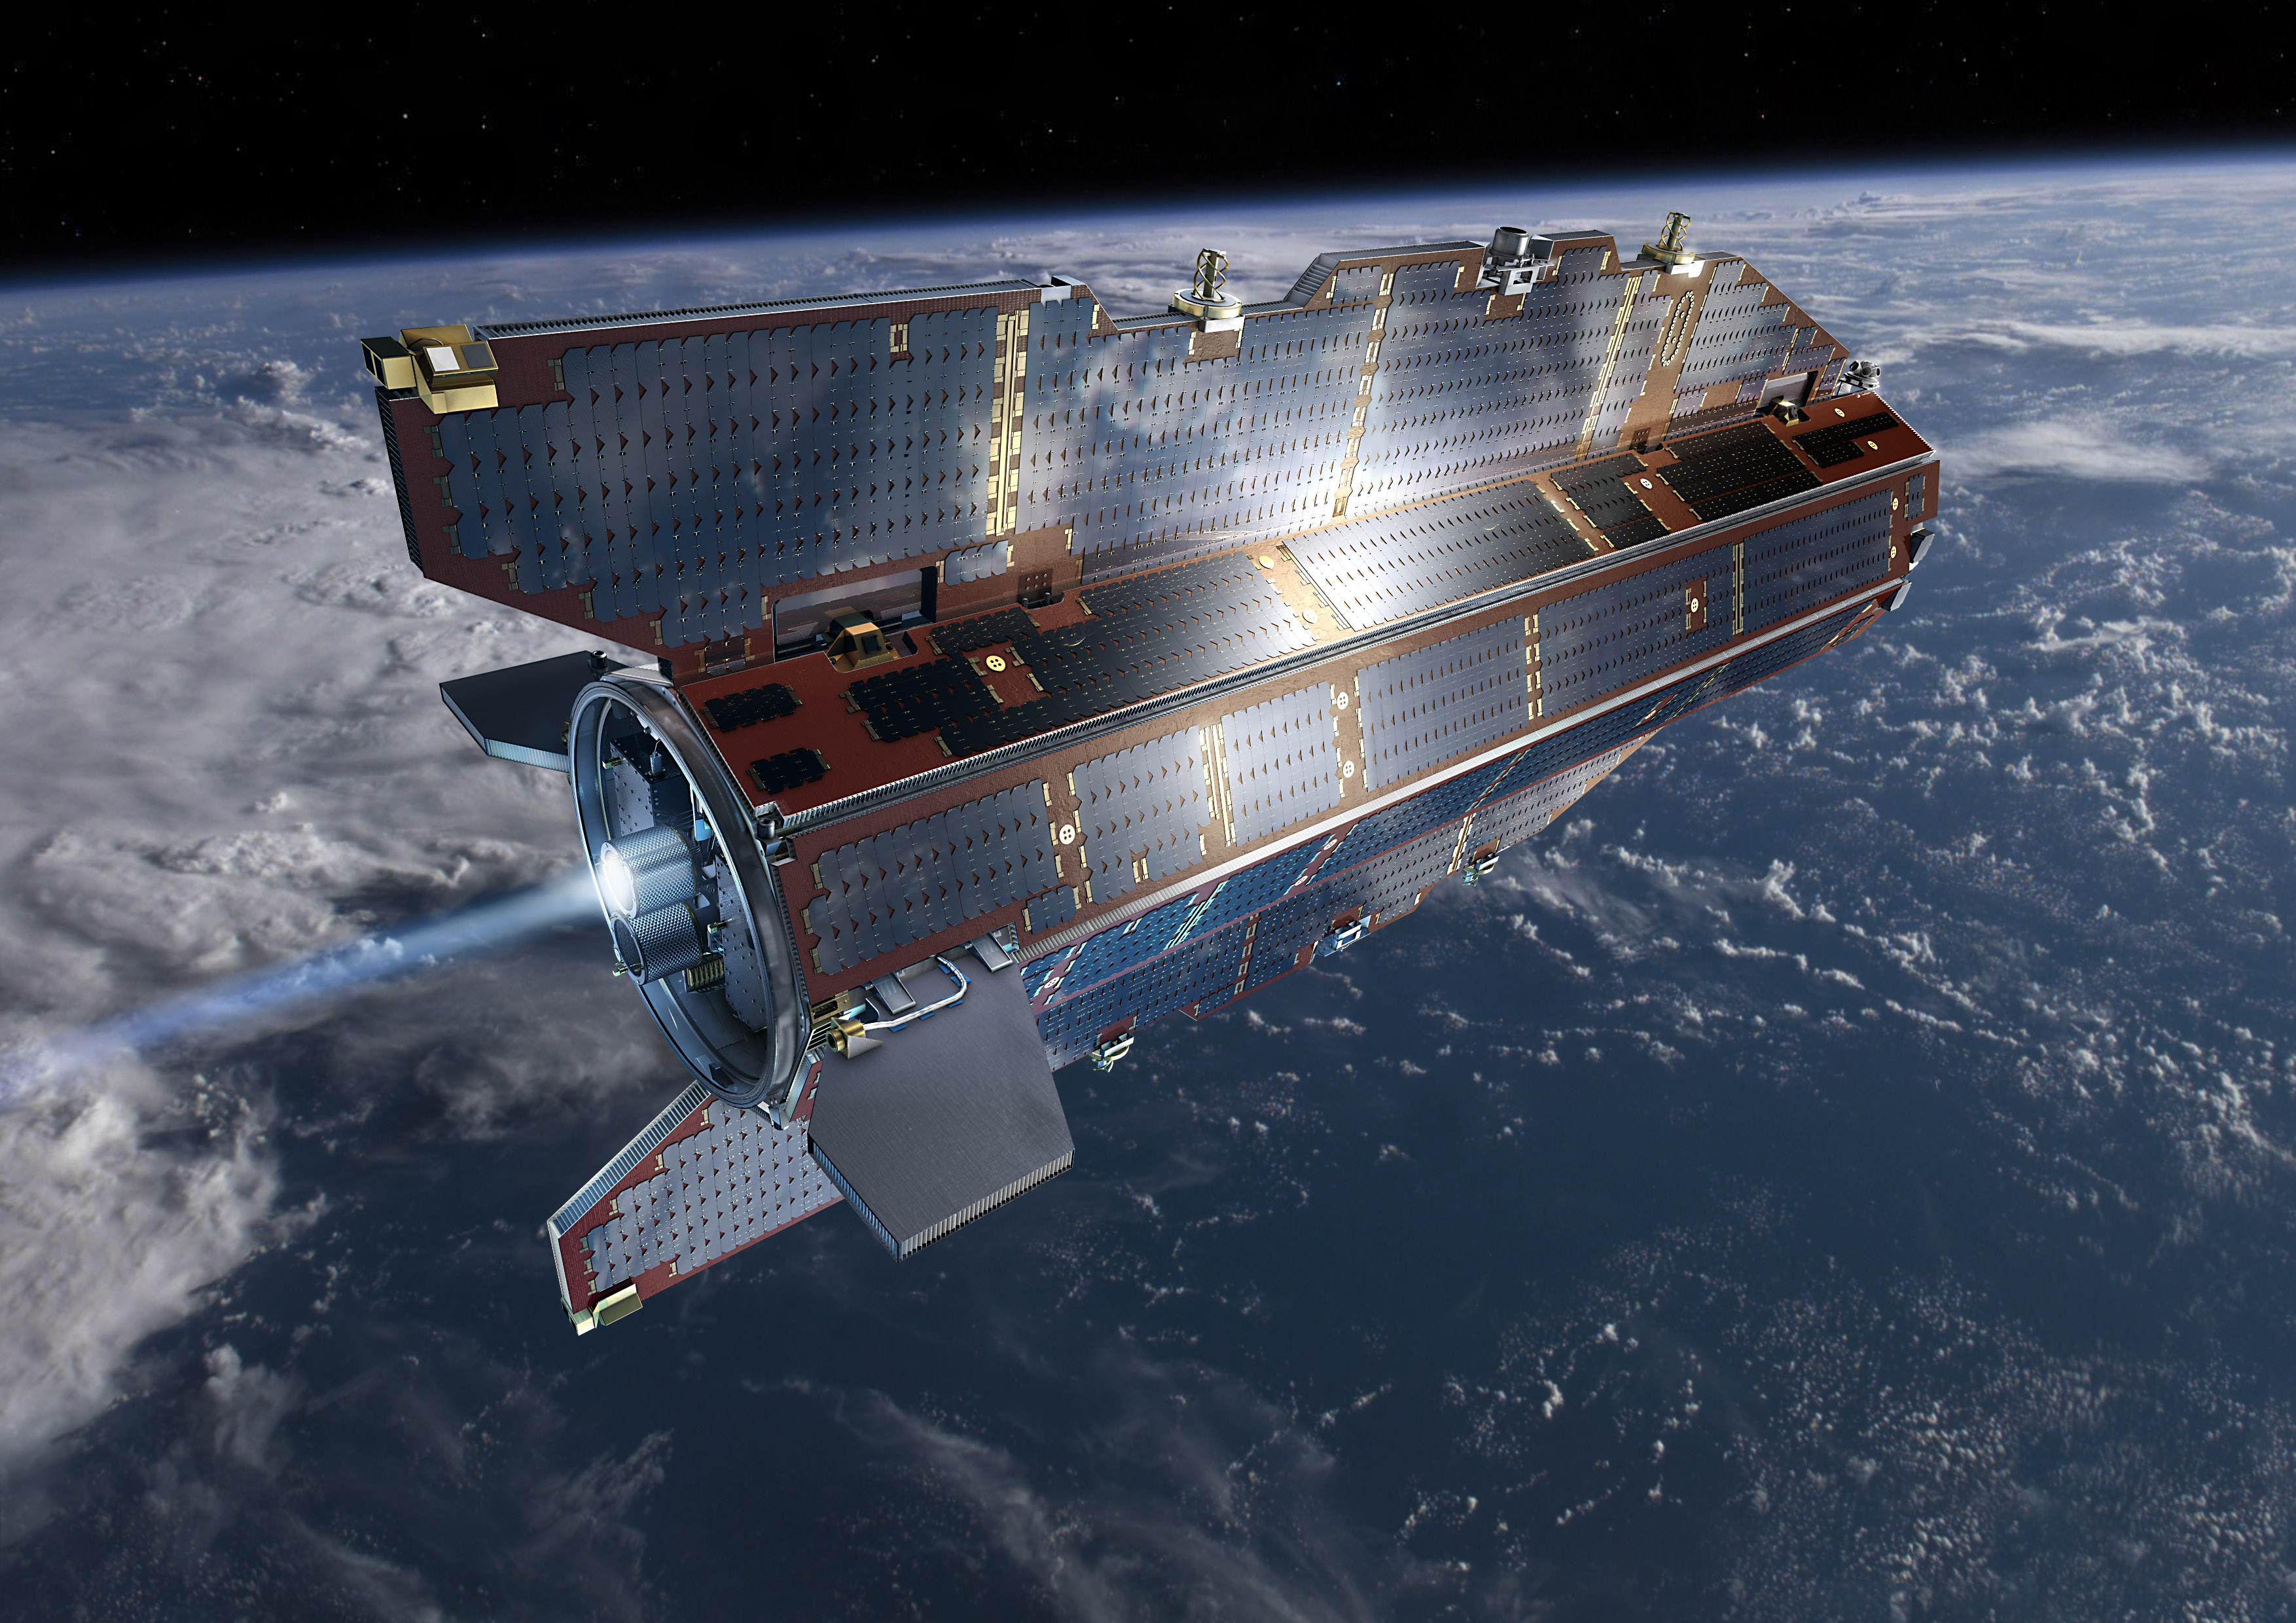
GOCE: Spacecraft of the future is here! Credit: ESA
[/caption]
This has to be the sexiest looking spacecraft ever built by humankind. No, it’s not a starship or battle cruiser (although it does look a little like the Eagle spacecraft from the old television show Space: 1999). This sleek, slender, sexy, shiny and sophisticated spacecraft is an Earth-orbiting satellite that will investigate our planet’s gravitational field and map the reference shape of our planet – the geoid – with unprecedented resolution and accuracy. GOCE, or the Gravity field and steady-state Ocean Circulation Explorer is scheduled to launch on Wed. September 10 at 16:21 CEST (14:21 UTC). Why such a sleek design? As GOCE Systems Manager Michael Fehringer says, “Form follows function not only in the world of fashion! To fly low and avoid air drag, the best shape for the satellite to be is long, slender and absolutely symmetrical along the direction of flight.”
ESA’s 1 ton, 5 meter-long spacecraft will be in an extra low orbit (260 km, or 161 miles) and will experience drag from Earth’s upper atmosphere, so smooth and lean helps reduce the friction. Adding to the sleek design is that the solar panels are attached to the long body of the satellite instead of sticking out clumsily and adding to the drag. ESA has a great animation of GOCE in flight. Although the design will help, the spacecraft will need a boost to its orbit occasionally, and has state of the art ion engines.
GOCE on the launchpad. Credit: ESA
GOCE will be in a sun-synchronous orbit, meaning it will be almost always be in sunlight, providing a stable thermal environment for the spacecraft.
The instruments are all placed along the axis of the satellite’s body, adding to its sleekness — check out this great animation. GOCE carries a set of six state-of-the-art high-sensitivity accelerometers to measure the components of the gravity field along all three axes. The data collected will provide a high-resolution map of the geoid and of gravitational anomalies. This will greatly improve our knowledge and understanding of the Earth’s internal structure, and will be used as a much-improved reference for ocean and climate studies, including sea-level changes, oceanic circulation and ice caps dynamics survey. Numerous applications are expected in climatology, oceanography and geophysics, as well as for geodetic and positioning activities.
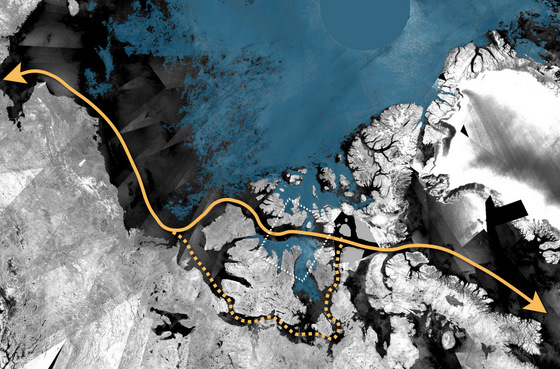
The arrow shows the Northwest Passage, which is virtually ice free. Credit: ESA
[/caption]
Envisat satellite observations from mid-August show that a new record of low polar sea-ice coverage in the Arctic could be reached in sometime in September. This follows last summer’s record minimum ice cover in the same area. Current ice coverage in the Arctic has already reached the second absolute minimum since observations from space began 30 years ago. Because the extent of ice cover is usually at its lowest about mid-September, this year’s minimum could still fall to set another record low.
The direct route through the Northwest Passage – highlighted in the image above by an orange line – is currently almost free of ice, while the indirect route, called the Amundsen Northwest Passage, has been passable for almost a month. This is the second year in a row that the most direct route through the Northwest Passage has opened up.
Each year, the Arctic Ocean experiences the formation and then melting of vast amounts of ice that floats on the sea surface. An area of ice the size of Europe melts away every summer reaching a minimum in September. Since satellites began surveying the Arctic in 1978, there has been a regular decrease in the area covered by ice in summer – with ice cover shrinking to its lowest level on record and opening up the most direct route through the Northwest Passage in September 2007.
“The polar regions, especially the Arctic, are very sensitive indicators of climate change,” said Prof. Heinrich Miller from the Alfred Wegener Institute (AWI) in Bremerhaven, Germany. “The UN’s Intergovernmental Panel on Climate Change has shown that these regions are highly vulnerable to rising temperatures and predicted that the Arctic would be virtually ice-free in the summer months by 2070. Other scientists claim it could become ice-free as early as 2040. Latest satellite observations suggest that the Arctic could be mainly ice-free even earlier.”