Comet C/2005 L3 McNaught Brighter Than Expected

C/2005 L3 McNaught - Joe Brimacombe

According to the estimations made by the IAU (International Astronomical Union) and ICQ (International Comet Quarterly) information, Comet C/2005 L3 McNaught wasn’t supposed to be any brighter than magnitude 15 this month and in a slow decline in brightness. However, thanks to observations done by Joseph Brimacombe at Macedon Ranges Observatory, the “tale of the tape” shows a different story…

Currently located in Hercules (RA 16 16.65 Dec +20 12.8), recent observation estimates of around magnitude 13 have been confirmed thanks to Mr. Brimacombe’s photographic artistry. The ICQ reports have shown Comet C/2005 L3 McNaught slowly brightening since mid-March. Discovered on June 3, 2005 by R. H. McNaught of Siding Spring, the then 17.7 magnitude comet has slowly climbed the brightness ladder over the last 3 years. Reaching perihelion this year on January 16, L3 McNaught has surprised many astronomers – including observers.

Click On Image for Comet Movie – Courtesy of Macedon Ranges Observatory

Says Brimacombe – who was remotely controlling the telescope from his location in Abu Dhabi: “I took a few shots for fun and was surprised at how bright it was compared with barely visible Comet 110P Hartley (mag. 15.5). McNaught was supposed to be mag 15 and it’s easy to see the tail.”

Will Comet C/2005 L3 McNaught brighten as dramatically as Comet Holmes did? Chances are slim, but comets are mysterious creatures that seldom do what we expect them to. According to all the reports, L3 McNaught has great high surface brightness properties right now which will make it easier than most faint comets to spot with backyard equipment. Who knows what tomorrow might bring?

AVI and Still Photo Information:

  • Photographer: Joe Brimacombe – Macedon Ranges Observatory
  • Taken with 20″ RCOS and STL1001E
  • UT 0453 to 0615 14 May
  • 2 min sub exposures, some gaps from cloud
  • Video covers 80 min
  • Stacked image has undergone digital development to bring out tail.

Satellite Views of Deadly Cyclone in Myanmar

The cyclone that ravaged the southeast Asian country of Myanmar over the weekend was an incredibly deadly and destructive storm. News reports say at least 10,000 people were killed, and thousands more were missing as of May 5. Cyclone Nargis made landfall with sustained winds of 130 mph and gusts of 150-160 mph, which is the equivalent of a strong Category 3 or minimal Category 4 hurricane. This was the first cyclone of the 2008 season. Above is an image from NASA’s Terra satellite, and specifically the Moderate Resolution Imaging Spectroradiometer (MODIS.) You can see this storm was a whopper, however, by the time MODIS acquired this image on May 3 at 10:55 am local time the cyclone had lost much of its original strength and was at tropical storm strength. Even more astounding are the images available from MODIS of the landscape of Myanmar both before and after the cyclone hit.


The top image was taken on April 15, 2008, well before the storm and shows a calm landscape where rivers and lakes are visible, as well as the green of vegetation. In the lower image, taken on May 5, the entire coastal plain is flooded. News reports say the agricultural areas have been especially hard hit. But cities as well were affected. For example, Rangôn, with a population over 4 million is almost completely surrounded by floods. Several other large cities with populations of 100,000–500,000 are also in the area affected by the cyclone.

The MODIS Rapid Response Team has been processing the images as soon as they are available from the spacecraft in order to provide information about the storm and the region.

The blue dot on the globe below marks the Andaman Sea and the area affected by Cyclone Nargis.

Original News Source: NASA’s Earth Observatory

Explore Earth’s Ionosphere with Google Earth

Computer generated image of the density of electrons in the ionosphere (Cathryn Mitchell, University of Bath)

The ionosphere is the final layer of atmosphere before space. This highly dynamic region is constantly exposed to the full intensity of the Sun, harsh ultraviolet radiation breaking down molecules and atoms. Highly charged ions and free electrons therefore fill the ionospheric layers. Critical to terrestrial communications, the ionosphere also plays host to the largest lightshow on Earth, the Aurora. Now NASA-funded research has developed a live “4D Ionosphere” plugin for Google Earth. Now you can fly through the atmosphere’s uppermost reaches without even leaving your desk…

The ionosphere is highly important to us. Radio operators will be acutely aware about how the ionosphere influences radio wave propagation. Ever since Guglielmo Marconi’s experiments with trans-Atlantic radio communications in 1901 between England and the US, the ionosphere has influenced our ability to communicate over large distances, and without the aid of modern satellite technology. The ionosphere creates a charged, reflective barrier that radio waves can be bounced off (bypassing the blocking effect of the curvature of the Earth). However, radio signals are highly influenced by variations in the ionosphere and can be “blacked out” should a major solar storm pump charged particles into the magnetosphere and ionosphere. Even modern Global Positioning Satellite (GPS) signals are influenced by this atmospheric layer, reflecting and attenuating radio waves. As aircraft, ships and other modes of transport now depend on GPS positioning, it is essential that we fully comprehend the physics behind the ionosphere.

A screenshot of Google Earth, with ionosphere overlaid (Google)

In the aim to have a better grasp of the state of the ionosphere, a “live” plugin for Google Earth has just been announced. Funded by NASA’s Living With a Star (LWS) program, it is hoped that this tool can be used by the public and professionals alike to see the current state of the electron content of the ionosphere. Once downloaded and running, the viewer can rotate the globe and see where electron density is high and where it is low. In dense regions, it is very hard for radio waves to propagate, signifying that radio quality will be poor, or blocked all together. In Google Earth, these regions are highlighted in red. The blue regions show “normal” radio propagation regions, expect good quality signal in those locations.

The reason why this new system has been dubbed “4D Ionosphere” is that you can view the ionosphere in three spatial dimensions, and the data is refreshed every ten minutes to give the extra time dimension.

This isn’t the first time Google Earth has been used by organizations for space-based research. On February 24th, I reported that a plugin had been released to track the space debris currently orbiting our planet. Nancy also gave the new Google Sky a test drive in March, a great way to learn about astronomy through this user friendly interface.

I can see lots of applications for this tool already. Firstly I’d be very excited to compare the ionosphere during periods of high solar activity with periods when the Sun experiences solar minimum (like now). This would be especially exciting in Polar Regions in the auroral zone when high quantities of solar wind particles ignite aurorae. Also, there are possible applications for amateur radio (ham) operators who could use this as a means to forecast the strength of the radio signal during campaigns. I am however uncertain how accurate or how detailed these measurements will be, but it at least gives a very interesting look into the current state of this interesting region of the atmosphere.

Source: NASA

The Earth’s Cities at Night

You only have to walk outside at night, look up and not see the Milky Way to know that light pollution is a problem. And seen from space at night, the Earth’s surface glows with the light of millions of homes, buildings, cars and streetlights. Seen at night, our impact on the Earth is immediate and obvious.

A few years ago, NASA and NOAA compiled a complete world map of the nighttime Earth, using 9 months of data collected by satellites. This “Night Lights” image is pretty famous, and widely circulated around the Internet.

There’s a great article at NASA’s Earth Observatory that describes how they capture these night images of the Earth’s surface. You can also see many of the best images taken so far.

Click here to read the article.

Arctic’s Oldest and Thickest Ice is Melting Away

It’s been a strange year for the Arctic. During the summer, high temperatures melted away vast regions of the Arctic sea ice, opening up the Northwest Passage for the first time. But then this winter has been unusually cold, bringing back large large areas of sea ice. So what’s going on? Is the Arctic recovering, or is Global Warming marching on?

The big problem studying global warming is that the temperatures and local climate can fluctuate. Over the short term, in some regions, you can have unseasonably warm or cold temperatures. Here in Vancouver, we had one of the coldest, snowiest winters I’ve ever seen.

NASA scientists are measuring the long term trends for the ancient perennial sea ice that lasts across several seasons. And this ice seems to be melting away over the years. In the past, this perennial sea ice – anything that lasted more than a single year – covered 50-60% of the Arctic. This analysis was made by NASA’s ICESat satellite, which measures sea ice thickness with microwaves.

This year, the perennial sea ice covered only 30% of the Arctic. And the most ancient ice, that which has survived more than 6 years, used to comprise 20% of the Arctic. Now it’s down to just 6%.

As this year shows, Arctic sea ice doesn’t stand still. Its coverage grows and declines seasonally, reaching the maximum in March, and the minimum in September. And this year, the maximum is up 3.9% over the previous 3 years. At the same time, the perennial sea ice coverage is down to an all-time minimum.

As the perennial sea ice thins, it’s more vulnerable during the summer melt period to wind and waves. Large chunks of ice can be carried out of the Arctic to melt in warmer waters.

Don’t worry about water levels rising as the sea ice coverage disappears. This ice is already in the water, displacing the same amount. So as it melts, sea levels should stay right where they are. That’s different from the ice locked up in the world’s glaciers, Greenland, and the Antarctic ice cap. As those melt, sea levels will rise.

To better understand the Arctic ice coverage, NASA is planning to launch a follow-on mission called ICESat II, due for launch in 2015.

Original Source: NASA News Release

Origins of the Earth’s Atmospheric “Hiss” Energizing Van Allen Belt Particles Revealed

birkeland-anode-globe-fig2591.thumbnail.jpg

Scientists working at the University of California, Los Angeles (UCLA) have identified the origin behind the upper atmospheric “hiss” that energizes the high-energy particles bouncing around inside Earth’s radioactive Van Allen Belts. This is significant, as this has been a very long wait for answers to the origin of this low-frequency radio wave emission… after 40 years of looking, we may now have an answer…

The Van Allen Belts surrounding Earth can be a terrifying place for spacecraft and astronauts. Occupying a volume 200 km above the surface and can extend as far as seven Earth radii (over 44,000 km). These volumes of highly energetic particles are trapped by the Earth’s magnetosphere, bouncing electrons and protons back and forth in their magnetic prison. The Van Allen Belts are variable and closely related to solar activity. As the solar wind hits the Earth’s magnetosphere, solar wind particles will fall into the polar cusp regions, entering the atmosphere and creating aurorae in Northern and Southern Polar regions (Aurora Borealis and Aurora Australis respectively). However, some particles are fed into the magnetosphere and become trapped between the onion skin-like layers of magnetic field lines and cannot escape.
The Van Allen Belts surrounding Earth (source: astronomycafe.net)
This is how the Van Allen Belts are supplied, and the population of protons and electrons are expected to increase and become more energetic during solar storms. Although we know a lot about these regions, very little is known how the trapped electrons and protons are energized so much that they can penetrate lead up to 1 mm deep. This has obvious design implications for the thousands of satellites orbiting the Earth, and poses a serious health risk to astronauts spending long periods in space.

In new research published in Nature today, the UCLA research group believe they have found the origin of upper atmospheric “hiss”. The hiss has radio wave frequencies and has been observed since early missions into space in the 1960s. Thought to originate from magnetic interactions in the magnetosphere itself, or even from intense lightning storm emissions into the upper atmosphere, definitive proof for the source of this strange phenomenon was proving very elusive. Putting classical ideas to one side, Jacob Bortnik’s work focuses on a totally different form of electromagnetic wave called “chorus”. This wave was thought to have no connection with radio hiss, but Bortnik proves that chorus waves, travelling many thousands of kilometres, can evolve into the hiss which characterizes the Van Allen Belts.

Here, we show that a different wave type, called chorus, can propagate into the plasmasphere from tens of thousands of kilometers away and evolve into hiss. Our new model naturally accounts for the observed frequency band of hiss, its incoherent nature, its day-night asymmetry in intensity, its association with solar activity and its spatial distribution. The connection between chorus and hiss is very interesting because chorus is instrumental in the formation of high-energy electrons outside the plasmasphere, while hiss depletes these electrons at lower equatorial altitudes.” – Jacob Bortnik.

The UCLA group were actually not researching the atmospheric hiss, but were working on chorus waves – that typically propagate outside the plasmasphere – and realized they could evolve into the “hiss” responsible for particle energization in the Van Allen Belts.

This research has massive consequences for the prediction of space weather. The conditions of the space between the Sun and Earth is very important when predicting the onset of a solar storm, but the reaction of the Earth’s upper atmosphere is critical when understanding how potentially damaging particles are energized to such a large extent.

Source: Physorg.com

Extreme Observations of the Aurora in a Land of Polar Bears and Frostbite – Images of Research in the Freezer

Solar-terrestrial physics observations are about to get even more exciting. The University Centre on Svalbard (UNIS) has completed the construction of a brand new observatory, The Kjell Henriksen Observatory (KHO), providing researchers with a shiny-new ringside seat to observe a dazzling atmospheric phenomena, the Aurora Borealis (a.k.a. the Northern Lights). It is probably one of the most extreme places on the planet, with temperatures dropping below minus 35 degree Celsius (-31F) and where humans are no longer at the top of the food chain, working on Svalbard can be challenging, but very rewarding. Witnessing the aurora erupt overhead is an awe inspiring sight, to observe and research this reaction between the solar wind and upper atmosphere is a chance in a lifetime. What’s more… I’ve been there…


Svalbard is a strange but magical place. Found high in the Arctic Circle, half-way between Norway and the North Pole, the archipelago attracts international attention for its untouched landscape and unique location. Famed as the magical destination for a series of novels (Philip Pullman’s “His Dark Materials” trilogy) and a blockbuster movie (“The Golden Compass“), the main island of Spitsbergen plays host to some of the most dramatic scenery on Earth. The panserbjørne may not be armour-plated, but there are bears nonetheless, insuring humans take special precautions.
At the town limit of Longyearbyen, rifle loading time (credit: Ian O'Neill)
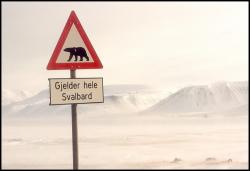
Although life can be tough up there – temperatures plummeting lower than minus 35 degrees Celsius; over four months of Arctic night; the constant need to carry a rifle when travelling beyond settlement limits – people live very comfortably, mainly working in coal mine towns, for the local tourism industry or studying biology, physics or technology in the worlds most northerly university called “UNIS”.

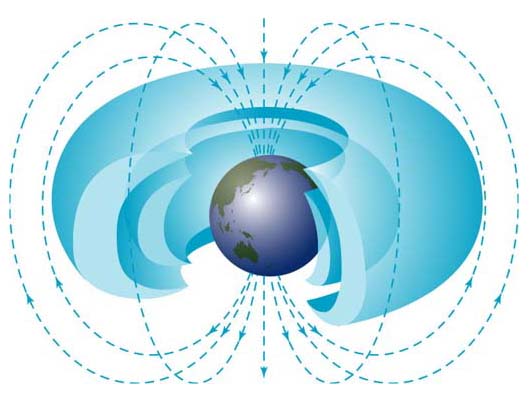
I had the amazing fortune to live there for five months, in the spring of 2002, as part of an exchange program between the University of Wales, Aberystwyth (UK) and the University of Tromsø (Norway). A group of five of us British guys set off to the Arctic to study the physics behind the Earth’s magnetosphere, the solar wind and the aurora.
The town of Longyearbyen.
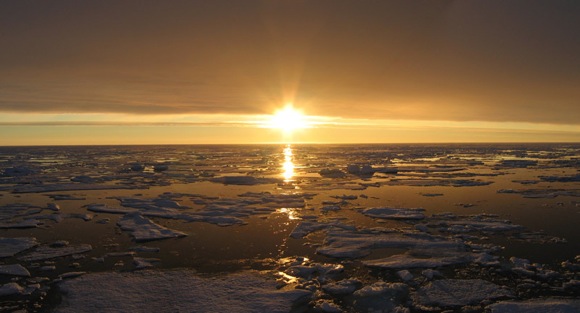
Nothing can really prepare you for a trip to this extraordinary place. Trying to study in 24 hour Arctic night is hard (dragging yourself out of bed is a mission in itself!), but it makes for magnificent viewing of the Aurora Borealis on an inky-black backdrop of the night sky. Actually, it was the 24 hour day light that affected me the most. As the Sun slowly crept above the frozen horizon during March 2002, the darkness was sadly lost and the Northern Lights were never to be seen again.

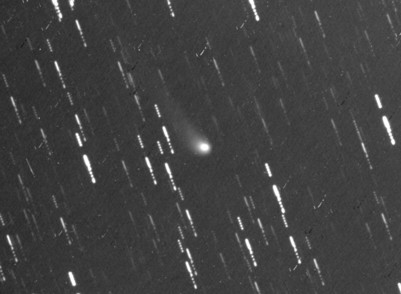
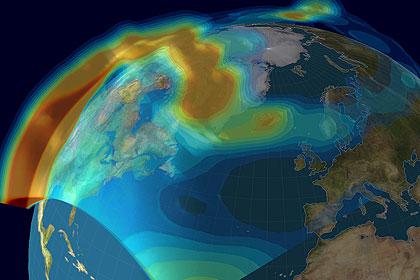
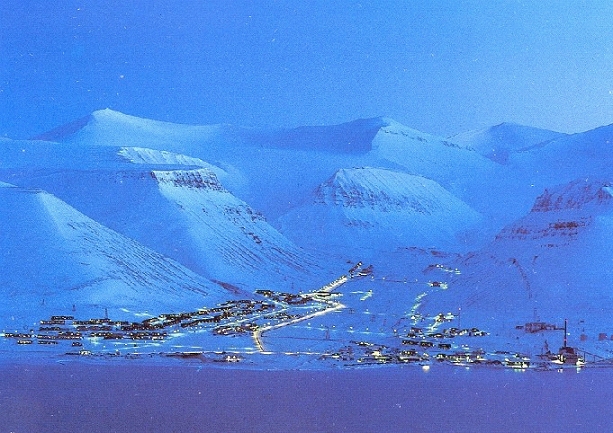
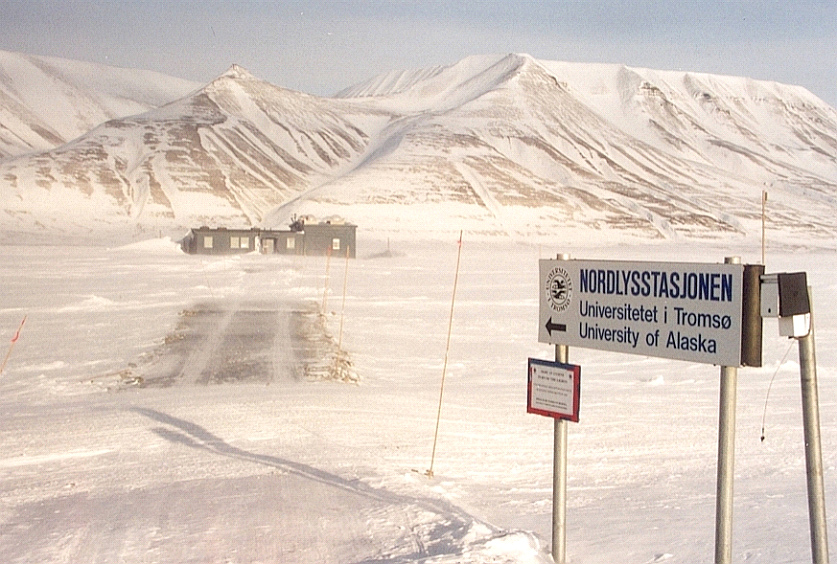
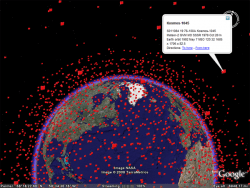
I remember one night in particular, probably early February 2002. As part of our study for the “Upper Polar Atmosphere” course, we had to carry out some actual space research. The task was to track the effects of a Coronal Mass Ejection (CME) as it travelled from the Sun and impacted the Earth’s atmosphere. A seemingly massive task, but an exciting one – after all we were sitting below the lightshow very few people were able to experience, and we’d been set the goal of explaining how this amazing phenomenon actually works! That freezing February night, we had all been driven to the “Auroral Station” situated just outside Longyearbyen, the capital city (I say “city”, but only 2000 people live there) of Svalbard.
The old Auroral Station (credit: Ian O'Neill)
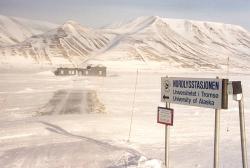
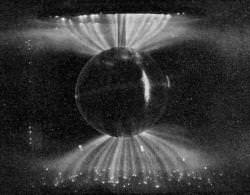
Resembling part-laboratory/part-shed, the Auroral Station (known as “Nordylysstatsjonen”) was a strange fixture to see standing in the snow. On entering we were faced with an observatory crammed with computers and cameras. This was the home of the “All Sky Camera” (ASC), a basic wide-angled camera looking up into the sky. On active nights, the ASC could take in a 360° view, from horizon to zenith, watching the auroral lightshow erupt overhead, watching the effects of solar particles impact the Earths upper atmosphere, and emitting light.

Stills from the ASC, from left to right, as an aurora develops (credit: Gareth Thomas/Ian O'Neill)

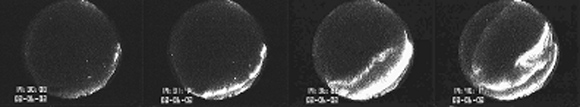
Unfortunately, the aurora didn’t show after several hours of waiting, looking through the bubble-shaped windows in the roof of the station.

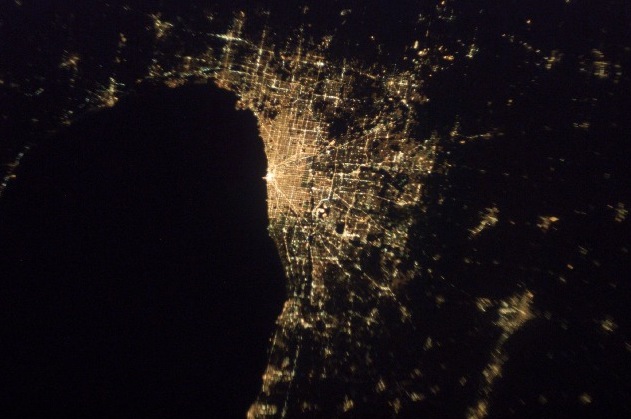
In those long moments of waiting, it was very obvious that the days of observing the night sky in this little observation post were numbered. To the south-eastern skies, a creeping glow of street lights were of constant annoyance to the station scientists – even a town as tiny as Longyearbyen was putting out enough light pollution to interfere with the sensitive instruments. The outlook wasn’t good, the town was expanding and the pollution could only get worse.

Kjell Henriksen Observatory
The answer to this problem was obvious back then… the station would have to be moved, away from the excess light pollution. Exactly six years later, the solution has been realized.
The new Kjell Henriksen Observatory opened in February 2008 (Credit: Olli Jokiaho/UNIS)
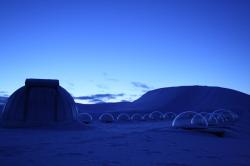
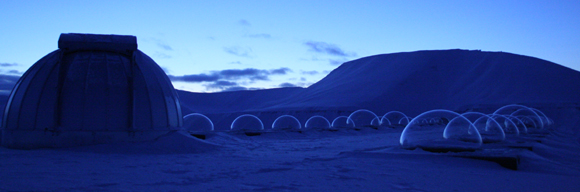
On February 20th, 2008, the new state of the art observatory was completed. Situated 6 km (3.7 miles) up the fjord from the original location, the Kjell Henriksen Observatory is now proudly positioned 500 meters up a mountain overlooking a long valley called Adventdalen.

The new observatory was opened by Norway’s Minister for Research and Higher Education, Tora Aasland, announcing:

The International Polar Year 2007-2008 is a huge international research effort of great importance to the northern region, as well as to global challenges. When the new observatory was planned, the goal was to have it ready for the Polar Year. I am very pleased that this goal was reached” – Tora Aasland

The new installation houses an impressive suite of instruments. In all over 15 optical and non-optical instruments are based here, operated by a range of international collaborators, observing mid- to upper-atmospheric phenomena. Even some of the most advanced all-sky cameras are now up and running during this “auroral season”.

Although the Northern Lights did not put on a show for the grand opening, and snow drizzled on the event, I hope the new observatory will be as successful as its predecessor and help to entice many more students (like myself, six years ago) into a research career focused on the Sun and its intrinsic relationship with the Earth.

For full details on the opening of the Kjell Henriksen Observatory, visit the UNIS news pages.

Source: UNIS, The Kjell Henriksen Observatory

Space Debris May be Catastrophic to Future Missions (and Google Earth is Watching…)

googlejunk2.thumbnail.png

Kessler Syndrome could be a frightening situation for space travel. No, it’s not a health risk to the human body in zero-G and it’s not a psychological disorder for astronauts spending too much time from home. Kessler Syndrome is the point at which space travel becomes impossible without hitting into a piece of space junk, jeopardizing missions and risking lives. In extreme predictions, space debris from our constant littering of low Earth orbit, collisions between bits of rubbish may become more and more frequent, causing a catastrophic cascade of debris multiplying exponentially, falling through the atmosphere and making space impassable.

In the meanwhile, space mission controllers must be acutely aware that there could be an odd bolt or piece of old satellite flying toward their spaceship at velocities faster than the fastest rifle shot. Spare a thought for the space debris trackers as they try to keep a record of the 9,000+ pieces of junk currently orbiting our planet… but wait a minute, Google Earth can give us a ringside seat!

Strict international civil aviation-style laws may need to be imposed on the worlds space agencies if future generations of the human race are going to make it in space. This stark warning comes from Tommaso Sgobba, Director of the International Association for the Advancement of Space Safety, who will be presenting his case to the United Nations in April. Sgobba’s main argument comes from the danger associated with the escalating accumulation of space debris in Earth orbit, should these high speed bits of junk hit a spaceship, satellite or an astronaut, death and disaster may ensue. It may get worse than this, possibly paralysing the Earth from having access to space at all.

Failure to act now to regulate space to protect property and human life would be pure folly.” – Tommaso Sgobba.

Other scientists agree with Sgobba, recommending that future missions in to space abide by some strict codes of practice (possibly more strict than those imposed on international civil aviation) to drastically cut the rate of orbital littering by the 20 countries currently able to send stuff into space.

Even the most tightly controlled missions, such as the International Space Station, are expected to shed bits and pieces over the course of their lifetimes. Space junk comes in all shapes and sizes and can be anything from a small screw to entire dead satellites. Recorded examples of space junk include an old glove lost by Ed White during the first ever US space walk in 1965 (during the Gemini-4 mission), a camera that Michael Collins let slip in space in 1966 (during the Gemini-8 mission) and a pair of pliers that International Space Station astronaut Scott Parazynski dropped during an EVA last year.

Some space debris near misses include:

  • Space Shuttle dodge: Space Shuttle Atlantis had to avoid collision with a piece of a Russian satellite by carrying out a seven second burn of its engines in 1991.
  • Aircraft scare: Bits of an Russian ex-spy satellite fell through the atmosphere coming very close to a Latin American Airbus, carrying 270 passengers in 2006.
  • Personal injury: fortunately there is only one documented account of someone being hit by a piece of debris on the ground. In 1997 a woman from Oklahoma was hit on the shoulder by a piece of a fuel tank from a Delta II rocket. She was unhurt and lived to tell the tail.

It is hoped that tighter controls on the rockets, satellites and spacecraft will slow the rate of junk increase, but the problem is already pretty worrying for long-term missions in orbit around the Earth. The two critical regions filling with debris are in low Earth and geosynchronous orbits, a few hundred and 22,300 miles high respectively. Low Earth orbit will cause problems for spacecraft to actually leave the atmosphere and geosynchronous orbit may hinder future communication satellite insertions.

To safeguard our access into space, and avoid an increase in debris-related incidents, action will need to be taken.

Google Earth-watch
Two screenshots. Looking up toward the constellation of Leo. One screen with and one without the positions of space debris.
During the research on this article, I came across some work being funded by Ministry of Culture of the Republic of Slovenia, Municipality of Ljubljana, where researchers are making debris location data available to the public via a plugin for the Google Earth application. According to the groups blog, the data is taken from a U.S. government-owned space observatory so known space debris (or as the blog calls it “pollution”, which it really is) can be tracked.

On experimenting with the new space debris folder, it really did strike home as to what a problem space junk is becoming. For starters, there is an impossibly thick near-Earth layer and a distinct ring representing the geosynchronous debris. Plus, each item can be selected and information on the individual bits of debris can be found out… see the screenshots to find out what I mean…
3D view of junk in low Earth orbit.

Get the space junk plugin for Google Earth (read Google Earth documentation to learn how to use this plugin).

News Source: Guardian.co.uk

Magnetic “Ropes” Connect the Northern Lights to the Solar Wind

moussette_aur16jul1_c1.thumbnail.jpg

This discovery comes just in time to light up Christmas: new observations of the Northern Lights – a spectacular phenomenon that lights up the night sky – show them to be more intricate than previously thought.

The Northern Lights were observed by NASA’s Time History of Events and Macroscale Interactions during Substorms (THEMIS), a system of ground cameras and five orbiting micro-satellites that work in combination to observe the phenomenon better than with a single satellite. This allowed scientists to map and understand the mechanisms of the Northern Lights better than before by giving them a 3D picture of the events.

The Northern Lights or “Aurora Borealis” occur when charged particles coming from the Sun interact with the Earth’s magnetic field. THEMIS found evidence that there are magnetic “ropes” — long, wound magnetic field lines that resemble the braids of a rope – connecting the Earth’s magnetic field with the solar wind. Particles are channeled through these ropes, which last a short time, and are focused in certain regions, boosting the energy of the Aurora Borealis.

“THEMIS encountered its first magnetic rope on May 20,” said David Sibeck, project scientist for the mission at NASA’s Goddard Space Flight Center in Greenbelt, MD. “It was very large, about as wide as Earth, and located approximately 40,000 miles (70,000 km) above Earth’s surface in a region called the magnetopause.”

The magnetopause is where the Earth’s magnetic field meets the solar wind.

Electromagnetic explosions were also observed by THEMIS at the bow shock of the Earth’s magnetic field. The bow shock is where the magnetosphere bunches up as the Earth travels through space, kind of like how the waves in the front of a boat moving through the water are closer together than those behind the boat.

Sibeck said of the explosions,”It is where the solar wind first feels the effects of Earth’s magnetic field. Sometimes a burst of electrical current within the solar wind will hit the bow shock and – Bang! We get an explosion.”

The results were presented at the meeting of the American Geophysical Union in San Francisco this month. THEMIS will continue to observe the Aurora Borealis over the next two years, taking measurements of ions, electrons and electromagnetic radiation in space. Scientists from the US, Canada, Western Europe, Russia and Japan are contributing to the study of Earth’s own Christmas lights.

Original Source: NASA Press Release

Scientists Compile a Detailed Map of Antarctica

2007-1127antarctica.thumbnail.jpg

Satellites have revolutionized climate science and geology. The better your instruments, the better you can track what’s actually going on around the world. This week US and British science agencies unveiled the output of some of these instruments: a detailed map of Antarctica.

The new map of Antarctica is a mosaic of images captured by NASA satellites over years of observations. Scientists from the National Science Foundation, the U.S. Geological Survey and NASA worked with the British Antarctic Survey to hand-select the best individual images. The completed mosaic offers a cloudless view of the frozen continent’s surface at a resolution 10 times better than anything seen before.

The full mosaic contains more than 1,100 separate images stitched together from three years of Landsat observations. NASA has made the full images and data available to the public from a free web portal, and has 8 different versions of the full mosaic available for download. The homepage has a cool way to drag the map around, like Google Maps (although, I couldn’t get it to work).

The researchers are hoping this will give scientists a detailed snapshot of the current state of Antarctica, including its various ice sheets which contain 60% of the Earth’s fresh water.

Original Source: NSF News Release