
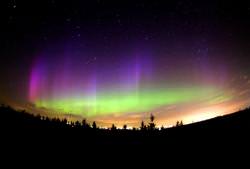
This discovery comes just in time to light up Christmas: new observations of the Northern Lights – a spectacular phenomenon that lights up the night sky – show them to be more intricate than previously thought.
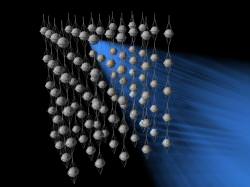
The Northern Lights were observed by NASA’s Time History of Events and Macroscale Interactions during Substorms (THEMIS), a system of ground cameras and five orbiting micro-satellites that work in combination to observe the phenomenon better than with a single satellite. This allowed scientists to map and understand the mechanisms of the Northern Lights better than before by giving them a 3D picture of the events.
The Northern Lights or “Aurora Borealis” occur when charged particles coming from the Sun interact with the Earth’s magnetic field. THEMIS found evidence that there are magnetic “ropes” — long, wound magnetic field lines that resemble the braids of a rope – connecting the Earth’s magnetic field with the solar wind. Particles are channeled through these ropes, which last a short time, and are focused in certain regions, boosting the energy of the Aurora Borealis.
“THEMIS encountered its first magnetic rope on May 20,” said David Sibeck, project scientist for the mission at NASA’s Goddard Space Flight Center in Greenbelt, MD. “It was very large, about as wide as Earth, and located approximately 40,000 miles (70,000 km) above Earth’s surface in a region called the magnetopause.”
The magnetopause is where the Earth’s magnetic field meets the solar wind.
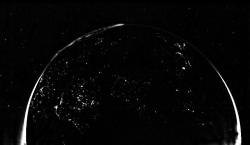
Electromagnetic explosions were also observed by THEMIS at the bow shock of the Earth’s magnetic field. The bow shock is where the magnetosphere bunches up as the Earth travels through space, kind of like how the waves in the front of a boat moving through the water are closer together than those behind the boat.
Sibeck said of the explosions,”It is where the solar wind first feels the effects of Earth’s magnetic field. Sometimes a burst of electrical current within the solar wind will hit the bow shock and – Bang! We get an explosion.”
The results were presented at the meeting of the American Geophysical Union in San Francisco this month. THEMIS will continue to observe the Aurora Borealis over the next two years, taking measurements of ions, electrons and electromagnetic radiation in space. Scientists from the US, Canada, Western Europe, Russia and Japan are contributing to the study of Earth’s own Christmas lights.
Original Source: NASA Press Release