
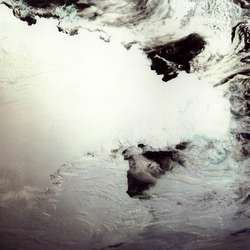
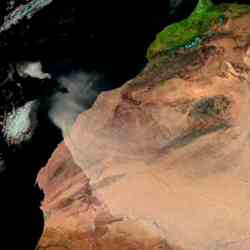
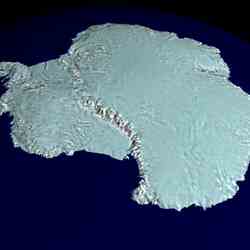
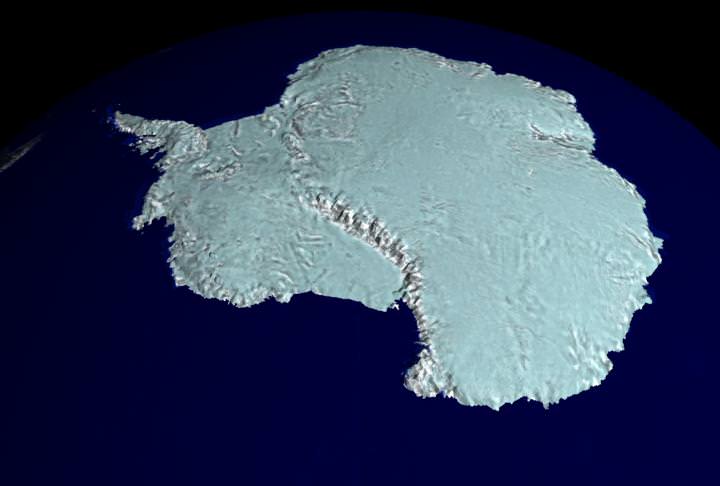
Image of Antarctica captured by Galileo. Image credit: NASA. Click to enlarge
The asteroid impact that killed the dinosaurs 65 million years ago was big, but geologists have found a new asteroid crater that’s even bigger: in Antarctica. This 482 km (300 mile) crater was discovered using NASA’s GRACE satellites, which can detect the gravity fluctuations beneath Antarctica’s ice sheets. This meteor was probably 48 km (30 miles) across and might have struck 250 million years ago – the time of the Permian-Triassic extinction, when almost all the animals on Earth died out.
Planetary scientists have found evidence of a meteor impact much larger and earlier than the one that killed the dinosaurs — an impact that they believe caused the biggest mass extinction in Earth’s history.
The 300-mile-wide crater lies hidden more than a mile beneath the East Antarctic Ice Sheet. And the gravity measurements that reveal its existence suggest that it could date back about 250 million years — the time of the Permian-Triassic extinction, when almost all animal life on Earth died out.
Its size and location — in the Wilkes Land region of East Antarctica, south of Australia — also suggest that it could have begun the breakup of the Gondwana supercontinent by creating the tectonic rift that pushed Australia northward.
Scientists believe that the Permian-Triassic extinction paved the way for the dinosaurs to rise to prominence. The Wilkes Land crater is more than twice the size of the Chicxulub crater in the Yucatan peninsula, which marks the impact that may have ultimately killed the dinosaurs 65 million years ago. The Chicxulub meteor is thought to have been 6 miles wide, while the Wilkes Land meteor could have been up to 30 miles wide — four or five times wider.
“This Wilkes Land impact is much bigger than the impact that killed the dinosaurs, and probably would have caused catastrophic damage at the time,” said Ralph von Frese, a professor of geological sciences at Ohio State University.
He and Laramie Potts, a postdoctoral researcher in geological sciences, led the team that discovered the crater. They collaborated with other Ohio State and NASA scientists, as well as international partners from Russia and Korea. They reported their preliminary results in a recent poster session at the American Geophysical Union Joint Assembly meeting in Baltimore.
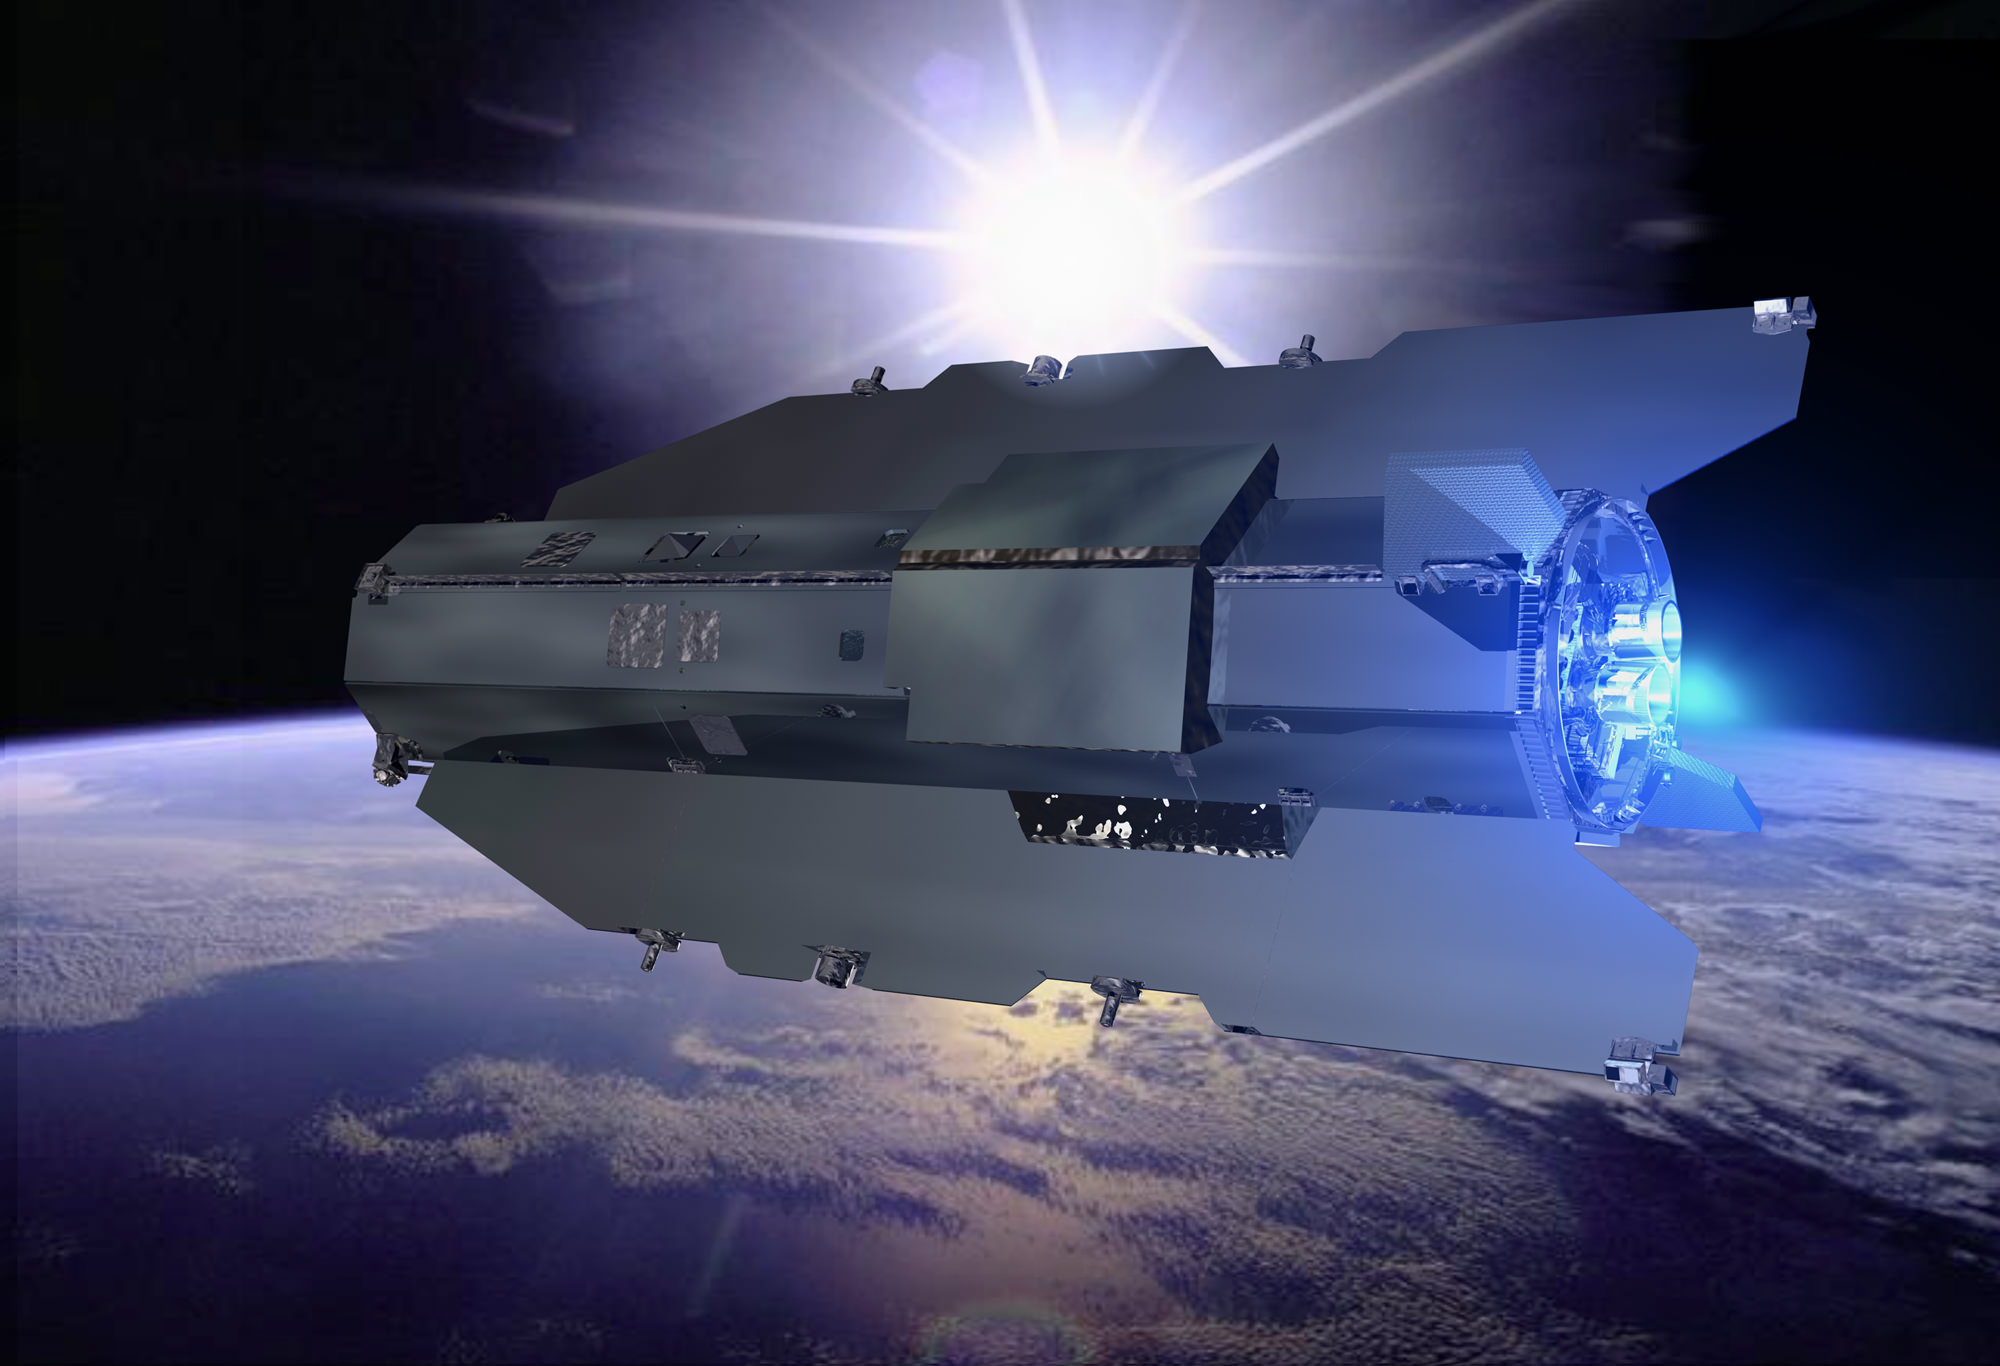
The scientists used gravity fluctuations measured by NASA’s GRACE satellites to peer beneath Antarctica’s icy surface, and found a 200-mile-wide plug of mantle material — a mass concentration, or “mascon” in geological parlance — that had risen up into the Earth’s crust.
Mascons are the planetary equivalent of a bump on the head. They form where large objects slam into a planet’s surface. Upon impact, the denser mantle layer bounces up into the overlying crust, which holds it in place beneath the crater.
When the scientists overlaid their gravity image with airborne radar images of the ground beneath the ice, they found the mascon perfectly centered inside a circular ridge some 300 miles wide — a crater easily large enough to hold the state of Ohio.
Taken alone, the ridge structure wouldn’t prove anything. But to von Frese, the addition of the mascon means “impact.” Years of studying similar impacts on the moon have honed his ability to find them.
“If I saw this same mascon signal on the moon, I’d expect to see a crater around it,” he said. “And when we looked at the ice-probing airborne radar, there it was.”
“There are at least 20 impact craters this size or larger on the moon, so it is not surprising to find one here,” he continued. “The active geology of the Earth likely scrubbed its surface clean of many more.”
He and Potts admitted that such signals are open to interpretation. Even with radar and gravity measurements, scientists are only just beginning to understand what’s happening inside the planet. Still, von Frese said that the circumstances of the radar and mascon signals support their interpretation.
“We compared two completely different data sets taken under different conditions, and they matched up,” he said.
To estimate when the impact took place, the scientists took a clue from the fact that the mascon is still visible.
“On the moon, you can look at craters, and the mascons are still there,” von Frese said. “But on Earth, it’s unusual to find mascons, because the planet is geologically active. The interior eventually recovers and the mascon goes away.” He cited the very large and much older Vredefort crater in South Africa that must have once had a mascon, but no evidence of it can be seen now.
“Based on what we know about the geologic history of the region, this Wilkes Land mascon formed recently by geologic standards — probably about 250 million years ago,” he said. “In another half a billion years, the Wilkes Land mascon will probably disappear, too.”
Approximately 100 million years ago, Australia split from the ancient Gondwana supercontinent and began drifting north, pushed away by the expansion of a rift valley into the eastern Indian Ocean. The rift cuts directly through the crater, so the impact may have helped the rift to form, von Frese said.
But the more immediate effects of the impact would have devastated life on Earth.
“All the environmental changes that would have resulted from the impact would have created a highly caustic environment that was really hard to endure. So it makes sense that a lot of life went extinct at that time,” he said.
He and Potts would like to go to Antarctica to confirm the finding. The best evidence would come from the rocks within the crater. Since the cost of drilling through more than a mile of ice to reach these rocks directly is prohibitive, they want to hunt for them at the base of the ice along the coast where the ice streams are pushing scoured rock into the sea. Airborne gravity and magnetic surveys would also be very useful for testing their interpretation of the satellite data, they said.
NSF and NASA funded this work. Collaborators included Stuart Wells and Orlando Hernandez, graduate students in geological sciences at Ohio State; Luis Gaya-Piqu??bf? and Hyung Rae Kim, both of NASA’s Goddard Space Flight Center; Alexander Golynsky of the All-Russia Research Institute for Geology and Mineral Resources of the World Ocean; and Jeong Woo Kim and Jong Sun Hwang, both of Sejong University in Korea.
Original Source: Ohio State University