Earthquake Should Show a Gravity Scar

Image credit: ESA
A new ESA study predicts that the devastating Sumatran earthquake, which resulted in the tragic tsunami of 26 December 2004, will have left a ?scar? on Earth?s gravity that could be detected by a sensitive new satellite, due for launch next year.

The Sumatran earthquake measured 9 on the Richter scale and caused widespread devastation and death when it struck unexpectedly late last year. Thankfully, earthquakes of this magnitude are rare events, taking place perhaps once every two decades.

Seismological data suggests that, during the event, the seafloor on either side of a fault line running for 1000 km along the bottom of the Indian Ocean dramatically changed height, producing a ledge, 6 metres high. Such a large-scale movement will change the gravitational field of the Earth. Roberto Sabadini and Giorgio Dalla Via, University of Milan, and colleagues have calculated this change. They found that the Earth?s gravity altered, in an instant, by as much as is expected from six years’ worth of melting at the Patagonian Ice Fields in southernmost South America.

It may seem surprising that Earth?s gravity is not equally strong at all points of the globe. Instead, it varies by a small fraction due to the presence of such things as mountains or deep ocean trenches. The tides and ocean circulation patterns also affect the gravity, as does the rotation of the Earth itself, which bulges out the planet?s equator and makes its diameter 21 kilometres wider than the pole-to-pole distance.

In order to measure the deviations from the average level of gravity, Earth scientists invented the concept of the geoid. This is a bit like a hi-tech version of ?sea level?, which is often used to give an absolute height measure. Today?s modern measurements need something more accurate, however.

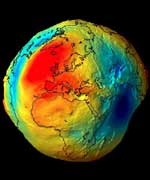
The geoid is a hypothetical surface, on which the gravitational pull of the Earth is the same everywhere. It wraps itself around the Earth, moving away from the real surface when it is over areas of greater density and therefore stronger gravity. Over less dense regions, the geoid moves closer to the real surface.

When material is moved around, either instantaneously in an earthquake or gradually as in a melting ice field, the Earth?s gravity in the local region changes and so does the height of the geoid. In the Sumatran earthquake, Sabadini and Dalla Via found that the total geoid movement was some 18 mm ? a lot for a geoid!

ESA?s Gravity Field and Ocean Circulation Explorer (GOCE) is designed to sensitively investigate the gravitational field of the Earth from orbit. As the spacecraft passes over regions of stronger and weaker gravitational pull, it will bob up and down. Such deviations are far below the perceptible limits of humans but GOCE is equipped with a device called a gradiometer than can detect these ultra-subtle differences. By measuring the deviations in the geoid, scientists can gain a unique window into our planet.

?This work is at the frontier of geophysics and the perfect complement to seismology,? says Sabadini, ?Seismology is good for detecting the slip of earthquake faults and the location of the epicentre, geoid monitoring can determine how much mass is actually being moved around.?

It can also be used in the quest to understand climate change as ocean circulation also affects the geoid. Changes in climate, which in turn affect the ocean circulation pattern, will show up as a yearly change in the geoid. With so much to offer, the GOCE satellite is scheduled to launch in 2006. A paper on the Sumatran Earthquake by Roberto Sabadini, Giorgio Dalla Via, Masja Hoogland, Abdelkrim Aoudia is published in EOS, the journal of the American Geophysical Union.

Original Source: ESA News Release

Iceberg Smashes Off a Chunk of Antarctica

Maps of Antarctica need to be amended. The long-awaited collision between the vast B-15A iceberg and the landfast Drygalski ice tongue has taken place. This Envisat radar image shows the ice tongue ? large and permanent enough to feature in Antarctic atlases – has come off worst.

An image acquired by Envisat on 15 April 2005 shows that a five-kilometre-long section at the seaward end of Drygalski has broken off following a collision with the drifting B-15A. The iceberg itself appears so far unaffected. With more than half the iceberg still to clear the floating pier of ice, Drygalski may undergo more damage in coming days.

It is an old philosophical paradox: what happens when an irresistible force meets an immovable object? For the past few months, ESA’s Envisat satellite has been watching an answer play out in ice, as the B-15A iceberg converged on the Drygalski ice tongue.

The sheer scale of B-15A is best appreciated from space. The bottle-shaped Antarctic iceberg is around 115 kilometres long, with an area exceeding 2500 square kilometres, making it about as large as the entire country of Luxembourg.

From January the iceberg has been drifting towards, then past, the 70-kilometre-long Drygalski ice tongue in McMurdo Sound on the Ross Sea. In the last month prevailing currents have been slowly edging B-15A along past the northern edge of Drygalski.

Envisat’s Advanced Synthetic Aperture Radar (ASAR) instrument has been monitoring events since the start of the year, gathering the highest frequency weather-independent satellite dataset of this area ever.

Ice in opposition
B-15A is the largest remaining section of the even larger B-15 iceberg that calved from the Ross Ice Shelf in March 2000. Equivalent in size to Jamaica, B-15 had an initial area of 11 655 square kilometres but subsequently broke up into smaller pieces.

Since then, the largest piece – B-15A – has found its way to McMurdo Sound, where its presence has blocked ocean currents and led to a build-up of sea ice. With the Antarctic summer now at an end and in-situ observations therefore limited, the ASAR instrument aboard Envisat becomes even more useful for monitoring changes in polar ice and tracking icebergs.

Its radar signals pass freely through the thickest polar storm clouds or local darkness. And because ASAR is sensitive to surface texture as well as physical and chemical properties, the sensor is extremely sensitive to different types of ice ? for example clearly delineating the older rougher surface of the Drygalski ice tongue and iceberg B15A from the surrounding sea ice pack.

The Drygalski ice tongue is located at the opposite end of McMurdo Sound from the US and New Zealand bases. The long narrow tongue stretches out to sea as an extension of the land-based David Glacier, which flows through coastal mountains of Victoria Land.

Twin-mode ASAR Antarctic observations
Envisat’s ASAR instrument monitors Antarctica in two different modes: Global Monitoring Mode (GMM) provides 400-kilometre swath one-kilometre resolution images, enabling rapid mosaicking of the whole of Antarctica to monitor changes in sea ice extent, ice shelves and iceberg movement.

Wide Swath Mode (WSM) possesses the same swath but with 150-metre resolution for a detailed view of areas of particular interest.

ASAR GMM images are routinely provided to a variety of users including the US National Oceanic and Atmospheric Administration (NOAA) National Ice Centre, responsible for tracking icebergs worldwide.

ASAR imagery is also being used operationally to track icebergs in the Arctic by the Northern View and ICEMON consortia, which provide ice monitoring services as part of the Global Monitoring for Environment and Security (GMES) initiative, jointly backed by ESA and the European Union.

This year also sees the launch of CryoSat, a dedicated ice-watching mission designed to precisely map changes in the thickness of polar ice sheets and floating sea ice.

CryoSat, in connection with regular Envisat ASAR GMM mosaics and SAR interferometry ? a technique used to combine radar images to measure tiny centimetre-scale shifts between acquisitions – should answer the question of whether the kind of ice-shelf calving that gave rise to B-15 and its descendants are a consequence of ice sheet dynamics or other factors.

Together they will provide insight into whether such iceberg calving occurrences are becoming more common, as well as improving our understanding of the relationship between the Earth’s ice cover and the global climate.

Original Source: ESA News Release

Earth Seen in Gamma Rays

A NASA-funded scientist has produced a new type of picture of the Earth from space, which complements the familiar image of our “blue marble”. This new picture is the first detailed image of our planet radiating gamma rays, a type of light that is millions to billions of times more energetic than visible light.

The image portrays how the Earth is constantly bombarded by particles from space. These particles, called cosmic rays, hit our atmosphere and produce the gamma-ray light high above the Earth. The atmosphere blocks harmful cosmic rays and other high-energy radiation from reaching us on the Earth’s surface.

“If our eyes could see high-energy gamma rays, this is what the Earth would look like from space,” said Dr. Dirk Petry of NASA Goddard Space Flight Center in Greenbelt, Md. “Other planets — most famously, Jupiter — have a gamma-ray glow, but they are too far away from us to image in any detail.”

Petry assembled this image from seven years of data from NASA’s Compton Gamma-Ray Observatory, which was active from 1991 to 2000. The Compton Observatory orbited the Earth at an average altitude of about 260 miles (420 km). From this distance, the Earth appears as a huge disk with an angular diameter of 140 degrees. The long exposure and close distance enabled Petry to produce a gamma-ray image of surprisingly high detail. “This is essentially a seven-year exposure,” Petry said.

The gamma rays produced in the Earth’s atmosphere were detected by Compton’s EGRET instrument, short for Energetic Gamma-Ray Experiment Telescope. In fact, 60 percent of the gamma rays detected by EGRET were from Earth and not deep space. Although it makes a pretty image, local gamma-ray production interferes with observations of distant gamma-ray sources, such as black holes, pulsars, and supernova remnants.

Petry created this gamma-ray Earth image to better understand the impact of “local” cosmic-ray and gamma-ray interactions on an upcoming NASA mission called GLAST, the Gamma-ray Large Area Space Telescope. GLAST is planned for launch in 2007. Its main instrument, the Large Area Telescope, is essentially EGRET’s successor.

In 1972 and 1973 the NASA satellite SAS-II captured the first resolved image of the Earth in gamma rays, but the detectors had less exposure time (a few months) and worse energy resolution.

Petry, a member of the GLAST team at NASA Goddard, is an assistant research professor at the Joint Center for Astrophysics of the University of Maryland, Baltimore Country. A scientific paper describing his work is available at:

http://xxx.lanl.gov/abs/astro-ph/0410487

Original Source: NASA News Release

Libya’s Ubari and Murzuq Sand Seas

This Envisat image shows two huge sand dune seas in the Fezzan region of southwestern Libya, close to the border with Algeria.

Most of the face of the Sahara desert stretching across Northern Africa is bare stone and pebbles rather than sand dunes, but there are exceptions ? sprawling sea of multi-storey sand dunes known as ‘ergs’.

The Erg Ubari (also called Awbari) is the reddish sand sea towards the top of the image. A dark outcrop of Nubian sandstone separates the Erg Ubari sand from the Erg Murzuq (also called Murzuk) further south.

A persistent high-pressure zone centred over Libya keeps the centre of the Sahara completely arid for years at a time, but research has discovered evidence of ‘paleolakes’ in this region associated with a wetter and more fertile past.

Libya today has no permanent rivers or water bodies, but has various vast fossil aquifers. These natural underground basins hold enormous amounts of fresh water.

Two decades ago an ambitious project called Great Man-Made River was begun, aimed at drawing water from the aquifers beneath the Fezzan region shown in the image, via a network of underground pipes for irrigation in the coastal belt. Upon completion the huge network of pipelines will extend to about 3,380 km.

Envisat’s Medium Resolution Imaging Spectrometer (MERIS), working in Full Resolution mode to provide a spatial resolution of 300 metres, acquired this image on 24 November 2004. It has a width of 672 kilometres.

Original Source: ESA News Release

Lightning Makes Radiation Belts Safer

Lightning in clouds, only a few miles above the ground, clears a safe zone in the radiation belts thousands of miles above the Earth, according to NASA-funded researchers. The unexpected result resolves a forty-year-old debate as to how the safe zone is formed, and it illuminates how the region is cleared after it is filled with radiation during magnetic storms.

The safe zone, called the Van Allen Belt slot, is a potential haven offering reduced radiation dosages for satellites that require Middle Earth Orbits (MEOs). The research may eventually be applied to remove radiation belts around the Earth and other worlds, reducing the hazards of the space environment.

“The multi-billion-dollar Global Positioning System satellites skirt the edge of the safe zone,” said Dr. James Green of NASA’s Goddard Space Flight Center, Greenbelt, Md. He is the lead author of the paper about the research published in the Journal of Geophysical Research. “Without the cleansing effect from lightning, there would be just one big radiation belt, with no easily accessible place to put satellites,” he said.

If the Van Allen radiation belts were visible from space, they would resemble a pair of donuts around the Earth, one inside the other, with the planet in the hole of the innermost. The Van Allen Belt slot would appear as a space between the inner and outer donut. The belts are comprised of high-speed electrically charged particles (electrons and atomic nuclei) trapped in the Earth’s magnetic field. The Earth’s magnetic field has invisible lines of magnetic force emerging from the South Polar Region, out into space and back into the North Polar Region. Because the radiation belt particles are electrically charged, they respond to magnetic forces. The particles spiral around the Earth’s magnetic field lines, bouncing from pole to pole where the planet’s magnetic field is concentrated.

Scientists debated two theories to explain how the safe zone was cleared. The prominent theory stated radio waves from space, generated by turbulence in the zone, cleared it. An alternate theory, confirmed by this research, stated radio waves generated by lightning were responsible. “We were fascinated to discover evidence that strongly supported the lightning theory, because we usually think about how the space environment affects the Earth, not the reverse,” Green said.

The flash we see from lightning is just part of the total radiation it produces. Lightning also generates radio waves. In the same way visible light is bent by a prism, these radio waves are bent by electrically charged gas trapped in the Earth’s magnetic field. That causes the waves to flow out into space along the Earth’s magnetic field lines.

According to the lightning theory, radio waves clear the safe zone by interacting with the radiation belt particles, removing a little of their energy and changing their direction. This lowers the mirror point, the place above the polar regions where the particles bounce. Eventually, the mirror point becomes so low; it is in the Earth’s atmosphere. When this happens, the radiation belt particles can no longer bounce back into space, because they collide with atmospheric particles and dissipate their energy.

To confirm the theory, the team used a global map of lightning activity made with the Micro Lab 1 spacecraft. They used radio wave data from the Radio Plasma Imager on the Imager for Magnetopause to Aurora Global Exploration (IMAGE) spacecraft, combined with archival data from the Dynamics Explorer spacecraft. IMAGE and Dynamics Explorer showed the radio wave activity in the safe zone closely followed terrestrial lightning patterns observed by Micro Lab 1.

According to the team, there would not be a correlation if the radio waves came from space instead of Earth. They concluded when magnetic storms, caused by violent solar activity, inject a new supply of high-speed particles into the safe zone, lightning clears them away in a few days.

Engineers may eventually design spacecraft to generate radio waves at the correct frequency and location to clear radiation belts around other planets. This could be useful for human exploration of interesting bodies like Jupiter’s moon Europa, which orbits within the giant planet’s intense radiation belt.

The research team included Drs. Scott Boardsen, Leonard Garcia, William Taylor, and Shing Fung from Goddard; and Dr. Bodo Reinisch, University of Massachusetts, Lowell. For images and information about this research on the Web, visit: http://www.nasa.gov/vision/universe/solarsystem/image_lightning.html

Original Source: NASA News Release

Gamma Rays Come from the Earth Too

A great mystery was set in motion a few years ago when a spacecraft designed to measure gamma-ray bursts — the most powerful explosions in the Universe — found that Earth was actually emitting some flashes of its own.

Named Terrestrial gamma-ray flashes (TGFs), these very short blasts of gamma rays lasting about one millisecond, are emitted into space from Earth’s upper atmosphere. Scientists believe electrons traveling at nearly the speed of light scatter off of atoms and decelerate in the upper atmosphere, emitting the TGFs.

The Burst and Transient Source Experiment (BATSE) on the Compton Gamma-Ray Observatory discovered TGFs in 1994, but was limited in its ability to count them or measure peak energies. New observations from the Reuven Ramaty High Energy Solar Spectroscopic Imager (RHESSI) satellite raise the maximum recorded energy of TGFs by a factor of ten and indicate that the Earth gives off about 50 TGFs every day, and possibly more.

“The energies we see are as high as those of gamma rays emitted from black holes and neutron stars,” said David Smith, an assistant professor of physics at UC Santa Cruz and author of a scientific paper on this topic.

The exact mechanism that accelerates the electron beams to produce TGFs is still uncertain, he said, but it probably involves the build-up of electric charge at the tops of thunderclouds due to lightning discharges. This results in a powerful electric field between the cloudtops and the ionosphere, the outer layer of Earth’s atmosphere.

TGFs have been associated with lightning strikes and may be related to red sprites and blue jets, side effects of thunderstorms that occur in the upper atmosphere and are typically only visible with high-altitude aircraft and satellites. The exact relationship between all these events is still unclear, though.

RHESSI was launched in 2002 to study X-rays and gamma-rays from solar flares, but its detectors pick up gamma rays from a variety of sources. While scientists estimate a global average rate of about 50 TGFs a day, the rate could be up to 100 times higher if, as some models indicate, TGFs are emitted as narrowly focused beams that would only be detected when the satellite is directly in their path.

Original Source: NASA News Release

Giant Iceberg on Collision Course

Some anticipated the ‘collision of the century’: the vast, drifting B15-A iceberg was apparently on collision course with the floating pier of ice known as the Drygalski ice tongue. Whatever actually happens from here, Envisat’s radar vision will pierce through Antarctic clouds to give researchers a ringside seat.

A collision was predicted to have already occurred by now by some authorities, but B-15A’s drift appears to have slowed markedly in recent days, explains Mark Drinkwater of ESA’s Ice/Oceans Unit: “The iceberg may have run aground just before colliding. This supports the hypothesis that the seabed around the Drygalski ice tongue is shallow, and surrounded by deposits of glacial material that may have helped preserve it from past collisions, despite its apparent fragility.

“What may be needed to release it from its present stalled location is for the surface currents to turn it into the wind, combined with help from a mixture of wind, tides and bottom melting to float it off its perch.”

To follow events for yourself, visit ESA’s Earthwatching site, where the latest images from Envisat’s Advanced Synthetic Aperture Radar (ASAR) instrument are being posted online daily.

Opposing ice objects
The largest floating object on Earth, the bottle-shaped B-15A iceberg is around 120 kilometres long with an area exceeding 2500 square kilometres, making it about as large as the entire country of Luxembourg.

B15-A is the largest remaining segment of the even larger B-15 iceberg that calved from the Ross Ice Shelf in March 2000. Equivalent in size to Jamaica, B-15 had an initial area of 11 655 square kilometres but subsequently broke up into smaller pieces.

Since then B-15A has found its way to McMurdo Sound, where its presence has blocked ocean currents and led to a build-up of sea ice. This has led to turn to resupply difficulties for the United States and New Zealand scientific stations in the vicinity and the starvation of numerous local penguins unable to forage the local sea.

ESA’s Envisat has been tracking the progress of B-15A for more than two years. An animated flyover based on past Envisat imagery begins by depicting the region as it was in January 2004, as seen by the optical Medium Resolution Imaging Spectrometer (MERIS) instrument (View the full animation – Windows Media Player, 3Mb).

The animation then moves four months back in time to illustrate the break-up of the original, larger B-15A (the current B-15A having inherited its name), split asunder by storms and currents while run aground on Ross Island, as observed by repeated ASAR observations. The animation ends with a combined MERIS/ASAR panorama across Victoria Land, including a view of the the Erebus ice tongue, similar to B-15A’s potential ‘victim’, the Drygalski ice tongue.

As the animation shows, ASAR is extremely useful for tracking changes in polar ice. ASAR can peer through the thickest polar clouds and work through local day and night. And because it measures surface texture, the instrument is also extremely sensitive to different types of ice ? so the radar image clearly delineates the older, rougher surface of ice tongues from surrounding sea ice, while optical sensors simply show a continuity of snow-covered ice.

“An ice tongue is ‘pure’ glacial ice, while the surrounding ice is fast ice, which is a form of saline sea ice,” Drinkwater says. “To the radar there is extreme backscatter contrast between the relatively pure freshwater ice tongue ? which originated on land as snow ? and the surrounding sea ice, due to their very different physical and chemical properties.”

The Drygalski ice tongue is located at the opposite end of McMurdo Sound from the US and New Zealand bases. Large and (considered) permanent enough to be depicted on standard atlas maps of the Antarctic continent, the long narrow tongue stretches 70 kilometres out to sea as an extension of the land-based David Glacier, which flows through coastal mountains of Victoria Land.

Measurements show the Drygalski ice tongue has been growing seaward at a rate of between 50 and 900 metres a year. Ice tongues are known to rapidly change their size and shape and waves and storms weaken their ends and sides, breaking off pieces to float as icebergs.

First discovered by British explorer Robert Falcon Scott in 1902, the Drygalski ice tongue is around 20 km wide. Its floating glacial ice is between 50 and 200 metres thick. The tongue’s history has been traced back at least as far as 4000 years. One source has been radiocarbon dating of guano from penguin rookeries in the vicinity ? the ice tongue has a body of open water on its north side that its presence blocks from freezing, sustaining the penguin population.

ESA’s Envisat environmental satellite
“The Drygalski ice tongue has been remarkably resilient over at least the last century,” Drinkwater concludes. “In spite of its apparent vulnerability, shallower bathymetry of the area ? enhanced by deposition of glacial sediments ? may play an important role in diverting the larger icebergs with more significant draught around this floating promontory.

“This may rule out its potential catastrophic removal from collision with a large drifting berg in the short term. That leaves the elements of temperature variations, wave and tidal flexure, or bending, to weaken and periodically whittle pieces off the end of the ice promontory.”

The 400-kilometre swath, 150-metre resolution images shown here of B-15A and the Drygalski ice tongue are from ASAR working in Wide Swath Mode (WSM). Envisat also monitors Antarctica in Global Monitoring Mode (GMM), with the same swath but a resolution of one kilometre, enabling rapid mosaicking of the whole of Antarctica to monitor changes in sea ice extent, ice shelves and iceberg movement.

Often prevailing currents transport icebergs far from their initial calving areas way across Antarctica, as with B-15D, another descendant of B-15, which has travelled a quarter way counterclockwise (westerly) around the continent at an average velocity of 10 km a day.

ASAR GMM images are routinely provided to a variety of users including the US National Oceanic and Atmospheric Administration (NOAA) National Ice Center, responsible for tracking icebergs worldwide.

ASAR imagery is also being used operationally to track icebergs in the Arctic by the Northern View and ICEMON consortia, providing ice monitoring services as part of the Global Monitoring for Environment and Security (GMES) initiative, jointly backed by ESA and the European Union. The two consortia are considering plans to extend their services to the Antarctic.

This year also sees the launch of ESA’s CryoSat, a dedicated ice-watching mission designed to precisely map changes in the thickness of polar ice sheets and floating sea ice.

CryoSat should answer the question of whether the kind of icesheet calving that gave rise to B-15 and its descendants are becoming more common, as well as improving our understanding of the relationship between

Original Source: ESA News Release

How Much Did the Earth Move?

NASA scientists using data from the Indonesian earthquake calculated it affected Earth’s rotation, decreased the length of day, slightly changed the planet’s shape, and shifted the North Pole by centimeters. The earthquake that created the huge tsunami also changed the Earth’s rotation.

Dr. Richard Gross of NASA’s Jet Propulsion Laboratory, Pasadena, Calif., and Dr. Benjamin Fong Chao, of NASA’s Goddard Space Flight Center, Greenbelt, Md., said all earthquakes have some affect on Earth’s rotation. It’s just they are usually barely noticeable.

“Any worldly event that involves the movement of mass affects the Earth’s rotation, from seasonal weather down to driving a car,” Chao said.

Gross and Chao have been routinely calculating earthquakes’ effects in changing the Earth’s rotation in both length-of- day as well as changes in Earth’s gravitational field. They also study changes in polar motion that is shifting the North Pole. The “mean North pole” was shifted by about 2.5 centimeters (1 inch) in the direction of 145 degrees East Longitude. This shift east is continuing a long-term seismic trend identified in previous studies.

They also found the earthquake decreased the length of day by 2.68 microseconds. Physically this is like a spinning skater drawing arms closer to the body resulting in a faster spin. The quake also affected the Earth’s shape. They found Earth’s oblateness (flattening on the top and bulging at the equator) decreased by a small amount. It decreased about one part in 10 billion, continuing the trend of earthquakes making Earth less oblate.

To make a comparison about the mass that was shifted as a result of the earthquake, and how it affected the Earth, Chao compares it to the great Three-Gorge reservoir of China. If filled, the gorge would hold 40 cubic kilometers (10 trillion gallons) of water. That shift of mass would increase the length of day by only 0.06 microseconds and make the Earth only very slightly more round in the middle and flat on the top. It would shift the pole position by about two centimeters (0.8 inch).

The researchers concluded the Sumatra earthquake caused a length of day change too small to detect, but it can be calculated. It also caused an oblateness change barely detectable, and a pole shift large enough to be possibly identified. They hope to detect the length of day signal and pole shift when Earth rotation data from ground based and space-borne position sensors are reviewed.

The researchers used data from the Harvard University Centroid Moment Tensor database that catalogs large earthquakes. The data is calculated in a set of formulas, and the results are reported and updated on a NASA Web site.

The massive earthquake off the west coast of Indonesia on December 26, 2004, registered a magnitude of nine on the new “moment” scale (modified Richter scale) that indicates the size of earthquakes. It was the fourth largest earthquake in one hundred years and largest since the 1964 Prince William Sound, Alaska earthquake.

The devastating mega thrust earthquake occurred as a result of the India and Burma plates coming together. It was caused by the release of stresses that developed as the India plate slid beneath the overriding Burma plate. The fault dislocation, or earthquake, consisted of a downward sliding of one plate relative to the overlying plate. The net effect was a slightly more compact Earth. The India plate began its descent into the mantle at the Sunda trench that lies west of the earthquake’s epicenter. For information and images on the Web, visit:

http://www.nasa.gov/vision/earth/lookingatearth/indonesia_quake.html .

For details on the Sumatra, Indonesia Earthquake, visit the USGS Internet site:

http://neic.usgs.gov/neis/bulletin/neic_slav_ts.html .

For information about NASA and agency programs Web, visit:

http://www.nasa.gov .

JPL is managed for NASA by the California Institute of Technology in Pasadena.

Original Source: NASA News Release

Topography Mission Wraps Up With Australia

Culminating more than four years of processing data, NASA and the National Geospatial-Intelligence Agency have completed Earth’s most extensive global topographic map.

The data, extensive enough to fill the U.S. Library of Congress, were gathered during the Shuttle Radar Topography Mission, which flew in February 2000 on the Space Shuttle Endeavour.

The digital elevation maps encompass 80 percent of Earth’s landmass. They reveal for the first time large, detailed swaths of Earth’s topography previously obscured by persistent cloudiness. The data will benefit scientists, engineers, government agencies and the public with an ever-growing array of uses.

“This is among the most significant science missions the Shuttle has ever performed, and it’s probably the most significant mapping mission of any single type ever,” said Dr. Michael Kobrick, mission project scientist at NASA’s Jet Propulsion Laboratory, Pasadena, Calif.

The final data release covers Australia and New Zealand in unprecedented uniform detail. It also covers more than 1,000 islands comprising much of Polynesia and Melanesia in the South Pacific, as well as islands in the South Indian and Atlantic oceans.

“Many of these islands have never had their topography mapped,” Kobrick said. “Their low topography makes them vulnerable to tidal effects, storm surges and long-term sea level rise. Knowing exactly where rising waters will go is vital to mitigating the effects of future disasters such as the Indian Ocean tsunami.”

Data from the Shuttle Radar Topography Mission are being used for applications ranging from land use planning to “virtual” Earth exploration. “Future missions using similar technology could monitor changes in Earth’s topography over time, and even map the topography of other planets,” said Dr. John LaBrecque, manager of NASA’s Solid Earth and Natural Hazards Program, NASA Headquarters, Washington, D.C.

The mission’s radar system mapped Earth from 56 degrees south to 60 degrees north of the equator. The resolution of the publicly available data is three arc-seconds (1/1,200th of a degree of latitude and longitude, about 295 feet, at Earth’s equator). The mission is a collaboration among NASA, the National Geospatial- Intelligence Agency, and the German and Italian space agencies. The mission’s role in space history was honored with a display of the mission’s canister and mast antenna at the Smithsonian Institution’s Udvar-Hazy Center, Chantilly, Va.

To view a selection of new images from the Shuttle Radar Topography Mission’s latest data set on the Internet, visit http://photojournal.jpl.nasa.gov/mission/SRTM.

To view a new fly-over animation of New Zealand on the Internet, visit http://www2.jpl.nasa.gov/srtm/.

To learn more about this mission, visit http://www.jpl.nasa.gov/srtm . For an interactive multimedia geography quiz using data from the mission, visit http://www.jpl.nasa.gov/multimedia/srtm/.

For information about NASA and agency programs, visit: http://www.nasa.gov.

Original Source: NASA News Release

Mediterranean Heat Map Produced from Space

Image credit: ESA
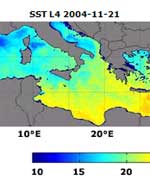
This ultra high-resolution sea surface temperature map of the Mediterranean could only have been made with satellites. Any equivalent ground-based map would need almost a million and a half thermometers placed into the water simultaneously, one for every two square kilometres of sea.

This most detailed ever heat map of all 2 965 500 square kilometres of the Mediterranean, the world’s largest inland sea is being updated on a daily basis as part of ESA’s Medspiration project.

With sea surface temperature (SST) an important variable for weather forecasting and increasingly seen as a key indicator of climate change, the idea behind Medspiration is to combine data from multiple satellite systems to produce a robust set of sea surface data for assimilation into ocean forecasting models of the waters around Europe and also the whole of the Atlantic Ocean.

For the Mediterranean Sea, the Medspiration product is being created to an unprecedented spatial resolution of two square kilometres, as Ian Robinson of the Southampton Oceanography Centre, managing the Medspiration Project explains: “The surface temperature distribution in the Mediterranean contains many finely detailed features that reveal eddies, fronts and plumes associated with the dynamics of water circulation. A resolution as fine as this is needed to allow these features to be properly tracked.”

The remaining ocean products are intended to have a still impressive spatial resolution of ten square kilometres. Overall results from the Medspiration project also feed into an even more ambitious scheme to combine all available SST data into a worldwide high-resolution product, known as the Global Ocean Data Assimilation Experiment (GODAE) High-Resolution Sea Surface Temperature Pilot Project (GHRSST-PP).

Its aim is to deliver to the user community a new generation of highly accurate worldwide SST products with a space resolution of less than ten kilometres every six hours.

As an important step towards achieving this goal, ESA has not only initiated Medspiration as the European contribution to the overall GHRSST-PP effort, but the Agency funded a GHRSST International Project Office, located at the Hadley Centre for Climate Prediction and Research, a part of the UK Met Office located in Exeter.

“Medspiration is at the forefront of the GHRSST-PP effort and is driving the operational demonstration of GHRSST-PP as an international system,” says Craig Donlon, head of the GHRSST Office. “GHRSST has developed with a ‘system of systems’ approach, demanding stable interfaces and comprehensive data handling and processing systems.

“Medspiration is ready to deliver the European component of GHRSST-PP. Over the next 12 months Medspiration will play a fundamental role in partnership with other operational groups in the USA, Australia and Japan as the GHRSST-PP system begins the operational delivery of a new generation of SST data products to European and international user communities in near real time.”

The temperature of the surface of the ocean is an important physical property that strongly influences the transfer of heat energy, momentum, water vapour and gases between the ocean and the atmosphere.

And because water takes a long time to warm up or cool down the sea surface functions as an enormous reservoir of heat: the top two metres of ocean alone store all the equivalent energy contained in the atmosphere.

The whole of their waters store more than a thousand times this same value ? climatologists sometimes refer to the oceans as the ‘memory’ of the Earth’s climate, and measuring SST on a long-term basis is the most reliable way to establish the rate of global warming.

Like thermometers in the sky, a number of different satellites measure SST on an ongoing basis. For example, the Advanced Along-Track Scanning Radiometer (AATSR) aboard ESA’s Envisat uses infrared wavelengths to acquire SST for a square kilometre of ocean to an accuracy of 0.2 ?C. In fact, thanks to its high accuracy, AATSR is helping to calibrate other sensors employed by the Medspiration project.

Other satellites may have decreased accuracy or resolution, but potentially make up for it with cloud-piercing microwave abilities or much larger measuring ‘footprints’. Combine all available satellite data together ? along with localised measurements from buoys and research ships – and you can achieve daily monitoring of the temperature of all the oceans covering 71% of the Earth’s surface. This information is then prepared for input into the relevant ‘virtual ocean’ ? a sophisticated computer model of the genuine article.

The combination of satellite and also available in-situ observations with numerical modelling ? a technique known as ‘data assimilation’ ? is an extremely powerful one. It has revolutionised atmospheric weather forecasting and is now being applied to the oceans.

Near real time observational inputs keep an ocean model from diverting too much from reality, while the outputs from the model make up for any gaps in coverage. With maximised coupling between actual observations and the numerical model, output data can be credibly used for operational tasks such as sea state and algal bloom forecasting, and predicting the path of oil spills. And these models can also be used to look deeper than just the ocean surface.

“The time is coming for operational monitoring and forecasting of three-dimensional global ocean structure,” comments Jean-Louis Fellous, Director for Ocean Research at France’s IFREMER, the French Research Institute for Exploitation of the Sea, a Medspiration project partner. “A project like Medspiration is a key contribution to this endeavour.

“With the capabilities offered by spaceborne SST sensors, by satellite altimeters and by the 1,500 profiling floats measuring temperature and salinity in the deep ocean ? and all this data being fed in near-real time to global ocean models, this vision is becoming a reality.”

Although the new map of the Mediterranean represents an important step forward, both Medspiration and GODAE GHRSST-PP remain works in progress at this point.

The main problem with monitoring high-resolution SST of the Mediterranean is cloud cover. To compensate the team has available a near real time data stream from four separate satellites ? two European, one American and one Japanese. Also applied is a technique called ‘objective analysis’ that minimises cloud effects by interpolating values from just outside the obscured area or from that area measured at times before or after cloud covered it.

Mixing satellite data together on a routine basis is fraught with difficulty because the thermal structure of the upper ocean is actually extremely complex, and different sensors may be measuring different values. There is also considerable day-to-night variability, with daytime temperatures varying with depth much more than those during the night.

Part of the aim of Medspiration is to fully account for this diurnal cycle, in order to improve the overall effectiveness of its data assimilation into ocean forecasting models.

Original Source: ESA News Release