New Research Helps Explain Dust Bowl Drought

Image credit: NOAA
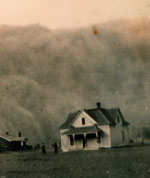
NASA scientists have an explanation for one of the worst climatic events in the history of the United States, the “Dust Bowl” drought, which devastated the Great Plains and all but dried up an already depressed American economy in the 1930’s.

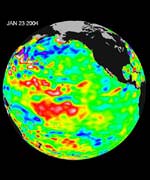
Siegfried Schubert of NASA’s Goddard Space Flight Center, Greenbelt, Md., and colleagues used a computer model developed with modern-era satellite data to look at the climate over the past 100 years. The study found cooler than normal tropical Pacific Ocean surface temperatures combined with warmer tropical Atlantic Ocean temperatures to create conditions in the atmosphere that turned America’s breadbasket into a dust bowl from 1931 to 1939. The team’s data is in this week’s Science magazine.

These changes in sea surface temperatures created shifts in the large-scale weather patterns and low level winds that reduced the normal supply of moisture from the Gulf of Mexico and inhibited rainfall throughout the Great Plains.

“The 1930s drought was the major climatic event in the nation’s history,” Schubert said. “Just beginning to understand what occurred is really critical to understanding future droughts and the links to global climate change issues we’re experiencing today,” he said.

By discovering the causes behind U.S. droughts, especially severe episodes like the Plains’ dry spell, scientists may recognize and possibly foresee future patterns that could create similar conditions. For example, La Ni?as are marked by cooler than normal tropical Pacific Ocean surface water temperatures, which impact weather globally, and also create dry conditions over the Great Plains.

The researchers used NASA’s Seasonal-to-Interannual Prediction Project (NSIPP) atmospheric general circulation model and agency computational facilities to conduct the research. The NSIPP model was developed using NASA satellite observations, including; Clouds and the Earth’s Radiant Energy System radiation measurements; and the Global Precipitation Climatology Project precipitation data.

The model showed cooler than normal tropical Pacific Ocean temperatures and warmer than normal tropical Atlantic Ocean temperatures contributed to a weakened low-level jet stream and changed its course. The jet stream, a ribbon of fast moving air near the Earth’s surface, normally flows westward over the Gulf of Mexico and then turns northward pulling up moisture and dumping rain onto the Great Plains. As the low level jet stream weakened, it traveled farther south than normal. The Great Plains dried up and dust storms formed.

The research shed light on how tropical sea surface temperatures can have a remote response and control over weather and climate. It also confirmed droughts can become localized based on soil moisture levels, especially during summer. When rain is scarce and soil dries, there is less evaporation, which leads to even less precipitation, creating a feedback process that reinforces lack of rainfall.

The study also shed light on droughts throughout the 20th century. Analysis of other major U.S. droughts of the 1900s suggests a cool tropical Pacific was a common factor. Schubert said simulating major events like the 1930s drought provides an excellent test for computer models. While the study finds no indication of a similar Great Plains drought in the near future, it is vital to continue studies relating to climate change. NASA’s current and planned suite of satellite sensors is uniquely poised to answer related climate questions.

Original Source: NASA News Release

Tracking Diseases from Space

Image credit: NASA
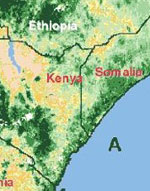
Last year more than a million people died of malaria, mostly in Sub-saharan Africa. Outbreaks of Dengue Fever, hantavirus, West Nile Fever, Rift Valley Fever, and even Plague still occasionally strike villages, towns, and whole regions. To the dozens or hundreds who suffer painful deaths, and to their loved ones, these diseases must seem to spring upon them from nowhere.

Yet these diseases are not without rhyme or reason. When an outbreak occurs, often it is because environmental conditions such as rainfall, temperatures, and vegetation set the stage for a population surge in disease-carrying pests. Mosquitoes or mice or ticks thrive, and the diseases they carry spread rapidly.

So why not watch these environmental factors and warn when conditions are ripe for an outbreak? Scientists have been tantalized by this possibility ever since the idea was first expressed by the Russian epidemiologist E. N. Pavlovsky in the 1960s. Now technology and scientific know-how are catching up with the idea, and a region-wide early warning system for disease outbreaks appears to be within reach.

Ronald Welch of NASA’s Global Hydrology and Climate Center in Huntsville, Alabama, is one of the scientists working to develop such an early warning system. “I have been to malarious areas in both Guatemala and India,” he says. “Usually I am struck by the poverty in these areas, at a level rarely seen in the United States. The people are warm and friendly, and they are appreciative, knowing that we are there to help. It feels very good to know that you are contributing to the relief of sickness and preventing death, especially the children.”

The approach employed by Welch and others combines data from high-tech environmental satellites with old-fashioned, “khaki shorts and dusty boots” fieldwork. Scientists actually seek out and visit places with disease outbreaks. Then they scrutinize satellite images to learn how disease-friendly conditions look from space. The satellites can then watch for those conditions over an entire region, country, or even continent as they silently slide across the sky once a day, every day.

In India, for example, where Welch is doing research, health officials are talking about setting up a satellite-based malaria early warning system for the whole country. In coordination with mathematician Jia Li of the University of Alabama at Huntsville and India’s Malaria Research Center, Welch is hoping to do a pilot study in Mewat, a predominantly rural area of India south of New Delhi. The area is home to more than 700,000 people living in 491 villages and 5 towns, yet is only about two-thirds the size of Rhode Island.

“We expect to be able to give warnings of high disease risk for a given village or area up to a month in advance,” Welch says. “These ‘red flags’ will let health officials focus their vaccination programs, mosquito spraying, and other disease-fighting efforts in the areas that need them most, perhaps preventing an outbreak before it happens.”

Outbreaks are caused by a bewildering variety of factors.

For the mosquito species that carries malaria in Welch’s study area, for example, an outbreak hotspot would have pools of stagnant water where adult mosquitoes can deposit their eggs to mature into new adults. These could be lingering puddles on dense, clay-like soil after heavy rains, swamplands located nearby, or even rain-filled buckets habitually left outside by villagers. A malaria hotspot would be warmer than 18?C, because in colder weather, the single-celled “plasmodium” parasite that actually causes malaria operates too slowly to go through its infection cycle before the host mosquito dies. But the weather mustn’t be too hot, or the mosquitoes would have to hide in the shade. The humidity must hover in the 55% to 75% range that these mosquitoes require for survival. Preferably there would be cattle or other livestock within the mosquitoes’ 1 km flight range, because these pests actually prefer to feed on the blood of animals.

If all of these conditions coincide, watch out!

Documenting some of these factors, such as soil type and local bucket-leaving habits, requires initial groundwork by researchers in the field, Welch notes. This information is plugged into a computerized mapping system called a Geographical Information Systems database (GIS). Fieldwork is also required to characterize how the local species of mosquito behaves. Does it bite people indoors or outdoors or both? Other factors, like the locations of cattle pastures and human dwellings, are inputted into the GIS map based on ultra-high resolution satellite images from commercial satellites like Ikonos and QuickBird, which can spot objects on the ground as small as 80 cm across. Then region-wide variables like temperature, rainfall, vegetation types, and soil moisture are derived from medium-resolution satellite data, such as from Landsat 7 or the MODIS sensor on NASA’s Terra satellite. (MODIS stands for MODerate-resolution Imaging Spectrometer.)

Scientists feed all of this information into a computer simulation that runs on top of a digital map of the landscape. Sophisticated mathematical algorithms chew on all these factors and spit out an estimate of outbreak risk.

The basic soundness of this approach for estimating disease risk has been borne out by previous studies. A group from the University of Nevada and the Desert Research Institute were able to “predict” historical rates of deer-mouse infection by the Sin Nombre virus with up to 80% accuracy, based only on vegetation type and density, elevation and slope of the land, and hydrologic features, all derived from satellite data and GIS maps. A joint NASA Ames / University of California at Davis study achieved a 90% success rate in identifying which rice fields in central California would breed large numbers of mosquitoes and which would breed fewer, based on Landsat data. Another Ames project predicted 79% of the high-mosquito villages in the Chiapas region of Mexico based on landscape features seen in satellite images.

Perfect predictions will likely never be possible. Like weather, the phenomenon of human disease is too complicated. But these encouraging results suggest that reasonably accurate risk estimates can be achieved by combining old-fashioned fieldwork with the newest in satellite technologies.

“All of the necessary pieces of the puzzle are there,” Welch says, offering the hope that soon disease outbreaks that seem to come “from out of nowhere” will catch people off guard much less often.

Original Source: NASA Science Story

Santa Ana Winds Stimulate Marine Environment

Image credit: NASA/JPL
Southern California’s legendary Santa Ana winds wreak havoc every year, creating hot, dry conditions and fire hazards. Despite their often-destructive nature, a study of the “Devil Winds,” conducted using data from NASA’s Quick Scatterometer (Quikscat) spacecraft and its SeaWinds instrument shows the winds have some positive benefits.

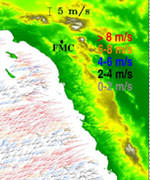
“These strong winds, which blow from the land out into the ocean, cause cold water to rise from the bottom of the ocean to the top, bringing with it many nutrients that ultimately benefit local fisheries,” said Dr. Timothy Liu, a senior research scientist at NASA’s Jet Propulsion Laboratory, Pasadena, Calif., and Quikscat project scientist. Santa Ana consequences include vortices of cold water and high concentrations of chlorophyll 400 to 1,000 kilometers (248 to 621 miles) offshore.

Liu and Dr. Hua Hu of the California Institute of Technology, Pasadena, in a paper published last year in Geophysical Research Letters, revealed satellite observations of the Santa Ana effects on the ocean during three windy days in February 2003. According to the findings, Quikscat was able to identify the fine features of the coastal Santa Ana wind jets. It identified location, strength and extent, which other weather prediction products lack the resolution to consistently show, and moored ocean buoys lack sufficient coverage to fully represent.

Quikscat’s high-resolution images of air-sea interaction were used to measure wind forces on the ocean. Other satellites and instruments, like the Sea-viewing Wide Field-of-view Sensor (SeaWiFS) and the Advanced Very High Resolution Radiometer, onboard a National Oceanic and Atmospheric Administration polar orbiting weather satellite, were used to measure the temperature and biological production of the ocean surface, which respond to the wind.

The latter instrument showed sea surface temperatures dropped four degrees Celsius (seven degrees Fahrenheit) during the February 2003 Santa Anas. That was a sign that upwelling had occurred, meaning, deep cold water moved up to the ocean surface bringing nutrients. Images from SeaWiFS confirmed the increased biological productivity by measuring chlorophyll concentrations in the surface water. It went from negligible, in the absence of winds, to very active biological activity (more than 1.5 milligrams per cubic meter) in the presence of the winds.

“There really is no other system that can monitor Santa Ana winds over the entire oceanic region,” Liu said. “Scatterometers such as Quikscat have a large enough field of view and high enough resolution to easily identify the details of coastal winds, which can affect the transportation, ecology and economy of Southern California.”

High pressure develops inland when cold air is trapped over the mountains, driving the dry, hot and dusty Santa Anas (also called Santanas and Devil’s Breath) at high speeds toward the coast. The winds, occurring in fall, winter and spring, can reach 113 kilometers (70 miles) per hour. They happen at any time of day and usually reach peak strength in December. Telltale signs on the coast include good visibility inland, unusually low humidity and an approaching dark brown dust cloud.

The Quikscat satellite, launched in June 1999, operates in a Sun- synchronous, 800-kilometer (497-mile) near-polar orbit. It circles Earth every 100 minutes and takes approximately 400,000 daily measurements over 93 percent of the planet’s surface. It passes over Southern California about twice a day, skipping a day every three or four days.

Quikscat is part of an integrated Earth observation system managed by NASA’s Office of Earth Science. The NASA enterprise is dedicated to understanding the Earth as an integrated system and applying Earth System Science to improve prediction of climate, weather, and natural hazards using the unique vantage point of space.

For information about NASA programs on the Internet, visit:

http://www.nasa.gov.

For information about Quikscat and SeaWinds on the Internet, visit:

http://winds.jpl.nasa.gov.

Original Source: NASA/JPL News Release

NASA Finds Smoke Can Choke Clouds

Image credit: NASA
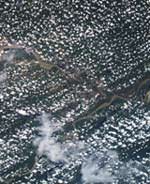
Using data from NASA’s Aqua satellite, agency scientists found heavy smoke from burning vegetation inhibits cloud formation. The research suggests the cooling of global climate by pollutant particles, called “aerosols,” may be smaller than previously estimated.

During the August-October 2002 burning season in South America’s Amazon River basin, scientists observed cloud cover decreased from about 40 percent in clean-air conditions to zero in smoky air.

Until recently, scientists thought aerosols such as smoke particles mainly served to cool the planet by shading the surface, either directly, by reflecting sunlight back toward space, or indirectly, by making clouds more reflective. Certain aerosols make clouds’ droplets smaller and more numerous, thereby making the clouds more reflective while reducing the amount of sunlight reaching the surface.

However, this new study proves smoke aerosols have a “semi- direct” effect on climate, causing a reduction in cloud cover and warming the surface. In the morning, smoke absorbs incoming solar radiation and heats the atmosphere while cooling the surface. Since there is less upward transport of warmth and moisture in such conditions, clouds are less likely to form. Then, in the afternoon, since there is less cloud cover, more sunlight passes through the atmosphere and warms the surface.

“This instantaneous warming is important and can dramatically affect the people and the Amazonian ecosystem,” said Ilan Koren, research scientist at NASA’s Goddard Space Flight Center in Greenbelt, Md.

Koren is lead author of a paper in the current issue of Science. Using Aqua data, Koren and his NASA co-authors measured the total amount of light reflected through the top of the atmosphere. From those data they determined how much area was covered by clouds and how much by smoke. They also estimated the smoke’s “optical thickness,” a measure of how much sunlight the smoke prevented from traveling down through a column of atmosphere.

The team found the smoke and clouds together would ordinarily reflect solar energy equal to one 28-watt light bulb per square meter back up into space (i.e., a cooling effect). With the reduction in cloud cover, however, solar energy equal to one eight-watt light bulb per square meter is absorbed within Earth’s climate system (i.e., a warming effect).

The team consulted other weather data to make sure the differences in cloud patterns were not due to regional differences in meteorology. Once team members proved the meteorological conditions were the same in the smoky regions as they were in the cloudy regions, they knew the smoke had to be the reason average cloud cover dropped from 40 percent to zero in the presence of heavy smoke.

“We used to think of smoke mainly as a reflector, reflecting sunlight back to space, but here we show that, due to absorption, it chokes off cloud formation,” Koren said.

According to Koren, smoke inhibition of cloud formation is not unique to the Amazon area. His team has seen similar examples in other parts of the world, including over parts of Africa during the burning season, and over Canada during major boreal forest wildfires. When added up over the entire globe, the warming influence of smoke and other absorbing aerosols suggests the global cooling influence of these particles is much smaller than current models predict.

Smoke and aerosol inhibition of cloud formation was first proposed in two previous NASA studies based upon results of computer model experiments. However, this study documents the first time this effect of smoke on clouds has been measured in Earth’s environment. The research was funded by NASA’s Earth Science Enterprise. The Enterprise is dedicated to understanding the Earth as an integrated system and applying Earth system science to improve predication of climate, weather and natural hazards using the unique vantage point of space.

Original Source: NASA News Release
Nasca Lines Imaged from Orbit

Image credit: ESA
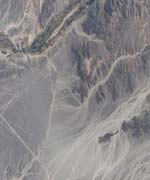
Visible from ESA’s Proba spacecraft 600 kilometres away in space are the largest of the many Nasca Lines; ancient desert markings now at risk from human encroachment as well as flood events feared to be increasing in frequency.

Designated a World Heritage Site in 1994, the Lines are a mixture of animal figures and long straight lines etched across an area of about 70 km by 30 km on the Nasca plain, between the Andes and Pacific Coast at the southern end of Peru. The oldest lines date from around 400 BC and went on being created for perhaps a thousand years.

They were made simply enough, by moving dark surface stones to expose pale sand beneath. However their intended purpose remains a mystery. It has variously been proposed they were created as pathways for religious processions and ceremonies, an astronomical observatory or a guide to underground water resources.

The Nasca Lines have been preserved down the centuries by extreme local dryness and a lack of erosion mechanisms, but are now coming increasingly under threat: it is estimated the last 30 years saw greater erosion and degradation of the site than the previous thousand years before them.

In this image, acquired by the Compact High Resolution Imaging Spectrometer (CHRIS) instrument aboard Proba on 26 September 2003, the 18.6 metre resolution is too low to make out the animal figures although the straight Nasca Lines can be seen faintly. Clearest of the straight markings is actually the Pan-American Highway, built right through the region ? seen as a dark marking starting at the irrigated fields beside the Ingenio River, running from near the image top to the bottom right hand corner. Associated dirt track roads are also visible amidst the Nasca Lines.

Clearly shown in the Proba image is another cause of damage to the Lines: deposits left by mudslides after heavy rains in the Andean Mountains. These events are believed to be connected to the El Ni?o phenomenon in the Pacific Ocean ? first named by Peruvian fishermen hundreds of years ago ? and one concern is they are becoming more frequent due to climate change.

A team from Edinburgh University and remote sensing company Vexcel UK has been using data from another ESA spacecraft to measure damage to the Nasca Lines, with their results due to be published in the May Issue of the International Journal of Remote Sensing.

Their work involves combining radar images from the Synthetic Aperture Radar (SAR) instrument aboard ERS-2. Instead of measuring reflected light, SAR makes images from backscattered radar signals that chart surface roughness.

Nicholas Walker of Vexcel UK explained: “Although the instrument lacks sufficient resolution to unambiguously distinguish individual lines and shapes, by combining two satellite images using a technique known as SAR interferometric coherence it is possible to detect erosion and changes to the surface at the scale of centimetres”.

The image shown combines two scenes acquired by ERS-2 in 1997 and 1999. The bright areas show where there has been very little terrain change in the interval, while darker regions show where de-correlation has occurred, highlighting possible sites where erosion may be taking place.

“Some de-correlation comes simply from the geometry of the area as seen by the instrument in space, with low coherence around areas overshadowed by Andean foothills to the east of the Nasca plain,” said Iain Woodhouse of Edinburgh University. “The second major loss is seen in the river valleys, due primarily to agricultural activity taking place during the two-year period.

“The third is changes in the surface of the plain due to run-off and human activity. The dark lines crossing the plain are roads and tracks serving local communities and the power line, as well as the Pan American Highway, the only surfaced road in this region of Peru.”

The de-correlation observed is most likely caused by vehicles displacing stones along these tracks and the sides of the Pan-American Highway. The de-correlation from the run-off is distinct from this as it follows the characteristic drainage patterns down from the foothills.

“Interferometric coherence seems to provide an effective means for monitoring these two major sources of risk to the integrity of the markings,” Woodhouse concluded. “We are developing the technique to include more sensors and data of higher spatial resolution, so as to encourage the establishment of a long term and frequent monitoring programme supporting conservation efforts in the area.”

Original Source: ESA News Release

Valentine’s Day Greeting from Envisat

Image credit: ESA
Especially for Valentine’s Day, Envisat picks out a heart from the arid landscape of Africa’s Sahara.

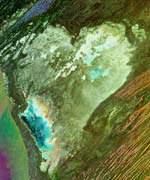
This is a multi-temporal Advanced Synthetic Aperture Radar (ASAR) image of the central coast of Mauritania in West Africa, perched on the edge of the Sahara Desert.

The heart-shaped image seen at the centre of the picture is actually a land feature called the Sebkha Te-n-Dghamcha ? a large depression covering an area about 70 by 50 km across. ‘Sebkha’ is the Arabic for dry lake, and it was indeed once covered by water ? the area’s lowest point is more than three metres below sea level.

Most of the water evaporated, leaving behind layers of salt and other minerals including gypsum ? today supporting a thriving mining industry. What remains are shallow ponds of salty water, visible in the image.

While optical images are based on reflected light, radar images like this one show surface roughness, recording how radar pulses were scattered back from the ground towards a space-based detector.

Radar images are ordinarily in black and white. The colours come from combining three different image acquisitions into a single multi-temporal image, useful for highlighting changes occurring over time.

The first acquisition was on 23 November 2002, matching to red; the second on 23 March 2003, corresponding to green; and the last on 24 April 2003, shown as blue. The areas of whiteness in the final image represent areas of high surface reflectivity unchanged between acquisitions.

The saltpan surface of Sebkha Te-n-Dghamcha returns more radar backscatter than surrounding rock and desert sand. In the same way, the roofs and walls of Mauritania’s capital city Nouakchott reflect radar well, and so show up as the white area on the coast at the base of the image.

The different amounts of colours from each acquisition combine in the final image to form other hues that can be interpreted by experienced image processors ? for example, the magenta tint of the Atlantic Ocean shows it was at its calmest during the March acquisition.

Original Source: ESA News Release

Cities on Fertile Land Affect Climate

Image credit: NASA
While cities provide vital habitat for human beings to thrive, it appears U.S. cities have been built on the most fertile soils, lessening contributions of these lands to Earth’s food web and human agriculture, according to a study by NASA researchers and others.

Though cities account for just 3 percent of continental U.S. land area, the food and fiber that could be grown there rivals current production on all U.S. agricultural lands, which cover 29 percent of the country. Marc Imhoff, NASA researcher and lead author of a current paper, and co-author Lahouari Bounoua, of NASA and University of Maryland, College Park, added that throughout history humans have settled in areas with the best lands for growing food.

“Urbanization follows agriculture — it’s a natural and important human process,” said Imhoff.Throughout history, highly productive agricultural land brought food, wealth and trade to an area, all of which fostered settlements.

“Urbanization is not a bad thing. It’s a very useful way for societies to get together and share resources,” said Bounoua. “But it would be better if it were planned in conjunction with other environmental factors.” Studies like this one, which appears in the current issue of Remote Sensing of Environment, may lead to smarter urban-growth strategies in the future.

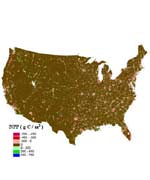
The researchers used two satellites offering a combination of daytime and nighttime Earth observation data and a biophysical computer model to derive estimates of annual Net Primary Productivity (NPP). NPP measures plant growth by describing the rate at which plants use carbon from the atmosphere to build new organic matter through photosynthesis. NPP fuels Earth’s complex food web and quantifies amounts of carbon dioxide, a greenhouse gas, which plants remove from the atmosphere.

Nighttime-lights data from the Defense Meteorological Satellite Program and a vegetation-classification map created at NASA’s Goddard Institute of Space Studies, New York, were used to portray urban, peripheral and non-urban areas across the United States. In this way, the researchers calculated the extent and locations of U.S. urban and agricultural land.

In addition, observations from the Advanced Very High Resolution Radiometer instrument, aboard the National Oceanic and Atmospheric Administration’s polar orbiting satellites, were used to calculate the Normalized Difference Vegetation Index. This index is a measure of plant health, based on the principle that plants absorb solar radiation in the red part of the spectrum of sunlight used for photosynthesis during plant growth. These data were then entered into a Stanford University computer model to derive NPP.

The computer model created a potential pre-urban American landscape, which was used to compare and estimate the reduction of NPP due to current urban-land transformation.

For the continental United States, when compared to the pre- urban landscape, modern cities account for a 1.6 percent annual decline in NPP. This loss offsets the gain in NPP of 1.8 percent annually from increased farmlands. The result is striking, given the small area that cities cover, relative to agricultural areas.

A reduction of this magnitude has vastly unknown consequences for biological diversity, but it translates to less available energy for the species that make up Earth’s complex food web. The loss of highly fertile lands for farming also puts pressure on other means to meet the food and fiber needs of an increasing population. On the local scale, urbanization can increase NPP, but only where natural resources are limited. It brings water to arid areas, and “urban heat islands” extend the growing season around the urban fringe in cold regions. These benefits, however, do not offset the overall negative impact of urbanization on NPP.

NASA scientists developed the city lights map, and the U.S. Geological Survey used a technique to create the Normalized Difference Vegetation Index data. Research partners include the University of Maryland’s Earth System Science Interdisciplinary Center, the World Wildlife Fund, and the Center for Conservation Biology at Stanford University.

Original Source: NASA News Release
Satellites Could Help Predict Landslides

Image credit: ESA
As winter rains come, thousands of square kilometres of territory across Europe’s heart face a looming threat: steep slopes and waterlogged soils combine to trigger landslides.

A build-up of groundwater within a slope increases its weight and decreases its cohesiveness, weakening the slope’s ability to resist the remorseless pull of gravity. The heavy earth flows downward. For all in the path of a landslide the results are devastating, and frequently lethal.

“In Italy, landslides have claimed an average of 54 victims per year during the last half century,” says Nicola Casagli of Italy’s National Group for Hydro-geological Disaster Prevention (GNDCI),a research network working with Italy’s Civil Protection Department.

“The extreme rainfall of our climate, our mountainous geography and recent uncontrolled urbanisation of unstable land makes us one of the countries most affected by landslide hazards. The total cost of direct damage done by Italian landslides is estimated at between one and two thousand million Euro per year.”

Very gradual ground shifts are known to precede more major landslides. Often these are on a scale of millimetres ? too slight to even be noticed by local observers, but enough to be detected via satellite using a powerful technique called radar interferometry.

It involves mathematically combining multiple radar images of the same site – acquired using instruments such as the Synthetic Aperture Radar (SAR) aboard ESA’s ERS spacecraft – in such a way that tiny changes in the landscape occurring between images are highlighted.

This technique is the basis of a new project called Service for Landslide Monitoring (SLAM), enabling landslide susceptibility mapping across parts of Italy and Switzerland, two of the European countries most under threat. GNDCI is one of three national-level users working with SLAM, along with Italy’s Ministry of the Environment and Switzerland’s Federal Office for Water and Geology (FOWG).

“Surface movements assessed over wide areas are one of the best indicators of landslide activity, and can be employed for risk forecasting,” added Casagli. “Extremely slow movements usually occur for several weeks or months before a sudden collapse.”

Trial services are being provided across Italy’s Arno river basin as well as a section of the Campania region. In Switzerland the service covers the eastern Valais and Berne cantons.

“Our interest is to have a tool evaluate landslides and mass displacements all across the Swiss Alps,” explains Hugo Raetzo of FOWG. “About 8% of Swiss territory is vulnerable to landslides, making up thousands of square kilometres. The annual landslide frequency varies with the weather ? heavy rainfall can potentially re-accelerate existing landslides.”

Three different service products are available: a large-scale Landslide Motion Survey identifying areas affected by landslides across an entire river basin, a reduced-scale Landslide Displacement Monitoring measuring ground deformation over particular sites of interest, and Landslide Susceptibility Mapping which merges the previous data products with thematic maps of land use, slope, geomorphology and other relevant parameters to provide geological hazard maps.

More than a decade’s worth of ERS data archives are being exploited to derive SLAM products. These products disclose new and essential information to the institutions charged with landslide risk and hazard management. Benefits from the service include the identification and characterisation of displacements both known and previously unknown and the verification of remedial interventions performed in the past to stabilise particular landslides.

The SLAM service is being formally implemented in February and will run until the end of this year. It is entirely funded as part of ESA’s Data User Programme and is carried out by an international consortium led by Planetek Italia with five other partners: Tele-Rilevamento Europa, Gamma Remote Sensing, Spacebel, Geotest and Florence University.

Original Source: ESA News Release

Ocean Patterns Dictate Dry and Wet Periods

Image credit: NASA/JPL
The cooler and drier conditions in Southern California over the last few years appear to be a direct result of a long-term ocean pattern known as the Pacific Decadal Oscillation, according to research presented recently at the 2004 meeting of the American Meteorological Society.

The study by Steve LaDochy, associate professor of geography at California State University, Los Angeles; Dr. Bill Patzert, research oceanographer at NASA’s Jet Propulsion Laboratory in Pasadena, Calif.; and others, suggests Pacific oceanic and atmospheric measurements can be used to forecast seasonal West Coast temperatures and precipitation up to a year in advance, from Seattle to San Diego.

An important climate controller, the Pacific Decadal Oscillation is a basin-wide oceanic pattern similar to El Ni?o and La Ni?a but much larger. The pattern lasts many decades rather than just a few months like El Ni?o and La Ni?a. The climatic fingerprints of the pattern are most visible in the North Pacific and North America, with secondary influences coming from the tropics. The long-term nature of the pattern makes it useful for forecasting, as its effects persist for so long.

Since mid-1992, NASA has been able to provide space-based, synoptic views of the entire Pacific Ocean and its shifts in heat content through the Topex/Poseidon mission and its follow-up mission, Jason (which began in 2001). Before these satellites were available, monitoring oceanic climate signals in near-real time was virtually impossible.

The remarkable data and images can tag and monitor the shifts in short-term climate events, like El Ni?o and La Ni?a, and long-term events such as the Pacific Decadal Oscillation. These data provide a 13-year continuous, complete time-series of two major El Ni?os and two La Ni?as, and have made it possible to detect a major phase shift of the Pacific Decadal Oscillation. Patzert and LaDochy show that these data, when combined with longer-term studies of land-based data, provide a powerful set of forecasting tools.

The pattern shifted to a negative, cool phase, leading to wetter conditions in the U.S. Pacific Northwest, and drier than normal conditions in Central and Southern California this decade. Since the last El Nino in 1997-1998, the Los Angeles area has had only 79 percent of its normal rainfall, Patzert said. Lake Mead, the great fresh-water reservoir in southeast Nevada, is at less than 50 percent of normal capacity. Also, huge West Coast fires over the past few years have been greatly exacerbated by drought induced by the pattern, Patzert added.

“These shifts in the pattern are long-term tendencies, which actually have a bigger economic impact than El Ni?o,” said Patzert. “People talk about floods from El Ni?o, but what really has a harsh and costly impact is a five-year drought.”

“A full cycle of the Pacific Decadal Oscillation (cool to warm and back to cool) runs about 50 years,” said LaDochy. “Over the next several years there is going to be a tendency toward dry and colder temperatures in the southern U.S. West Coast. It is very difficult to forecast day-to-day here on the West Coast, but we can say with some confidence that over the next five years, we’d better start saving water.”

The researchers used more than 50 years of U.S. climatic information, and Pacific atmospheric and oceanic data from the National Oceanic and Atmospheric Administration?s National Centers for Environmental Prediction. By comparing data, they saw strong correlations between Pacific climate patterns, temperatures and precipitation trends on the West Coast. They then were able to develop “hindcasts” to explain temperature and precipitation variability for West Coast regions. These decadal cycles also will be useful for explaining future regional climate variability.

NASA’s Earth Science Enterprise is dedicated to understanding the Earth as an integrated system and applying Earth System Science to improve prediction of climate, weather and natural hazards using the unique vantage point of space.

For more information and images about the research on the Internet, visit:

http://www.gsfc.nasa.gov/topstory/2004/0116westcoast.html.

JPL is managed for NASA by the California Institute of Technology in Pasadena.

Original Source: NASA/JPL News Release

New Earth Measurement Data Released

Image credit: NASA

NASA has released detailed topographical data of Europe and Asia that was gathered by the space shuttle as part of the 10-day Shuttle Radar Topography Mission (SRTM) in February 2000 that mapped 80% of the Earth’s surface. This data represents 40-percent of the data collected during the mission. North and South American data has already been made available, and the remainder should be completed by 2004. This precise 3-D mapping information is being used in many applications, including studying natural disasters, planning development, and aircraft navigation.

Marco Polo. Alexander the Great. They were some of history’s most prolific explorers, each trekking across sweeping stretches of Europe and Asia in their lifetimes. But these greats of world history had nothing on you, thanks to a new topographic data set from NASA and the National Geospatial-Intelligence Agency (NGA). You now can explore the vast reaches of most of Europe, Asia and numerous islands in the Indian and Pacific Oceans, from the comfort of home, without breaking a sweat.

Gathered in just 10 days by NASA’s Shuttle Radar Topography Mission (SRTM) in February 2000, the new digital elevation data set showcases some of Earth’s most diverse, mysterious and extreme topography. Much of it previously had been very poorly mapped due to persistent cloud cover or inaccessible terrain. The new data being released comprise more than one-third of the entire SRTM data set.

The new images are available on the JPL Planetary Photojournal at:

http://photojournal.jpl.nasa.gov/catalog/PIA03398
http://photojournal.jpl.nasa.gov/catalog/PIA03399
http://photojournal.jpl.nasa.gov/catalog/PIA04950
http://photojournal.jpl.nasa.gov/catalog/PIA04951

“People around the world will benefit from the release of the SRTM Europe and Asia topographic data sets because they greatly extend our knowledge of this immense region that also is home to most of Earth’s citizens,” said Dr. John LaBrecque, manager, Solid Earth and Natural Hazards Program, NASA Headquarters, Washington.

“The shape of Earth’s surface affects nearly every natural process and human endeavor. Precise, uniform, 3-D elevation data are needed for a wide range of applications from studying earthquakes, volcanism, floods and other natural hazards, to planning development, managing precious water resources, and insuring the safety of aircraft navigation,” LaBrecque noted.

“Releasing the Eurasia SRTM data provides geospatial data users with a remarkably consistent Earth-elevation surface. This enhances our global knowledge, provides a baseline for any future comparisons, and delivers accuracy and integrity unparalleled in any other global-elevation model of the Earth,” said NGA’s Technical Executive Roberta Lenczowski. “This SRTM data represents 40 percent of the data collected during the mission that covered roughly 80 percent of the landmass of the Earth. The cooperative effort between NASA and NGA, fusing science objectives with national security requirements, benefits all,” Lenczowski added.

The area covered in the current data-release stretches eastward from the British Isles and the Iberian Peninsula in the west, across the Alps and Carpathian Mountains, as well as the Northern European Plain, to the Ural and Caucasus Mountains bordering Asia. The Asian coverage includes a great variety of landforms, including the Tibetan Plateau, Tarim Basin, Mongolian Plateau and the mountains surrounding Lake Baikal, the world’s deepest lake. Mt. Everest in the Himalayas, at 8,848 meters (29,029 feet) is the world’s highest mountain. From India’s Deccan Plateau, to Southeast Asia, coastal China, and Korea, various landforms place constraints on land-use planning during periods of population growth. Volcanoes in the East Indies, the Philippines, Japan and the Kamchatka Peninsula form the western part of the “Ring of Fire” around the Pacific Ocean.

Previous releases from the mission covered North and South America. Forthcoming releases in 2004 will include Africa-Arabia and Australia, as well as an “islands” release for those islands not included in the continental data-releases. Together, these data-releases constitute the world’s first high-resolution, near-global elevation model. The resolution of these data for Europe and Asia is three arc seconds (1/1,200 of a degree of latitude and longitude), which is about 90 meters (295 feet).

The SRTM mission is a cooperative project of NASA, NGA and the German and Italian space agencies. NASA’s Jet Propulsion Laboratory, Pasadena, Calif., processed the data into research-quality digital elevation data. The National Geospatial-Intelligence Agency is providing additional processing to develop mapping products. The U.S. Geological Survey Earth Resources Observation Systems Data Center in Sioux Falls, S.D., provides final archiving and distribution of the SRTM data products.

Information about SRTM is available at:

http://www.jpl.nasa.gov/srtm

More information about NASA is at:

http://www.jpl.nasa.gov/srtm

Original Source: NASA News Release