Shrinking Arctic Sea Ice is Accelerating

Image credit: NASA

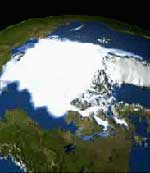
New images of shrinking sea ice may provide further evidence that the Earth is undergoing significant climate change. NASA scientists compared images of arctic sea ice since 1981 and have measured that it’s shrinking by an average of 9% per decade – summer sea ice in 2002 was a record low levels. The loss of ice could accelerate global warming because liquid water absorbs sunlight instead of reflecting it like ice.

Recently observed change in Arctic temperatures and sea ice cover may be a harbinger of global climate changes to come, according to a recent NASA study. Satellite data — the unique view from space — are allowing researchers to more clearly see Arctic changes and develop an improved understanding of the possible effect on climate worldwide.

The Arctic warming study, appearing in the November 1 issue of the American Meteorological Society’s Journal of Climate, shows that compared to the 1980s, most of the Arctic warmed significantly over the last decade, with the biggest temperature increases occurring over North America.

“The new study is unique in that, previously, similar studies made use of data from very few points scattered in various parts of the Arctic region,” said the study’s author, Dr. Josefino C. Comiso, senior research scientist at NASA’s Goddard Space Flight Center, Greenbelt, Md. “These results show the large spatial variability in the trends that only satellite data can provide.” Comiso used surface temperatures taken from satellites between 1981 and 2001 in his study.

The result has direct connections to NASA-funded studies conducted last year that found perennial, or year-round, sea ice in the Arctic is declining at a rate of nine percent per decade and that in 2002 summer sea ice was at record low levels. Early results indicate this persisted in 2003.

Researchers have suspected loss of Arctic sea ice may be caused by changing atmospheric pressure patterns over the Arctic that move sea ice around, and by warming Arctic temperatures that result from greenhouse gas buildup in the atmosphere.

Warming trends like those found in these studies could greatly affect ocean processes, which, in turn, impact Arctic and global climate, said Michael Steele, senior oceanographer at the University of Washington, Seattle. Liquid water absorbs the Sun’s energy rather than reflecting it into the atmosphere the way ice does. As the oceans warm and ice thins, more solar energy is absorbed by the water, creating positive feedbacks that lead to further melting. Such dynamics can change the temperature of ocean layers, impact ocean circulation and salinity, change marine habitats, and widen shipping lanes, Steele said.

In related NASA-funded research that observes perennial sea-ice trends, Mark C. Serreze, a scientist at the University of Colorado, Boulder, found that in 2002 the extent of Arctic summer sea ice reached the lowest level in the satellite record, suggesting this is part of a trend. “It appears that the summer 2003 — if it does not set a new record — will be very close to the levels of last year,” Serreze said. “In other words, we have not seen a recovery; we really see we are reinforcing that general downward trend.” A paper on this topic is forthcoming.

According to Comiso’s study, when compared to longer term ground-based surface temperature data, the rate of warming in the Arctic over the last 20 years is eight times the rate of warming over the last 100 years.

Comiso’s study also finds temperature trends vary by region and season. While warming is prevalent over most of the Arctic, some areas, such as Greenland, appear to be cooling. Springtimes arrived earlier and were warmer, and warmer autumns lasted longer, the study found. Most importantly, temperatures increased on average by 1.22 degrees Celsius per decade over sea ice during Arctic summer. The summer warming and lengthened melt season appears to be affecting the volume and extent of permanent sea ice. Annual trends, which were not quite as strong, ranged from a warming of 1.06 degrees Celsius over North America to a cooling of .09 degrees Celsius in Greenland.

If the high latitudes warm, and sea ice extent declines, thawing Arctic soils may release significant amounts of carbon dioxide and methane now trapped in permafrost, and slightly warmer ocean water could release frozen natural gases in the sea floor, all of which act as greenhouse gases in the atmosphere, said David Rind, a senior researcher at NASA’s Goddard Institute of Space Studies, New York. “These feedbacks are complex and we are working to understand them,” he added.

The surface temperature records covering from 1981 to 2001 were obtained through thermal infrared data from National Oceanic and Atmospheric Administration satellites. The studies were funded by NASA’s Earth Science Enterprise, which is dedicated to understanding the Earth as an integrated system and applying Earth System Science to improve prediction of climate, weather and natural hazards using the unique vantage point of space.

Original Source: NASA News Release

Glaciers in Patagonia Melting Faster Then Expected

Image credit: NASA/JPL

New research from NASA shows that glaciers in the Patagonia region of South America are thinning out at an accelerated rate. Researchers compared data from the recent space shuttle topography mission in 2000 against historical surveys from the 1970s and 90s. The Patagonia glaciers are losing mass faster than other icefields, such as those in Alaska, which are five times larger. This different rate of melting is important, because it helps researchers understand some of the factors that could contribute other than just overall global climate change.

The Patagonia Icefields of Chile and Argentina, the largest non-Antarctic ice masses in the Southern Hemisphere, are thinning at an accelerating pace and now account for nearly 10 percent of global sea-level change from mountain glaciers, according to a new study by NASA and Chile’s Centro de Estudios Cientificos.

Researchers Dr. Eric Rignot of NASA’s Jet Propulsion Laboratory, Pasadena, Calif.; Andres Rivera of Universidad de Chile, Santiago, Chile; and Dr. Gino Casassa of Centro de Estudios Cientificos, Valdivia, Chile, compared conventional topographic data from the 1970s and 1990s with data from NASA’s Shuttle Radar Topography Mission, flown in February 2000. Their objective was to measure changes over time in the volumes of the 63 largest glaciers in the region.

Results of the study, published this week in the journal Science, conclude the Patagonia Icefields lost ice at a rate equivalent to a sea level rise of 0.04 millimeters (0.0016 inches) per year during the period 1975 through 2000. This is equal to nine percent of the total annual global sea-level rise from mountain glaciers, according to the 2001 Intergovernmental Panel on Climate Change Scientific Assessment. From 1995 through 2000, however, that rate of ice loss from the icefields more than doubled, to an equivalent sea level rise of 0.1 millimeters (0.004 inches) per year.

In comparison, Alaska’s glaciers, which cover an area five times larger, account for about 30 percent of total annual global sea-level rise from mountain glaciers. So what’s causing the increased Patagonia thinning?

Rignot and his colleagues concluded the answer is climate change, as evidenced by increased air temperatures and decreased precipitation over time. Still, those factors alone are not sufficient to explain the rapid thinning. The rest of the story appears to lie primarily in the unique dynamic response of the region’s glaciers to climate change.

“The Patagonia Icefields are dominated by so-called ‘calving’ glaciers,” Rignot said. “Such glaciers spawn icebergs into the ocean or lakes and have different dynamics from glaciers that end on land and melt at their front ends. Calving glaciers are more sensitive to climate change once pushed out of equilibrium, and make this region the fastest area of glacial retreat on Earth.?

Rignot said the study underscores NASA’s unique contributions to understanding changes in Earth’s cryosphere. “From the unique vantage point of space, the Shuttle Radar Topography Mission provided the first complete topographic coverage of the Patagonia Icefields,” he explained. “Researchers can now access data on this remote Earth region in its totality, allowing them to draw conclusions about the whole system, rather than just focusing on changes on a few glaciers studied from the ground or by aircraft.?

Rignot said scientists are particularly interested in studying how climate interacts with glaciers because it may be a good barometer of how the large ice sheets of Greenland and Antarctica will respond to future climate change. “We know the Antarctic peninsula has been warming for the past four decades, with ice shelves disappearing rapidly and glaciers behind them speeding up and raising sea level,” he noted. “Our Patagonia research is providing unique insights into how these larger ice masses may evolve over time in a warmer climate,” he said.

The Northern Patagonia Icefield in Chile and the Southern Patagonia Icefield in Chile and Argentina, cover 13,000 and 4,200 square kilometers (5,019 and 1,622 square miles), respectively. The region, spanning the Andes mountain range, is sparsely inhabited, with rough terrain and poor weather, restricting ground access by scientists. Precipitation in the region ranges from 2 to 11 meters (6.6 to 36 feet) of water equivalent per year, a snow equivalent of up to 30 meters (98.4 feet) a year. The icefields discharge ice and meltwater to the ocean on the west side and to lakes on the east side, via rapidly flowing glaciers. The fronts of most of these glaciers have been retreating over the past half- century or more.

The study benefited from ground experiments led jointly by Centro de Estudios Cientificos; Universidad de Chile; University of Washington, Seattle; and University of Alaska, Fairbanks, with funding by NASA, Fondecyt (Chilean National Science Foundation) and the National Science Foundation International Program.

The Shuttle Radar Topography Mission is a cooperative project of NASA, the National Imagery and Mapping Agency, and the German and Italian space agencies. Information about the Shuttle Radar Topography Mission is available at: http://www.jpl.nasa.gov/srtm/. The California Institute of Technology in Pasadena manages JPL for NASA.

Original Source: NASA News Release

Pengiuns Get a Boost from Plankton Blooms

Image credit: NASA

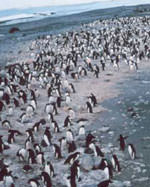
NASA satellite data has been used to analyze the biology of open area “hotspots” around the coast of Antarctica. The research has found that penguin populations are healthy when there are patches of open water nearby where plankton blooms can form in the sunlight. The plankton feeds shrimp-like krill which supports many other marine animals including penguins. The data was gathered by NASA’s Sea-viewing Wide Field-of-view Sensor (SeaWiFS) and NOAA’s Advanced Very High Resolution Radiometer (AVHRR) which kept weekly records of ocean temperature and plankton levels.

NASA satellite data was used for the first time to analyze the biology of hot spots along the coast of Antarctica. The biological oases are open waters, called polynyas, where blooming plankton support the local food chain.

The research found a strong association between the well being of Adelie Penguin populations in the Antarctic and the productivity of plankton in the polynyas. Polynyas are areas of open water or reduced ice cover, where one might expect sea ice. They are usually created by strong winds that blow ice away from the coast leaving open areas, or by gaps appearing on the ocean’s surface, when flowing ice gets blocked by an impediment, like an ice shelf.

The Antarctic waters are rich in nutrients. The lack of ice, combined with shallow coastal waters, provides the top layers of the ocean with added sunlight, so polynyas offer ideal conditions for phytoplankton blooms. Because the ice around polynyas is thin in the early spring when the long Austral day begins, they are the first areas to get strong sunlight. The open waters retain more heat, further thinning ice cover and leading to early, intense, and short-lived plankton blooms. These blooms feed krill, a tiny, shrimp-like animal, which in turn are eaten by Adelie Penguins, seabirds, seals, whales, and other animals.

Although relatively small in area, coastal polynyas play a disproportionately important role in many physical and biological processes in Polar Regions. In eastern Antarctica, more than 90 percent of all Adelie Penguin colonies live next to coastal polynyas. Polynya productivity explains, to a great extent, the increase and decrease in penguin population.

“It’s the first time anyone has ever looked comprehensively at the biology of the polynyas,” said Kevin Arrigo, assistant professor of Geophysics at Stanford University, Stanford, Calif. “No one had any idea how tightly coupled the penguin populations would be to the productivity of these polynyas. Any changes in production within these polynyas are likely to lead to dramatic changes in the populations of penguins and other large organisms,” Arrigo said.

The study, which appeared in a recent issue of the Journal of Geophysical Research, used satellite-based estimates to look at interannual changes in polynya locations and sizes; abundance of microscopic free-floating marine plants called phytoplankton, which are the base of the polar ocean food chain; and the rate at which phytoplankton populations thrive. Covering five annual cycles from 1997 to 2002, 37 coastal polynya systems were studied.

The largest polynya studied was located in the Ross Sea (396,500 square kilometers or 153,100 square miles; almost the size of California). The smallest was located in the West Lazarev Sea (1,040 square kilometers or 401.5 square miles). Most polynyas, at their maximum area in February, were less than 20,000 square kilometers (7,722 square miles).

Data from NASA’s Sea-viewing Wide Field-of-view Sensor (SeaWiFS) and NOAA’s Advanced Very High Resolution Radiometer (AVHRR) provided weekly measurements of chlorophyll and temperature that were used in a computer model to estimate phytoplankton productivity. The researchers found, taken together, the Ross Sea, Ronne Ice Shelf, Prydz Bay, and Amundsen Sea polynyas were responsible for more than 75 percent of total plankton production.

The researchers were surprised to find how closely connected the Adelie Penguins were to the productivity of their local polynyas. The more productive polynyas supported larger penguin populations. The more abundant krill fed more penguins, and the birds had shorter distances to go to forage, which reduced exposure to predators and other dangers.

The NASA Oceanography Program, the National Science Foundation, and the U.S. Department of Energy funded this research. NASA’s Earth Science Enterprise is dedicated to understanding the Earth as an integrated system and applying Earth System Science to improve prediction of climate, weather, and natural hazards using the unique vantage point of space.

Original Source: NASA News Release
Huge Iceberg Breaks Away from Antarctica

Image credit: NASA

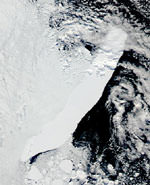
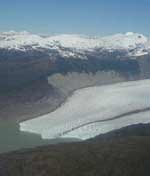
NASA satellites have been watching a gigantic iceberg as it disrupts the fragile Antarctic marine environment. The iceberg, named C-19, is 32 km wide and 200 km long; it broke off the Ross Ice Shelf back in May 2002. The problem is that the iceberg stopped winter sea ice from moving out of the Ross Sea region. Phytoplankton, which needs sunlight, was reduced by 90%, and so the rest of the ecosystem suffered too. The iceberg is being watched with NASA’s Terra and OrbView2 satellites.

NASA satellites observed the calving, or breaking off, of one of the largest icebergs ever recorded, named “C-19.”

C-19 separated from the western face of the Ross Ice Shelf in Antarctica in May 2002, splashed into the Ross Sea, and virtually eliminated a valuable food source for marine life. The event was unusual, because it was the second-largest iceberg to calve in the region in 26 months.

Over the last year, the path of C-19 inhibited the growth of minute, free-floating aquatic plants called phytoplankton during the iceberg’s temporary stopover near Pennell Bank, Antarctica. C-19 is located along the Antarctic coast and has diminished little in size. Since phytoplankton is at the base of the food chain, C-19 affects the food source of higher-level marine plants and animals.

Kevin R. Arrigo and Gert L. van Dijken of Stanford University, Stanford, Calif., used chlorophyll data from NASA’s Sea-viewing Wide Field-of-view Sensor (SeaWiFS). The instrument, on the OrbView-2 satellite, also known as SeaStar, was used to locate and quantify the effects of C-19 on phytoplankton. The researchers were able to pinpoint iceberg positions by using images from the Moderate Resolution Imaging Spectroradiometer (MODIS), an instrument aboard NASA’s Terra and Aqua satellites. The findings from this NASA-funded study appeared in a recent issue of the American Geophysical Union’s Geophysical Research Letters.

C-19 is about twice the size of Rhode Island. When it broke off the Ross Ice Shelf, the iceberg was 32 km (almost 20 miles) wide and 200 km (124 miles) long. It was not as large as the B-15 iceberg that broke off of the same ice shelf in 2001 but among the largest icebergs ever recorded.

Since it was so large, C-19 blocked sea ice from moving out of the southwestern Ross Sea region. The blockage resulted in unusually high sea-ice cover during the spring and summer. Consequently, light was blocked. Phytoplankton blooms that occur on the ocean surface were dramatically diminished, and primary production was reduced by over 90 percent, relative to normal years.

Primary production is the formation of new plant matter by microscopic plants through photosynthesis. Phytoplankton is at the base of the food chain. If they are not able to accomplish photosynthesis, all organisms above them in the food chain will be affected. “Calving events over the last two decades indicate reduced primary productivity may be a typical consequence of large icebergs that drift through the southwestern Ross Sea during spring and summer,” Arrigo said.

Arrigo and van Dijken also used imagery from the Defense Meteorological Satellite Program (DMSP) satellite Special Sensor Microwave Imager and Scanning Multichannel Microwave Radiometer, managed by the U.S. Department of Defense. The data was used to monitor the impact of C-19 on the movement of sea ice. The data is archived at the National Snow and Ice Data Center, University of Colorado, Boulder.

Arrigo said most of the face of the Ross Ice Shelf has already calved. There is another large crack, but it is very difficult to predict if and when another large iceberg will result.

NASA’s Earth Science Enterprise is dedicated to understanding the Earth as an integrated system and applying Earth System Science to improve prediction of climate, weather, and natural hazards using the unique vantage point of space.

Original Source: NASA News Release
Envisat is Watching the World’s River Levels

Image credit: ESA

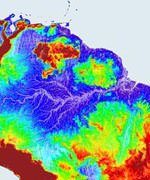
The European Space Agency’s demonstrated the capability of its Envisat Earth monitoring satellite to track the water levels of inland lakes and rivers; spots on the Earth that were previously invisible to previous radar altimetry. The Radar Altimeter 2 on board Envisat sends 1800 radar pulses a second from 800 km altitude and then calculates how long they take to return – this tells the device its exact distance to the planet. A team from pored through the raw Envisat data and figured out a way to extract river water levels by spotting specific kinds of radar echos. ESA will release 12 years of river levels for scientists to study.

For over a decade ESA has used satellites to bounce radar pulses off the Earth and precisely measure the height of ocean and land surfaces. But inland lakes and rivers have been effective blind spots for radar altimetry ? at least until now.

Next week ESA previews a new product range called River and Lake Level from Altimetry that provides previously inaccessible information on water levels of major lakes and rivers across the Earth’s surface, derived from Envisat and ERS radar altimeter measurements.

Hydrologists can use this new data to monitor river heights around the planet, assess the impact of global warming and help with water resource management. Inland water bodies are important as key sources of both water and food for the people living round them. They are also often regions of maximum biodiversity and represent early indicators of regional climate change.

A new processing algorithm has been developed to extract rivers and lakes level findings from raw radar altimeter data. The development effort was headed by Professor Philippa Berry of the UK’s De Montfort University: “The new radar altimeter product is a great leap forward for hydrologists. It gives them a new tool to study both the historical changes in water table levels and critically important data to use in forecasting models of water availability, hydroelectric power production, flood and drought events and overall climate changes.”

The Radar Altimeter 2 (RA-2) flown aboard ESA’s Envisat environmental satellite is the improved follow-on to earlier radar altimeters on the ERS-1 and ERS-2 spacecraft. From its 800 km-high polar orbit it sends 1800 separate radar pulses down to Earth per second then records how long their echoes take to return ? timing their journey down to under a nanosecond to calculate the exact distance to the planet below.

Radar altimeters were first flown in space back in the 1970s, aboard NASA’s Skylab and Seasat. These early efforts stayed focused firmly on the oceans, as less-smooth land surfaces returned indecipherable signals. But as the technology improved reliable land height data became available. Envisat’s RA-2 has an innovative ‘four-wheel drive’ tracking system allowing it to maintain radar contract even as the terrain below shifts from ocean to ice or dry land.

But rivers and lakes have proved tougher targets. Large lakes and wide rivers such as the Amazon often returned tantalising ‘wet’ radar signals, but echoes from nearby dry land distorted most such signals.

Believing full-fledged river and lake level monitoring was nevertheless feasible, ESA awarded a contract to De Montfort University to develop a suitable software product, with Lancaster University advising on field hydrology.

The De Montfort University team proceeded by painstakingly combing through many gigabytes of raw data acquired over rivers and lakes, taking note of the type of echo shapes that occurred. They sorted different echo shapes into distinct categories, then created an automated process to recognise these shapes within ‘wet’ signals and eventually extract usable data from them.

“To do this, the shape of each individual echo has to be analysed, and the exact time corresponding to the echo component from the lake or river must be calculated,” explained Professor Berry. “As well as identifying and removing the echo from surrounding land, this process is complicated by the frequent occurrence of islands and sandbars, particularly in river systems. But in the end this approach has been shown to be very effective indeed, with successful retrieval of heights from the majority of the Earth’s major river and lake systems.”

Next week sees the release of the first demonstration products using this new algorithm, containing representative data from the last seven years for rivers and lakes across Africa and South America. The plan is that global altimeter data for the last 12 years will then be reprocessed to provide hydrologists with historical information, invaluable for assessing long-term trends.

ESA also intends to install operational software in its ground segment so eventually the product can be delivered to users in near-real time, within three hours or less of its acquisition from space.

Hydrologists need no previous knowledge of radar altimetry to make use of the new data, with one product known as River Lake Hydrology providing data corresponding to river crossing points, just as though there were actual river gauges in place.

Such gauges are the traditional way that river and lake level measurements are obtained, but their number in-situ has declined sharply in the last two decades. The new product will compensate for this growing lack of ground data.

The other product is called River Lake Altimetry, intended for altimetry specialists, and provides all crossing points for a water body, together with detailed information on all instrumental and geophysical corrections.

Previews of both products can be accessed via a dedicated website (see right hand bar) or on a free CD ? email [email protected] to order a copy. Both products are being formally announced at the Hydrology from Space conference, beginning Monday 29 September in Toulouse.

Original Source: ESA news release

ESA’s View of Hurricane Isabel

Image credit: ESA

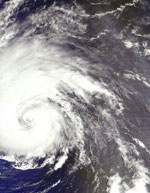
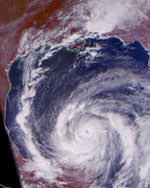
The European Space Agency is helping to track the movement of Hurricane Isabel using its ERS-2 spacecraft, and released this photo of the storm Thursday morning as it menaced the East Coast of the US. ERS-2 has also been gathering other information about the storm, including sea surface temperatures, wind and rainfall levels. Isabel is a Category 2 hurricane, and expected to make landfall in the early afternoon on Thursday in North Carolina.

As Hurricane Isabel converges on the US East Coast, a veteran ESA spacecraft has provided meteorologists with crucial insights into the underlying pressure system powering the storm.

An entire flotilla of satellites is being kept busy tracking Hurricane Isabel in visible and infrared light, as well as gathering additional measurements of local sea surface temperature, wind and rainfall levels. ESA spacecraft ERS-2 has made the picture more detailed still by discerning the wind speed and direction around the hurricane’s cloud and rain-wracked heart.

ERS-2 instruments include a C-band scatterometer, which works by sending a high-frequency radar pulse down to the ocean, then analysing the pattern of backscatter reflected back again. Scatterometers are particularly useful in measuring wind speed and direction at the sea surface, by detecting signature scatter from ripples on the water caused by wind.

ERS-2’s scatterometer is less sensitive than comparable space-based instrumentsto rain or bad weather, and can gather data both day and night. This makes it invaluable as an early detector of Atlantic storms ? especially in the current hurricane season.

The Isabel data was obtained mid-afternoon Wednesday at one of ESA?s ground stations in Gatineau Canada, then rapidly delivered to meteorology offices worldwide. At the Reading-based European Centre for Medium-Range Weather Forecasts (ECMWF), it was analysed against the surface wind pattern predicted by their existing software simulation of Isabel, run on powerful supercomputers.

“The ERS wind data is very valuable to us,” said Hans Hersbach of ECMWF. “It shows differences with our analysis, for instance a lack of inward wind flow into the centre. By assimilating the data into our analysis we improve our forecasting skills.

“The ESA scatterometer data was routinely assimilated into our analysis after 1997, until it become no longer available early this century. Now the service has been resumed we are making use of it once more.”

ESA’s ERS-2 has been in orbit since 1995, but the service from the scatterometer was interrupted in 2001. A degradation in attitude control prevented access to the data. Meteorologists lost a valuable window on the weather ? until this summer, when after two-and-a-half-years of effort, new processing software developed by the Belgian Royal Military Academy (RMA) compensated for the degradation and regained access to scatterometer measurements.

The software algorithm was installed in ground stations at Kiruna in Sweden, Maspalomas in the Canary Islands Gatineau in Canada as well as Frascati in Italy, with an additional installation planned for West Freugh in Scotland. The new service began at the end of August, just in time for Hurricane Isabel’s dramatic arrival.

To maintain future continuity of scatterometer coverage, a new more advanced scatterometer instrument called ASCAT is part of the payload for ESA?s MetOp mission, currently due to launch in 2005.

Inside a hurricane
Hurricanes are large powerful storms that rotate around a central area of extreme low pressure. They arise in warm tropical waters that transfer their heat to the air. The warmed air rises rapidly, in the process creating low pressure at the water surface. Winds begin rushing inwards and upwards around this low-pressure zone.

Currently classed at Category Two on the five-point Saffir-Simpson Hurricane scale, Isabel originated in the eastern Atlantic last week. It is currently moving northwest at only about 24 kilometres an hour but winds within it are rotating at about 160 km per hour. Meteorologists forecast the hurricane will make landfall in North Carolina on Thursday.

Original Source: ESA News Release

Astronauts Photograph Hurricane Isabel

Astronauts on board the International Space Station captured several images of Hurricane Isabel on Saturday as they flew over at an altitude of 386 kilometres. At the time, it was a category 5 storm but it has since weakened to category 2. It still packs a punch, though, and East Coast residents of the United States are preparing the for the storm’s landfall some time on Thursday.

Satellite Photo of Hurricane Isabel

Image credit: NASA

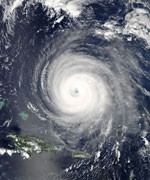
NASA’s Aqua satellite took this overhead view of Hurricane Isabel on September 14, 2003 while it was 650 km north of Puerto Rico. The image was acquired using Aqua’s Moderate Resolution Imaging Spectroradiometer (MODIS). Isabel is currently a category 4 hurricane, with winds as high as 220 km/h – this is about 15 km/h slower than they were on the weekend. Residents, businesses, and even the military are taking precautions in case Isabel doesn’t lose strength and hits the coast of the North America.

The Moderate Resolution Imaging Spectroradiometer (MODIS) instrument onboard NASA’s Aqua satellite captured this image of Hurricane Isabel September 14, 2003. In this image Hurricane Isabel is approximately 400 mi north of Puerto Rico.

*** Note: We’re tracking more satellite photos of the hurricane in the Universe Today forums. Click here to see the updates each day.

Iraq Oil Fire Seen From Space

Image credit: ESA

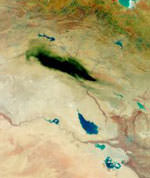
The European Space Agency’s Envisat environmental satellite captured this image of a burning oil pipeline in northern Iraq. The immense black cloud stretched over thousands of square kilometres in the valley between the Tigris and Euphrates rivers. The pipeline transfers oil from Kirkuk to Baija, and another photo from Envisat shows how the area looked before the fire.

A burning oil pipeline in northern Iraq produced an immense cloud of black smoke that stretched across thousands of square kilometres, in this image acquired by Envisat?s Medium Resolution Imaging Spectrometer.

The smoke cloud is visible in the centre of this image of the alluvial plain occupied by the valley of the river Tigris (flowing from the top centre of the image) and the Euphrates (flowing from the top left corner).

The Medium Resolution Imaging Spectrometer (MERIS) on ESA?s Envisat environmental satellite acquired the image on 30 August, the same day as the media reported a fire affecting a segment of oil pipeline near the town of Hawija.

The pipeline transports crude oil from the oil-rich city of Kirkuk ? seen here in grey, on the Tigris River – to Baija, where the country?s largest oil refinery is located. For comparison the second MERIS image shows the same area three days earlier, before the pipeline had been damaged.

The dense cloud of smoke has an extent comparable to the Iranian lake Urmia (which has an area of 4700 square kilometres), seen in turquoise colour towards the top right of the image. Authorities stated it took two days to bring the fire under control.

These three-band MERIS images have a resolution of 1200 metres and were processed by Hamburg-based Brockmann Consult.

Original Source: ESA News Release

Satellites Help Forecasters Predict Hurricanes

Image credit: NASA

Weather forecasters are turning to data from a fleet of satellites to help predict how conditions might turn into hurricanes that could ravage the coastal areas of Eastern North America. Tropical storms typically appear off the coast of Africa from June to November; some of these will turn into hurricanes depending on many factors. Satellites can now spot many of the warning signs, including a sea surface temperature of at least 27.8 degrees Celsius, rotating winds above the ocean, air temperature, humidity, and finally rainfall intensity.

Every year, from June 1 to November 30, the Atlantic Ocean becomes a meteorological mixing bowl, replete with all the needed ingredients for a hurricane recipe. Forecasters who seek to monitor and understand hurricanes are increasingly turning to a cadre of NASA satellites and instruments, including several from NASA’s Jet Propulsion Laboratory, Pasadena, Calif., that serve up a feast of information on these awesome storms.

Typically, during the peak of hurricane season, from late August to mid-September, tropical cyclones of interest to U.S. coastal regions form around the Cape Verde Islands off Africa. NASA satellites are critical for helping forecasters determine if all of the ingredients are coming together to create a hurricane. If a hurricane forms, it is critical to know how strong it may be, and which coastal communities or sea lanes will be at risk.

NASA provides researchers and forecasters with space-based observations, data assimilation and computer climate modeling. NASA-sponsored measurements and modeling of global sea surface temperature, precipitation, winds and sea surface height have also improved understanding of El Ni?o and La Ni?a events, which respectively tend to suppress and enhance Atlantic and Gulf hurricane development.

Thirty years ago, meteorologists were unable to see the factors in hurricane formation and could only spot a hurricane with still pictures from the Television Infrared Operational Satellite – Next-generation (Tiros-N) spacecraft. Over the past 10 years, visible and infrared satellite sensors were the workhorses for monitoring hurricanes. Today, multiple NASA satellites exploit everything from radar pulses to microwaves for the purpose of enhancing forecasts, providing data to researchers several times a day.

The first ingredient in the hurricane recipe is a sea surface temperature of at least 27.8 degrees Celsius (82 degrees Fahrenheit). Unlike traditional infrared satellite instruments, the Aqua satellite’s Advanced Microwave Scanning Radiometer E and the Tropical Rainfall Measuring Mission’s microwave imager can detect sea surface temperatures through clouds. This valuable information can help determine if a tropical cyclone is likely to strengthen or weaken. The joint U.S.-French Jason-1 satellite altimeter, managed by JPL, provides data on sea surface height, a key measurement of ocean energy available to encourage and sustain hurricanes.

Another necessary ingredient is rotating winds over the ocean’s surface, precursors to tropical cyclone development. The NASA-provided and JPL-built and managed SeaWinds instruments aboard Japan’s Midori 2, and NASA’s Quick Scatterometer (QuikScat) satellites can detect these winds before other instruments, providing even earlier notice of developing storms to forecasters and scientists.

Air temperature and humidity are also important factors. The JPL-managed Atmospheric Infrared Sounder experiment suite aboard the Aqua satellite obtains measurements of global temperature and humidity throughout the atmosphere. This may lead to improved weather forecasts, improved determination of cyclone intensity, location and tracks, and the severe weather associated with storms, such as damaging winds.

Rainfall intensity is the final ingredient, and the precipitation radar provided by Japan for the Tropical Rainfall Measuring Mission satellite provides computed tomography (CAT) scan-like views of rainfall in the massive thunderstorms of hurricanes. The mission’s instruments probe young tropical systems for rainfall intensity and the likelihood of storm development. The mission also sees “hot towers” or vertical columns of rapidly rising air that indicate very strong thunderstorms. These towers are like powerful pistons that convert energy from water vapor into a powerful wind- and rain-producing engine. Once a storm develops, the mission provides an inside view of how organized and tightly spiraled rain bands are, key indicators of storm intensity.

The Tropical Rainfall Measuring Mission provides tropical cyclone intensity information from the safe distance of space, allowing the National Oceanic and Atmospheric Administration’s National Hurricane Center and the Department of Defense Joint Typhoon Warning Center to turn to it, QuikScat and other NASA satellites for early assessment of storms in the open ocean.

The hurricane monitoring capabilities enabled by these satellites are funded by NASA’s Earth Science Enterprise, which is dedicated to understanding Earth as an integrated system and applying Earth system science to improve prediction of climate, weather and natural hazards using the unique vantage point of space.

Original Source: NASA/JPL News Release. Here are some hurricanes pictures.