Did Volcanoes Cause the Great Dying?

For the last three years evidence has been building that the impact of a comet or asteroid triggered the biggest mass extinction in Earth history, but new research from a team headed by a University of Washington scientist disputes that notion.

In a paper published Jan. 20 by Science Express, the online version of the journal Science, the researchers say they have found no evidence for an impact at the time of “the Great Dying” 250 million years ago. Instead, their research indicates the culprit might have been atmospheric warming because of greenhouse gases triggered by erupting volcanoes.

The extinction occurred at the boundary between the Permian and Triassic periods at a time when all land was concentrated in a supercontinent called Pangea. The Great Dying is considered the biggest catastrophe in the history of life on Earth, with 90 percent of all marine life and nearly three-quarters of land-based plant and animal life going extinct.

“The marine extinction and the land extinction appear to be simultaneous, based on the geochemical evidence we found,” said UW paleontologist Peter Ward, lead author of the paper. “Animals and plants both on land and in the sea were dying at the same time, and apparently from the same causes — too much heat and too little oxygen.”

The paper is to be published in the print edition of Science in a few weeks. Co-authors are Roger Buick and Geoffrey Garrison of the UW; Jennifer Botha and Roger Smith of the South African Museum; Joseph Kirschvink of the California Institute of Technology; Michael De Kock of Rand Afrikaans University in South Africa; and Douglas Erwin of the Smithsonian Institution.

The Karoo Basin of South Africa has provided the most intensively studied record of Permian-Triassic vertebrate fossils. In their work, the researchers were able to use chemical, biological and magnetic evidence to correlate sedimentary layers in the Karoo to similar layers in China that previous research has tied to the marine extinction at the end of the Permian period.

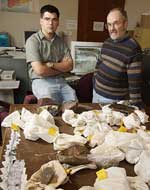
Evidence from the marine extinction is “eerily similar” to what the researchers found in the Karoo Basin, Ward said. Over seven years, they collected 126 reptile or amphibian skulls from a nearly 1,000-foot thick section of exposed Karoo sediment deposits from the time of the extinction. They found two patterns, one showing gradual extinction over about 10 million years leading up to the boundary between the Permian and Triassic periods, and the other for a sharp increase in extinction rate at the boundary that then lasted another 5 million years.

The scientists said they found nothing in the Karoo that would indicate a body such as an asteroid hit around the time of the extinction, though they looked specifically for impact clays or material ejected from a crater left by such an impact.

They contend that if there was a comet or asteroid impact, it was a minor element of the Permian extinction. Evidence from the Karoo, they said, is consistent with a mass extinction resulting from catastrophic ecosystem changes over a long time scale, not sudden changes associated with an impact.

The work, funded by the National Aeronautics and Space Administration’s Astrobiology Institute, the National Science Foundation and the National Research Foundation of South Africa, provides a glimpse of what can happen with long-term climate warming, Ward said.

In this case, there is ample evidence that the world got much warmer over a long period because of continuous volcanic eruptions in an area known as the Siberian Traps. As volcanism warmed the planet, large stores of methane gas frozen on the ocean floor might have been released to trigger runaway greenhouse warming, Ward said. But evidence suggests that species began dying out gradually as the planet warmed until conditions reached a critical threshold beyond which most species could not survive.

“It appears that atmospheric oxygen levels were dropping at this point also,” he said. “If that’s true, then high and intermediate elevations would have become uninhabitable. More than half the world would have been unlivable, life could only exist at the lowest elevations.”

He noted that the normal atmospheric oxygen level is around 21 percent, but evidence indicates that at the time of the Great Dying it dropped to about 16 percent — the equivalent of trying to breathe at the top of a 14,000-foot mountain.

“I think temperatures rose to a critical point. It got hotter and hotter until it reached a critical point and everything died,” Ward said. “It was a double-whammy of warmer temperatures and low oxygen, and most life couldn’t deal with it.”

Original Source: UW News Release

Arriving This Week: The Ozone Hole

Image credit: ESA
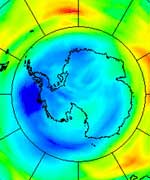
The smudges of dark blue on this Envisat-derived ozone forecast trace the start of what has unfortunately become an annual event: the opening of the ozone hole above the South Pole.

“Ever since this phenomenon was first discovered in the mid-1980s, satellites have served as an important means of monitoring it,” explained Jos? Achache, ESA Director of Earth Observation Programmes. “ESA satellites have been routinely observing stratospheric ozone concentrations for the last decade.

“And because Envisat’s observations are assimilated into atmospheric models, they actually serve as the basis of an operational ozone forecasting service. These models predict the ozone hole is in the process of opening this week.”

Envisat data show 2004’s ozone hole is appearing about two weeks later than last year’s, but at a similar time period to the average during the last decade. The precise time and range of Antarctic ozone hole occurrences are determined by regional meteorological variations.

The ozone hole typically persists until November or December, when increasing regional temperatures cause the winds surrounding the South Pole to weaken, and ozone-poor air inside the vortex is mixed with ozone-rich air outside it.

The ozone hole of 2002 was an exception to this general pattern, when a late September slowdown of the polar vortex caused the ozone hole to split in two and dissipate early. Envisat’s predecessor mission, ERS-2, monitored the process.

“Envisat carries an instrument called the Scanning Imaging Absorption Spectrometer for Atmospheric Cartography (SCIAMACHY), based on a previous instrument flown aboard ERS-2, called the Global Ozone Monitoring Experiment (GOME),” said Henk Eskes of the Royal Netherlands Meteorological Institute (KNMI). “The two instruments give us a combined data set that stretches over ten years, one that Envisat adds to every day with fresh observations.

“This data set presents a very good means of eventually identifying long-term trends in ozone. Whether or not the ozone layer is starting to recover is a hotly debated topic at the moment.”

The stratospheric ozone layer protects life on Earth from harmful ultraviolet (UV) radiation. The ozone thinning represented here is ultimately caused by the presence of man-made pollutants in the atmosphere such as chlorine, originating from man-made pollutants like chlorofluorocarbons (CFCs).

Now banned under the Montreal Protocol, CFCs were once widely used in aerosol cans and refrigerators. CFCs themselves are inert, but ultraviolet radiation high in the atmosphere breaks them down into their constituent parts, which can be highly reactive with ozone.

Just because they were banned does not mean these long-lived chemicals have vanished from the air, so scientists expect the annual South Polar ozone hole to continue to appear for many years to come.

During the southern hemisphere winter, the atmospheric mass above the Antarctic continent is kept cut off from exchanges with mid-latitude air by prevailing winds known as the polar vortex. This leads to very low temperatures, and in the cold and continuous darkness of this season, polar stratospheric clouds are formed that contain chlorine.

As the polar spring arrives, the combination of returning sunlight and the presence of polar stratospheric clouds leads to splitting of chlorine into highly ozone-reactive radicals that break ozone down into individual oxygen molecules. A single molecule of chlorine has the potential to break down thousands of molecules of ozone.

ESA’s ten-instrument Envisat spacecraft carries three instruments to measure the atmosphere; the results here come from SCIAMACHY, which provides global coverage of the distribution of ozone and other trace gases, as well as aerosols and clouds.

KNMI processes SCIAMACHY data in near-real time as the basis of an operational ozone forecasting service. This is part of a suite of atmospheric information services provided by a project called TEMIS (Tropospheric Emission Monitoring Internet Service) that also includes UV radiation monitoring and forecasting.

TEMIS is backed by ESA as part of the Agency’s Data User Programme, intended to establish viable Earth Observation-based services for communities of users.

The TEMIS atmospheric ozone forecast seen here has atmospheric ozone measured in Dobson Units (DUs), which stands for the total thickness of ozone in a given vertical column if it were concentrated into a single slab at standard temperature and atmospheric pressure ? 400 DUs is equivalent to a thickness of four millimetres, for example.

Envisat results to be revealed
Launched in March 2002, ESA’s Envisat satellite is an extremely powerful means of monitoring the state of our world and the impact of human activities upon it. Envisat carries ten sophisticated optical and radar instruments to observe and monitor the Earth’s atmosphere, land, oceans and ice caps, maintaining continuity with the Agency’s ERS missions started in 1991.

After two and a half years in orbit, more than 700 scientists from 50 countries are about to meet at a special symposium in Salzburg in Austria to review and discuss early results from the satellites, and present their own research activities based on Envisat data.

Starting next Monday, the Envisat Symposium will address almost all fields of Earth science, including atmospheric chemistry, coastal studies, radar and interferometry, winds and waves, vegetation and agriculture, landslides, natural risks, air pollution, ocean colour, oil spills and ice.

There are over 650 being presented at the Symposium, selected by peer review. Presentations will include results on the Prestige oil spill, last year’s forest fires in Portugal, the Elbe flooding in 2002, the evolution of the Antarctic ozone hole, the Bam earthquake and pollution in Europe.

Numerous demonstrations are planned during the week in the ESA Exhibit area. An industrial consortium exhibit on the joint ESA-European Commission Global Monitoring for Environment and Security (GMES) initiative is also planned.

Original Source: ESA News Release

Early Earth was Warm, Despite Less Energy From the Sun

Image credit: Stanford
If a time machine could take us back 4.6 billion years to the Earth’s birth, we’d see our sun shining 20 to 25 percent less brightly than today. Without an earthly greenhouse to trap the sun’s energy and warm the atmosphere, our world would be a spinning ball of ice. Life may never have evolved.

But life did evolve, so greenhouse gases must have been around to warm the Earth. Evidence from the geologic record indicates an abundance of the greenhouse gas carbon dioxide. Methane probably was present as well, but that greenhouse gas doesn’t leave enough of a geologic footprint to detect with certainty. Molecular oxygen wasn’t around, indicate rocks from the era, which contain iron carbonate instead of iron oxide. Stone fingerprints of flowing streams, liquid oceans and minerals formed from evaporation confirm that 3 billion years ago, Earth was warm enough for liquid water.

Now, the geologic record revealed in some of Earth’s oldest rocks is telling a surprising tale of collapse of that greenhouse — and its subsequent regeneration. But even more surprising, say the Stanford scientists who report these findings in the May 25 issue of the journal Geology, is the critical role that rocks played in the evolution of the early atmosphere.

“This is really the first time we’ve tried to put together a picture of how the early atmosphere, early climate and early continental evolution went hand in hand,” said Donald R. Lowe, a professor of geological and environmental science who wrote the paper with Michael M. Tice, a graduate student investigating early life. NASA’s Exobiology Program funded their work. “In the geologic past, climate and atmosphere were really profoundly influenced by development of continents.”

The record in the rocks
To piece together geologic clues about what the early atmosphere was like and how it evolved, Lowe, a field geologist, has spent virtually every summer since 1977 in South Africa or Western Australia collecting rocks that are, literally, older than the hills. Some of the Earth’s oldest rocks, they are about 3.2 to 3.5 billion years old.

“The further back you go, generally, the harder it is to find a faithful record, rocks that haven’t been twisted and squeezed and metamorphosed and otherwise altered,” Lowe says. “We’re looking back just about as far as the sedimentary record goes.”

After measuring and mapping rocks, Lowe brings samples back to Stanford to cut into sections so thin that their features can be revealed under a microscope. Collaborators participate in geochemical and isotopic analyses and computer modeling that further reveal the rocks’ histories.

The geologic record tells a story in which continents removed the greenhouse gas carbon dioxide from an early atmosphere that may have been as hot as 70 degrees Celsius (158 F). At this time the Earth was mostly ocean. It was too hot to have any polar ice caps. Lowe hypothesizes that rain combined with atmospheric carbon dioxide to make carbonic acid, which weathered jutting mountains of newly formed continental crust. Carbonic acid dissociated to form hydrogen ions, which found their way into the structures of weathering minerals, and bicarbonate, which was carried down rivers and streams to be deposited as limestone and other minerals in ocean sediments.

Over time, great slabs of oceanic crust were pulled down, or subducted, into the Earth’s mantle. The carbon that was locked into this crust was essentially lost, tied up for the 60 million years or so that it took the minerals to get recycled back to the surface or outgassed through volcanoes.

The hot early atmosphere probably contained methane too, Lowe says. As carbon dioxide levels fell due to weathering, at some point, levels of carbon dioxide and methane became about equal, he conjectures. This caused the methane to aerosolize into fine particles, creating a haze akin to that which today is present in the atmosphere of Saturn’s moon Titan. This “Titan Effect” occurred on Earth 2.7 to 2.8 billion years ago.

The Titan Effect removed methane from the atmosphere and the haze filtered out light; both caused further cooling, perhaps a temperature drop of 40 to 50 degrees Celsius. Eventually, about 3 billion years ago, the greenhouse just collapsed, Lowe and Tice theorize, and the Earth’s first glaciation may have occurred 2.9 billion years ago.

The rise after the fall
Here the rocks reveal an odd twist in the story — eventual regeneration of the greenhouse. Recall that 3 billion years ago, Earth was essentially Waterworld. There weren’t any plants or animals to affect the atmosphere. Even algae hadn’t evolved yet. Primitive photosynthetic microbes were around and may have played a role in the generation of methane and minor usage of carbon dioxide.

As long as rapid continental weathering continued, carbonate was deposited on the oceanic crust and subducted into what Lowe calls “a big storage facility … that kept most of the carbon dioxide out of the atmosphere.”

But as carbon dioxide was removed from the atmosphere and incorporated into rock, weathering slowed down — there was less carbonic acid to erode mountains and the mountains were becoming lower. But volcanoes were still spewing into the atmosphere large amounts of carbon from recycled oceanic crust.

“So eventually the carbon dioxide level climbs again,” Lowe says. “It may never return to its full glorious 70 degrees Centigrade level, but it probably climbed to make the Earth warm again.”

This summer, Lowe and Tice will collect samples that will allow them to determine the temperature of this time interval, about 2.6 to 2.7 billion years ago, to get a better idea of how hot Earth got.

New continents formed and weathered, again taking carbon dioxide out of the atmosphere. About 3 billion years ago, maybe 10 or 15 percent of the Earth’s present area in continental crust had formed. By 2.5 billion years ago, an enormous amount of new continental crust had formed — about 50 to 60 percent of the present area of continental crust. During this second cycle, weathering of the larger amount of rock caused even greater atmospheric cooling, spurring a profound glaciation about 2.3 to 2.4 billion years ago.

Over the past few million years we have been oscillating back and forth between glacial and interglacial epochs, Lowe says. We are in an interglacial period right now. It’s a transition — and scientists are still trying to understand the magnitude of global climate change caused by humans in recent history compared to that caused by natural processes over the ages.

“We’re disturbing the system at rates that greatly exceed those that have characterized climatic changes in the past,” Lowe said. “Nonetheless, virtually all of the experiments, virtually all of the variations and all of the climate changes that we’re trying to understand today have happened before. Nature’s done most of these experiments already. If we can analyze ancient climates, atmospheric compositions and the interplay among the crust, atmosphere, life and climate in the geologic past, we can take some first steps at understanding what is happening today and likely to happen tomorrow.”

Original Source: Stanford News Release