What is a Debris Flow?

Landslide in Guatemala

Landslides constitute one of the most destructive geological hazards in the world today. One of the main reasons for this is because of the high speeds that slides can reach, up to 160 km/hour (100 mph). Another is the fact that these slides can carry quite a bit of debris with them that serve to amplify their destructive force.

Taken together, this is what is known as a Debris Flow, a natural hazard that can take place in many parts of the world. A single flow is capable of burying entire towns and communities, covering roads, causing death and injury, destroying property and bringing all transportation to a halt. So how do we deal with them?

Definition:

A Debris Flow is basically a fast-moving landslide made up of liquefied, unconsolidated, and saturated mass that resembles flowing concrete. In this respect, they are not dissimilar from avalanches, where unconsolidated ice and snow cascades down the surface of a mountain, carrying trees and rocks with it.
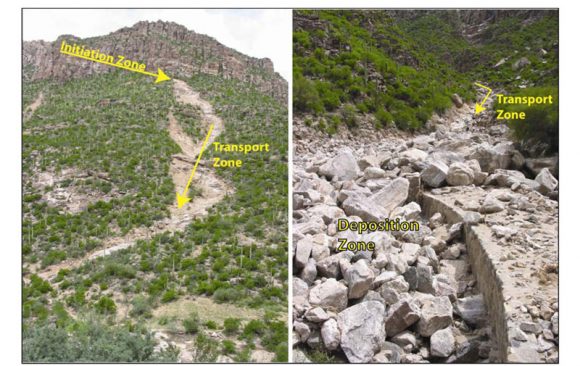
Images of a Debris Flow Chute and Deposit, taken by the Arizona Geological Survey (AZGS). Credit: azgs.com
Images of a Debris Flow Chute
and Deposit, taken by the Arizona Geological Survey (AZGS). Credit: azgs.com

A common misconception is to confuse debris flows with landslides or mudflows. In truth, they differ in that landslides are made up of a coherent block of material that slides over surfaces. Debris flows, by contrast, are made up of “loose” particles that move independently within the flow.

Similarly, mud flows are composed of mud and water, whereas debris flows are made up larger particles. All told, it has been estimated that at least 50% of the particles contained within a debris flow are made-up of sand-sized or larger particles (i.e. rocks, trees, etc).

Types of Flows:

There are two types of debris flows, known as Lahar and Jökulhlaup. The word Lahar is Indonesian in origin and has to do with flows that are related to volcanic activity. A variety of factors may trigger a lahar, including melting of glacial ice due to volcanic activity, intense rainfall on loose pyroclastic material, or the outbursting of a lake that was previously dammed by pyroclastic or glacial material.

Jökulhlaup is an Icelandic word which describes flows that originated from a glacial outburst flood. In Iceland, many such floods are triggered by sub-glacial volcanic eruptions, since Iceland sits atop the Mid-Atlantic Ridge. Elsewhere, a more common cause of jökulhlaups is the breaching of ice-dammed or moraine-dammed lakes.
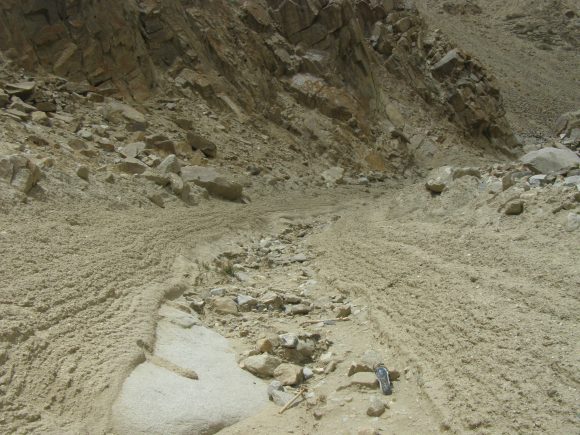
Debris flow channel in Ladakh, NW Indian Himalaya, produced in the storms of August 2010. Credit: Wikipedia Commons/DanHobley
Debris flow channel in Ladakh, near the northwestern Indian Himalaya, produced in the storms of August 2010. Credit: Wikipedia Commons/DanHobley

Such breaching events are often caused by the sudden calving of glacier ice into a lake, which then causes a displacement wave to breach a moraine or ice dam. Downvalley of the breach point, a jökulhlaup may increase greatly in size by picking up sediment and water from the valley through which it travels.

Causes of Flows:

Debris flows can be triggered in a number of ways. Typically, they result from sudden rainfall, where water begins to wash material from a slope, or when water removed material from a freshly burned stretch of land. A rapid snowmelt can also be a cause, where newly-melted snow water is channeled over a steep valley filled with debris that is loose enough to be mobilized.

In either case, the rapidly moving water cascades down the slopes and into the canyons and valleys below, picking up speed and debris as it descends the valley walls. In the valley itself, months’ worth of built-up soil and rocks can be picked up and then begin to move with the water.

As the system gradually picks up speed, a feedback loop ensues, where the faster the water flows, the more it can pick up. In time, this wall begins to resemble concrete in appearance but can move so rapidly that it can pluck boulders from the floors of the canyons and hurl them along the path of the flow. It’s the speed and enormity of these carried particulates that makes a debris flow so dangerous.
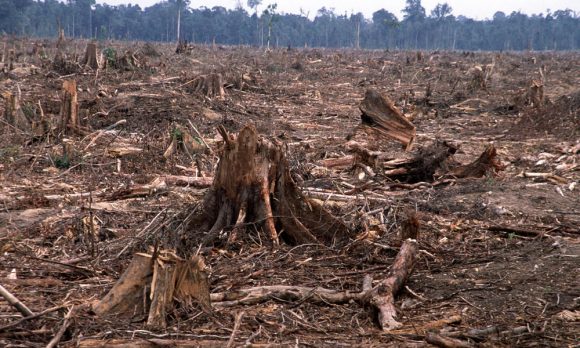
Deforestation (like this clearcut in Sumatra, Indonesia) can result in debris flows. Credit: worldwildlife.org

Another major cause of debris flows is the erosion of steams and riverbanks. As flowing water gradually causes the banks to collapse, the erosion can cut into thick deposits of saturated materials stacked up against the valley walls. This erosion removes support from the base of the slope and can trigger a sudden flow of debris.

In some cases, debris flows originate from older landslides. These can take the form of unstable masses perched atop a steep slope. After being lubricated by a flow of water over the top of the old landslide, the slide material or erosion at the base can remove support and trigger a flow.

Some debris flows occur as a result of wildfires or deforestation, where vegetation is burned or stripped from a steep slope. Prior to this, the vegetation’s roots anchored the soil and removed absorbed water. The loss of this support leads to the accumulation of moisture which can result in structural failure, followed by a flow.

Sarychev volcano, (located in Russia's Kuril Islands, northeast of Japan) in an early stage of eruption on June 12, 2009. Credit: NASA
Sarychev volcano, (located in Russia’s Kuril Islands, northeast of Japan) in an early stage of eruption on June 12, 2009. Credit: NASA

A volcanic eruption can flash melt large amounts of snow and ice on the flanks of a volcano. This sudden rush of water can pick up ash and pyroclastic debris as it flows down the steep volcano and carry them rapidly downstream for great distances.

In the 1877 eruption of Cotopaxi Volcano in Ecuador, debris flows traveled over 300 kilometers down a valley at an average speed of about 27 kilometers per hour. Debris flows are one of the deadly “surprise attacks” of volcanoes.

Prevention Methods:

Many methods have been employed for stopping or diverting debris flows in the past. A popular method is to construct debris basins, which are designed to “catch” a flow in a depressed and walled area. These are specifically intended to protect soil and water sources from contamination and prevent downstream damage.

Some basins are constructed with special overflow ducts and screens, which allow the water to trickle out from the flow while keeping the debris in place, while also allowing for more room for larger objects. However, such basins are expensive, and require considerable labor to build and maintain; hence why they are considered an option of last resort.
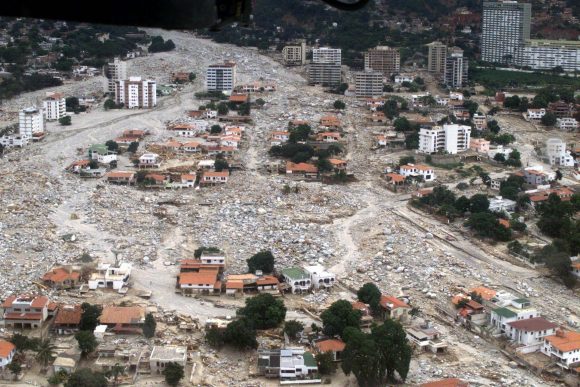
Aerial view of debris-flow deposition resulting in widespread destruction on the Caraballeda fan of the Quebrada San Julián. Credit: US Geological Survey
Aerial view of the destruction caused by a debris-flow in the Venezuelan town of Caraballeda. Credit: US Geological Survey

Currently, there is no way to monitor for the possibility of debris flow, since they can occur very rapidly and are often dependent on cycles in the weather that can be unpredictable. However, early warning systems are being developed for use in areas where debris flow risk is especially high.

One method involves early detection, where sensitive seismographs detect debris flows that have already started moving and alert local communities. Another way is to study weather patterns using radar imaging to make precipitation estimates – using rainfall intensity and duration values to establish a threshold of when and where a flows might occur.

In addition, replanting forests on hillsides to anchor the soil, as well as monitoring hilly areas that have recently suffered from wildfires is a good preventative measure. Identifying areas where debris flows have happened in the past, or where the proper conditions are present, is also a viable means of developing a debris flow mitigation plan.

We have written many articles about landslides for Universe Today. Here’s Satellites Could Predict Landslides, Recent Landslide on Mars, More Recent Landslides on Mars, Landslides and Bright Craters on Ceres Revealed in Marvelous New Images from Dawn.

If you’d like more info on debris flow, check out Visible Earth Homepage. And here’s a link to NASA’s Earth Observatory.

We’ve also recorded an episode of Astronomy Cast all about planet Earth. Listen here, Episode 51: Earth.

Sources:

What is Tornado Alley?

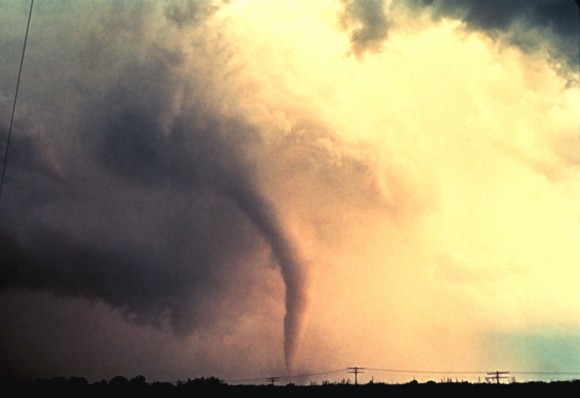
A tornado near Anadarko, Oklahoma. Credit: NSSL/NOAA

Tornadoes are a fascinating force of nature, as awe-inspiring as they are destructive. They form periodically due to the convergence of weather patterns, and often leave plenty of devastation in their wake. And for those who live in the active tornado regions of the world, they are an unfortunate fact of life.

Such is the nature of life for those who live in the infamous “Tornado Alley”, a region that extends from the southern US into parts of Canada. This area is so-named because of the frequency with which tornadoes take place. Compared to other active regions of the world, this area experiences the highest frequency of violent tornadoes.

Origin of the Name:

The term “Tornado Alley” was first used in 1952 as the title of a research project about severe weather in the US. This project was conducted by U.S. Air Force meteorologists Maj. Ernest J. Fawbush and Capt. Robert C. Miller, and covered a region extending from areas of Texas to locations throughout the mid-western US.

Tornado at Union City, Oklahoma Credit, NOAA Photo Library
Tornado at Union City, Oklahoma. Credit: NOAA Photo Library

The term has since caught on thanks to media sources as well meteorologist and climatologists, though many use the term “Great Plains Tornado Belt” as well.

Geographical Area:

The geographical boundaries of “Tornado Alley” have never been very clearly defined and no official definition has been adopted by the National Weather Service (NWS). As a result, different definitions and boundaries have been adopted based on different sets of criteria. For instance, the National Severe Storms Laboratory (NSSL) states:

“‘Tornado Alley’ is just a nickname made up by the media for an area of relatively high tornado occurrence; it is not a clearly defined area. Is tornado alley the area with the most violent tornadoes, or is it the area with the most tornado-related deaths, or the highest frequency or tornadoes? It depends on what kind of information you want!”

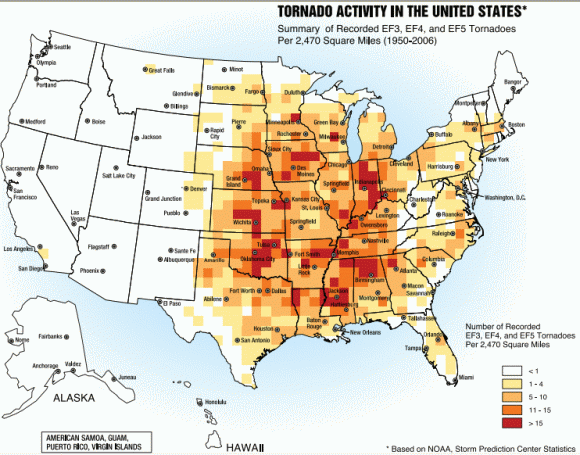
While no region of the US is entirely free of tornadoes, they occur more frequently in the mid-western US – spanning areas of Texas to parts of Oklahoma, Kansas, South Dakota, Iowa, Illinois, Missouri, New Mexico, Colorado, North Dakota, and Minnesota.

Tornado Alley
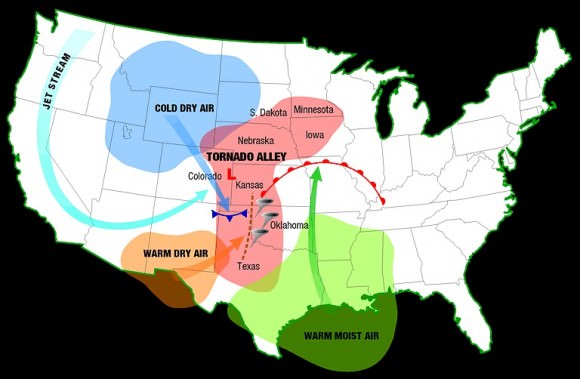
Artist’s impression of the geographical region known as “Tornado Alley”. Credit: Dan Craggs/Wikipedia Commons

Texas reports the most tornadoes of any state, whereas Kansas and Oklahoma rank first and second respectively in the number of tornadoes per area. Florida also reports a high number and density of tornado occurrences, though tornadoes there rarely reach the strength of those that sometimes occur in the southern plains.

However, the Canadian prairies, eastern Colorado and western Pennsylvania are often included in the boundaries. And last, several smaller areas have been designated as being their own “Tornado Alley” – which include the Texas/Oklahoma/Kansas core, the Upper Midwest, the lower Ohio Valley, the Tennessee Valley and the lower Mississippi valley.

There is also the term “Dixie Alley”, a name coined by Allen Peasons, a former director of the National Severe Storms Forecasting Center (NSSFC), in 1971. This name refers to the lower Mississippi Valley and upper Tennessee Valley were tornadoes occur frequently.

Nevertheless, most definitions focus on the geographical region known as the Great Plains where no major mountain ranges are located. This is important because mountains act as breaks on weather systems, forcing them to dump the majority of their moisture before crossing over them (the reason why the southwestern US has a more arid climate).

 Image from Federal Emergency Management Agency, a United States government agency, booklet FEMA 320 Third Edition, Section 1, Figure 1.1, page 3, titled Taking Shelter from the Storm: Building a Safe Room Inside your House. Credit: FEMA
Image from Federal Emergency Management Agency booklet, “Taking Shelter from the Storm: Building a Safe Room Inside your House” (3rd ed.). Credit: FEMA

In the case of the Great Plains, the region’s lack of these natural barriers leaves it open to cold fronts from Canada and warm fronts from Mexico and the Gulf Coast. When cold and warm front collide, they create supercells and thunderstorm systems that lead to tornadoes.

Impact:

Due to the frequency of tornadoes in certain areas of the United States, building codes and warning systems have been implemented. These include the institution of special building codes, construction of storm cellars, sirens, preparedness drills, education programs, and regular weather coverage by local media outlets.

According to the National Climatic Data Center, during the period of 1991 to 2010, those states that have the most experienced an average of 5.7 (Minnesota) to 12.2 (Florida) tornadoes. Using a long-term average (based on data collected between 1950 and 2012), the entire “Alley” experiences about 268 tornadoes per year.

In the southeastern United States, where housing is less robust and many people live in mobile homes, causalities are particularly high. According to the NOAA, almost 3600 tornadoes have occurred in the United States, which resulted in more than 20,000 deaths, between 1680 and 2000.

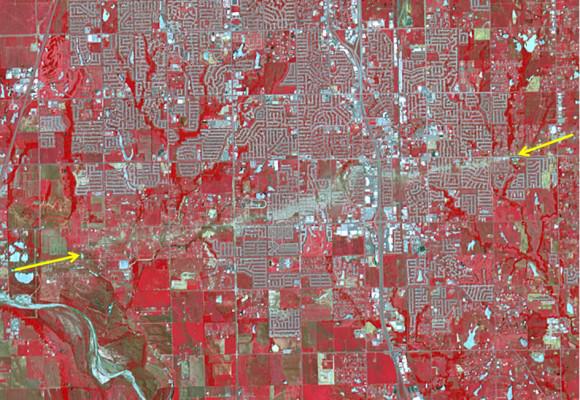
The track of the tornado that struck Moore, Oklahoma on May 20, 2013 is visible from space in this false color image taken on June 2, 2013 by the Advanced Spaceborne Thermal Emission and Reflection Radiometer (ASTER) on NASA’s Terra satellite.

Meanwhile, data from the Tornado History Project shows there were 5,587 confirmed fatalities blamed on tornadoes across the United States between 1950 and 2012. Of those, 1,110 occurred in Tornado Alley. The injuries caused by tornadoes are much higher, with a reported 64,054 injuries being attributed to tornadoes during the same period – over 15,000 of which occurred in Tornado Alley.

The worst year on record was 2011, when tornado activity spiked leading to 1,704 confirmed tornadoes and 553 confirmed deaths. This includes the 158 deaths that resulted from the tornado that struck Joplin, Missouri, on May 22nd, which was also the deadliest since modern record-keeping began in 1950.

In financial terms, the cost of tornadoes is also quite high. In fact, the Insurance Information Institute reports that between 1993 and 2012, the average insured loss per year was $7.78 billion for severe thunderstorm events, including tornadoes. In 2011, during the spike in storms, an estimated $27 billion was filed for in insurance claims.

No matter how you slice it, living in regions where tornadoes are known to frequent is both a dangerous and expensive prospect. As our understanding of tornadoes grows, we are able to predict where they will form and what paths they will take with greater accuracy. As such, we can reduce the cost in human and monetary terms over time.

Deadly Tornado Rips Across Indiana and Kentucky
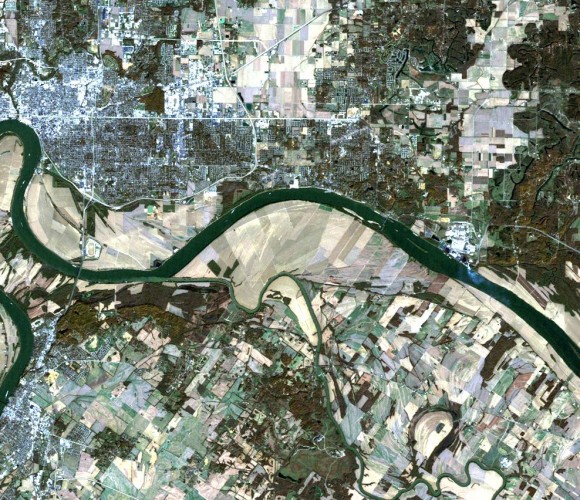
Satellite image showing the after-effects of the deadly tornado that ripped through Indiana and Kentucky. Credit: NASA Landsat Project Science Office and USGS EROS

But in the long run, the greatest safeguards against injuries and death are public awareness and education. Tornadoes are also an important aspect of Climate Change, since changes in our environment are likely to effect and exacerbate extreme weather patterns.

We have written many articles about tornadoes for Universe Today. Here’s How Do Tornadoes Form?, What was the Largest Tornado Ever Recorded?, New Gigantic Tornado Spotted on Mars, and Huge “Tornado” on the Sun.

If you’d like more info on tornado, check out the National Oceanic and Atmospheric Administration Homepage. And here’s a link to NASA’s Earth Observatory.

We’ve also recorded an episode of Astronomy Cast all about planet Earth. Listen here, Episode 51: Earth.

Sources:
What is the Difference Between Active and Dormant Volcanoes?

Volcano Vesuvius. Image credit: Pastorius

Volcanoes are an impressive force of nature. Physically, they dominate the landscape, and have an active role in shaping our planet’s geography. When they are actively erupting, they are an extremely dangerous and destructive force. But when they are passive, the soil they enrich can become very fertile, leading to settlements and cities being built nearby.

Such is the nature of volcanoes, and is the reason why we distinguish between those that are “active” and those that are “dormant”. But what exactly is the differences between the two, and how do geologists tell? This is actually a complicated question, because there’s no way to know for sure if a volcano is all done erupting, or if it’s going to become active again.

Put simply, the most popular way for classifying volcanoes comes down to the frequency of their eruption. Those that erupt regularly are called active, while those that have erupted in historical times but are now quiet are called dormant (or inactive). But in the end, knowing the difference all comes down to timing!

Sarychev volcano, (located in Russia's Kuril Islands, northeast of Japan) in an early stage of eruption on June 12, 2009. Credit: NASA
Sarychev volcano, (located in Russia’s Kuril Islands, northeast of Japan) in an early stage of eruption on June 12, 2009. Credit: NASA

Active Volcano:

Currently, there is no consensus among volcanologists about what constitutes “active”. Volcanoes – like all geological features – can have very long lifespans, varying between months to even millions of years. In the past few thousand years, many of Earth’s volcanoes have erupted many times over, but currently show no signs of impending eruption.

As such, the term “active” can mean only active in terms of human lifespans, which are entirely different from the lifespans of volcanoes. Hence why scientists often consider a volcano to be active only if it is showing signs of unrest (i.e. unusual earthquake activity or significant new gas emissions) that mean it is about to erupt.

The Smithsonian Global Volcanism Program defines a volcano as active only if it has erupted in the last 10,000 years. Another means for determining if a volcano is active comes from the International Association of Volcanology, who use historical time as a reference (i.e. recorded history).

Aleutian island #volcano letting off a little steam after the new year on Jan 2, 2016. #YearInSpace. Credit: NASA/Scott Kelly/@StationCDRKelly

By this definition, those volcanoes that have erupted in the course of human history (which includes more than 500 volcanoes) are defined as active. However, this too is problematic, since this varies from region to region – with some areas cataloging volcanoes for thousands of years, while others only have records for the past few centuries.

As such, an “active volcano” can be best described as one that’s currently in a state of regular eruptions. Maybe it’s going off right now, or had an event in the last few decades, or geologists expect it to erupt again very soon. In short, if its spewing fire or likely to again in the near future, then it’s active!

Dormant Volcano:

Meanwhile, a dormant volcano is used to refer to those that are capable of erupting, and will probably erupt again in the future, but hasn’t had an eruption for a very long time. Here too, definitions become complicated since it is difficult to distinguish between a volcano that is simply not active at present, and one that will remain inactive.

Volcanoes are often considered to be extinct if there are no written records of its activity. Nevertheless, volcanoes may remain dormant for a long period of time. For instance, the volcanoes of Yellowstone, Toba, and Vesuvius were all thought to be extinct before their historic and devastating eruptions.

The area around the Vesuvius volcano is now densely populated. Credit: Wikipedia Commons/Jeffmatt
The area around Mount Vesuvius, which erupted in 79 CE, is now densely populated. Credit: Wikipedia Commons/Jeffmatt

The same is true of the Fourpeaked Mountain eruption in Alaska in 2006. Prior to this, the volcano was thought to be extinct since it had not erupted for over 10,000 years. Compare that to Mount Grímsvötn in south-east Iceland, which erupted three times in the past 12 years (in 2011, 2008 and 2004, respectively).

And so a dormant volcano is actually part of the active volcano classification, it’s just that it’s not currently erupting.

Extinct Volcano:

Geologists also employ the category of extinct volcano to refer to volcanoes that have become cut off from their magma supply. There are many examples of extinct volcanoes around the world, many of which are found in the Hawaiian-Emperor Seamount Chain in the Pacific Ocean, or stand individually in some areas.

For example, the Shiprock volcano, which stands in Navajo Nation territory in New Mexico, is an example of a solitary extinct volcano. Edinburgh Castle, located just outside the capitol of Edinburgh, Scotland, is famously located atop an extinct volcano.

An aerial image of the Shiprock extinct volcano. Credit: Wikipedia Commons
Aerial photograph of the Shiprock extinct volcano. Credit: Wikipedia Commons

But of course, determining if a volcano is truly extinct is often difficult, since some volcanoes can have eruptive lifespans that measure into the millions of years. As such, some volcanologists refer to extinct volcanoes as inactive, and some volcanoes once thought to be extinct are now referred to as dormant.

In short, knowing if a volcano is active, dormant, or extinct is complicated and all comes down to timing. And when it comes to geological features, timing is quite difficult for us mere mortals. Individuals and generations have limited life spans, nations rise and fall, and even entire civilization sometimes bite the dust.

But volcanic formations? They can endure for millions of years! Knowing if there still life in them requires hard work, good record-keeping, and (above all) immense patience.

We have written many articles about volcanoes for Universe Today. Here’s Ten Interesting Facts About Volcanoes, What are the Different Types of Volcanoes?, How Do Volcanoes Erupt?, What is a Volcano Conduit?, and What are the Benefits of Volcanoes?

Want more resources on the Earth? Here’s a link to NASA’s Human Spaceflight page, and here’s NASA’s Visible Earth.

We have also recorded an episode of Astronomy Cast about Earth, as part of our tour through the Solar System – Episode 51: Earth.

Sources:

Newly Found Ancient Fossils Show Possibilities For Finding Martian Life

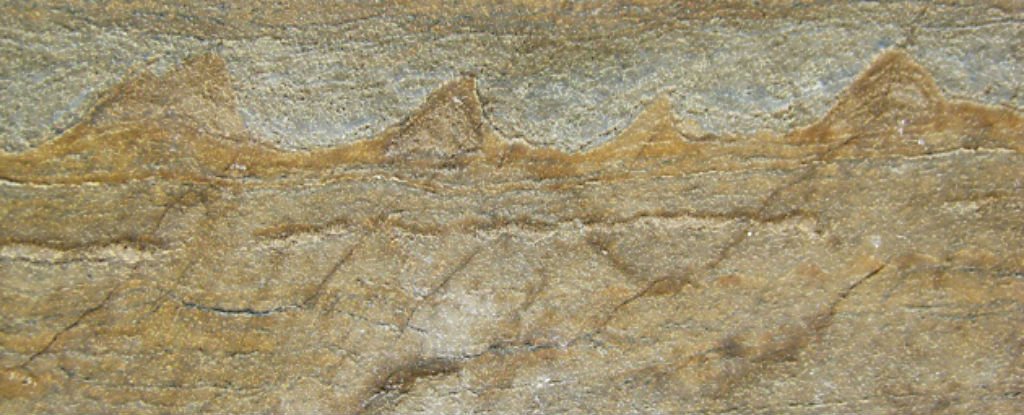
Fossilized remains found in Greenland have been dated to 3.7 billion years ago, 220 million years older than when life is believed to have emerged. Credit: A.P. Nutman et al./Nature

Fossilized remains are a fascinating thing. For paleontologists, these natural relics offer a glimpse into the past and a chance to understand what kind of lifeforms lurked there. But for astronomers, fossils are a way of ascertaining precisely when it was that life first began here on our planet – and perhaps even the Solar System.

And thanks to a team of Australian scientists, the oldest fossils to date have been uncovered. These fossilized remains have been dated to 3.7 billion years of age, and were of a community of microbes that lived on the ancient seafloor. In addition to making scientists reevaluate their theories of when life emerged on Earth, they could also tell us if there was ancient life on Mars.

The fossil find was made in what is known as the Isua Supracrustal Belt (ISB), an area in southwest Greenland that recently became accessible due to the ice melting in the area. According to the team, these fossils – basically tiny humps in rock measuring between one and four centimeters (0.4 and 1.6 inches) tall – are stromatolites, which are layers of sediment packed together by ancient, water-based bacterial colonies.

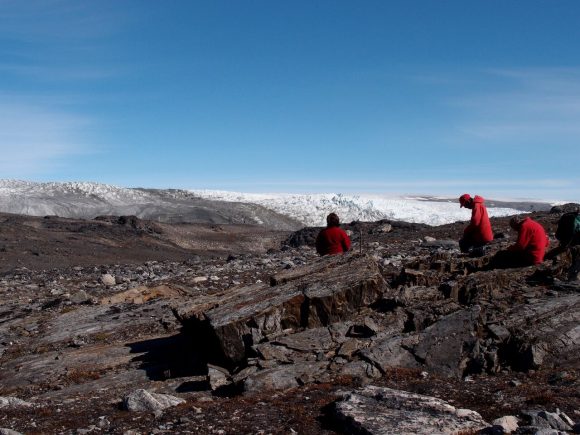
The Australian team searching for fossilized remains in the Isua supracrustal belt (ISB) in southwest Greenland. Credit: uow.edu.au

According to the team’s research paper, which appeared recently in Nature Communications, the fossilized microbes grew in a shallow marine environment, which is indicated by the seawater-like rare-earth elements and samples of sedimentary rock that were found with them.

They are also similar to colonies of microbes that can be found today, in shallow salt-water environments ranging from Bermuda to Australia. But of course, what makes this find especially interesting is just how old it is. Basically, the stone in the ISB is dated back to the early Archean Era, which took place between 4 and 3.6 billion years ago.

Based on their isotopic signatures, the team dated the fossils to 3.7 billion years of age, which makes them 220 million years older than remains that had been previously uncovered in the Pilbara Craton in north-western Australia. At the time of their discovery, those remains were widely believed to be the earliest fossil evidence of life on Earth.

As such, scientists are now reconsidering their estimates on when microbial life first emerged on planet Earth. Prior to this discovery, it was believed that Earth was a hellish environment 3.7 billion years ago. This was roughly 300 million years after the planet had finished cooling, and scientists believed it would take at least half a billion years for life to form after this point.

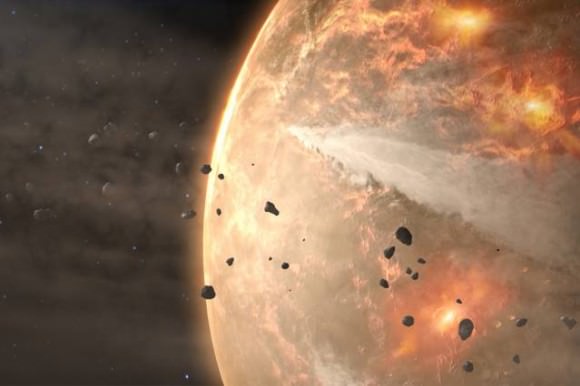
4.5 billion years ago, during the Hadean Eon, Earth was bombarded regularly by meteorites. Credit: NASA
4.5 billion years ago, during the Hadean Eon, Earth had a much different environment than it does today. Credit: NASA

But with this new evidence, it now appears that life could have emerged faster than that. As Allen P. Nutman – a professor from the University of Wallongong, Australia, and the study’s lead author – said in a university press release:

“The significance of stromatolites is that not only do they provide obvious evidence of ancient life that is visible with the naked eye, but that they are complex ecosystems. This indicates that as long as 3.7 billion years ago microbial life was already diverse. This diversity shows that life emerged within the first few hundred millions years of Earth’s existence, which is in keeping with biologists’ calculations showing the great antiquity of life’s genetic code.”

When life emerged is a major factor when it comes to Earth’s chemical cycles. Essentially, Earth’s atmosphere during the Hadean was believed to be composed of heavy concentrations of CO² atmosphere, hydrogen and water vapor, which would be toxic to most life forms today. During the following Archean era, this primordial atmosphere slowly began to be converted into a breathable mix of oxygen and nitrogen, and the protective ozone layer was formed.

The emergence of microbial life played a tremendous role in this transformation, allowing for the sequestration of CO² and the creation of oxygen gas through photosynthesis. Therefore, when it comes to Earth’s evolution, the question of when life arose and began to affect the chemical cycles of the planet has always been paramount.

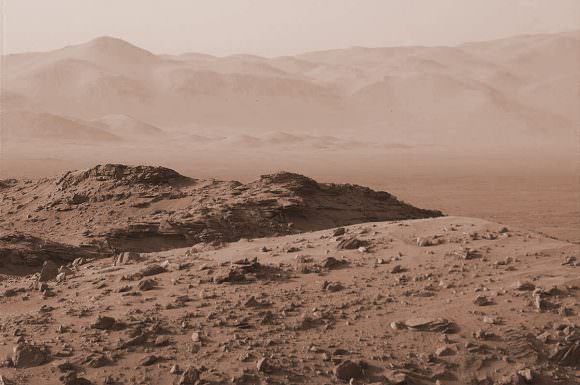
The Curiosity rover took this photo of the Martian landscape on July 12, 2016. Imagine if we could listen to it at the same time. NASA now plans to include a microphone on the upcoming Mars 2020 Mission. Credit: NASA/JPL-Caltech
Could fossilized remains of microbes be found underneath Mars’ cold, dry landscape? Credit: NASA/JPL-Caltech

“This discovery turns the study of planetary habitability on its head,” said associate Professor Bennett, one of the study’s co-authors. “Rather than speculating about potential early environments, for the first time we have rocks that we know record the conditions and environments that sustained early life. Our research will provide new insights into chemical cycles and rock-water-microbe interactions on a young planet.”

The find has also inspired some to speculation that similar life structures could be found on Mars. Thanks to the ongoing efforts of Martian rovers, landers and orbiters, scientists now know with a fair degree of certainty that roughly 3.7 billion years ago, Mars had a warmer, wetter environment.

As a result, it is possible that life on Mars had enough time to form before its atmosphere was stripped away and the waters in which the microbe would have emerged dried up. As Professor Martin Van Kranendonk, the Director of the Australian Centre for Astrobiology at UNSW and a co-author on the paper, explained:

“The structures and geochemistry from newly exposed outcrops in Greenland display all of the features used in younger rocks to argue for a biological origin. This discovery represents a new benchmark for the oldest preserved evidence of life on Earth. It points to a rapid emergence of life on Earth and supports the search for life in similarly ancient rocks on Mars.”

Another thing to keep in mind is that compared to Earth, Mars experiences far less movement in its crust. As such, any microbial life that existed on Mars roughly 3.7 billion years ago would likely be easier to find.

This is certainly good news for NASA, since one of the main objectives of their Mars 2020 rover is to find evidence of past microbial life. I for one am looking forward to seeing what it leaves for us to pickup in its cache of sample tubes!

Further Reading: Nature Communications

What is the Largest Desert on Earth?

Antarctica
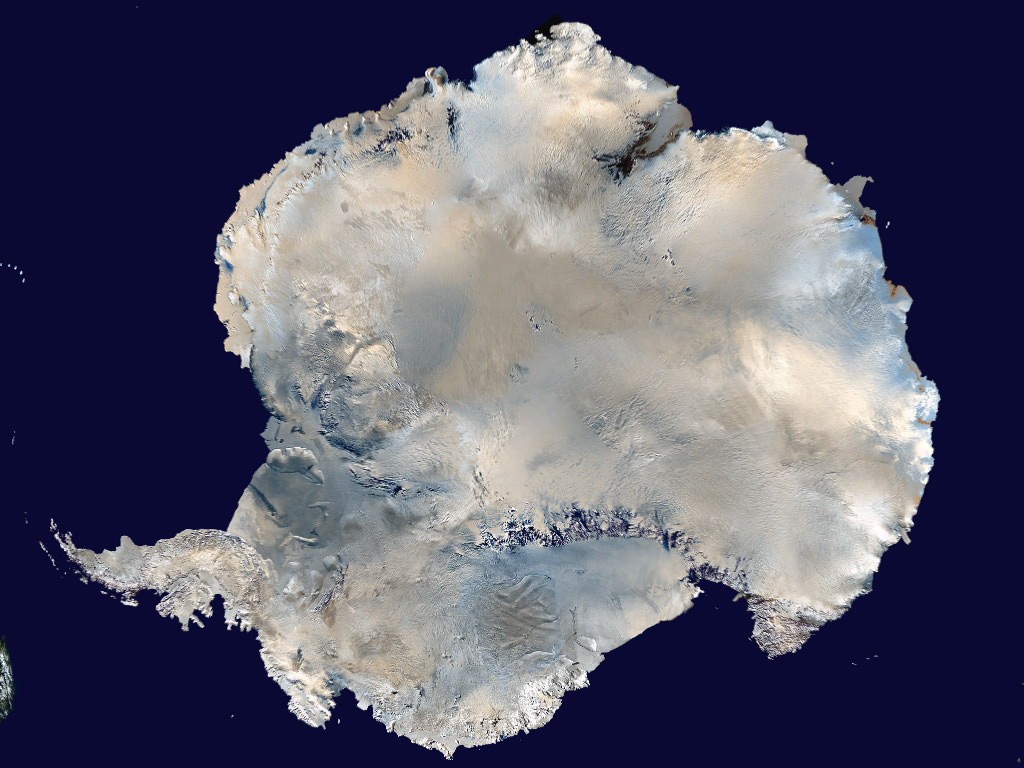
Composite satellite image of Antarctica, the location of the largest desert on Earth. Credit: NASA/Dave Pape

When you hear the word desert, what comes to mind? Chances are, you’d think of sun, sand, and very little in the way of rain. Perhaps cacti, vultures, mesas, and scorpions come to mind as well, or possibly camels and oases? But in truth, deserts come in all shapes and sizes, and vary considerably from one part of the world to the next.

Like all of Earth’s climates, it all comes down to some basic characteristics that they share – which in this case, involves being barren, dry, and hostile to life. For this reason, you might be surprised to learn that the largest desert in the world is actually in Antarctica. How’s that for a curveball?

Definition:

To break it down, a desert is a region that is simply very dry because its receives little to no water. To be considered a desert, an area must receive than 250 millimeters of annual precipitation. But precipitation can take the form of rain, snow, mist or fog – literally any form of water being transferred from the atmosphere to the earth.

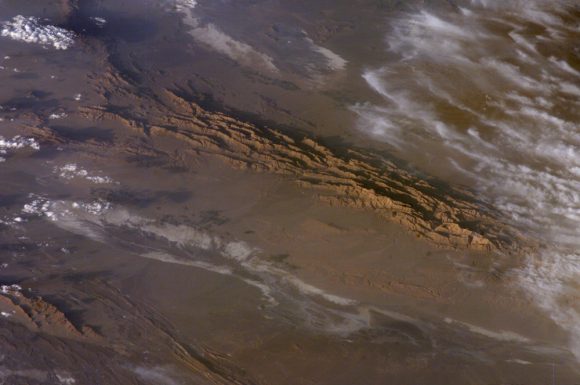
The Lut Desert of Iran, as observed from space by NASA's Earth Observatory. Credit: NASA
The Lut Desert of Iran, as observed by NASA’s Earth Observatory. It was here that the hottest temperature ever was recorded between 2003-9. Credit: NASA

Deserts can also be described as areas where more water is lost by evaporation than falls as precipitation. This certainly applies in regions that are subject to “desertification”, where increasing temperatures (i.e. climate change) result in river beds drying up, precipitation patterns changing, and vegetation dying off.

Deserts are often some of the hottest and most inhospitable places on Earth, as exemplified by the Sahara Desert in Africa, the Gobi desert in northern China and Mongolia, and Death Valley in California. But they can also be cold, windswept landscapes where little to no snow ever falls – like in the Antarctic and Arctic.

So in the end, being hot has little to do with it. In fact, it would be more accurate to say that deserts are characterized by little to no moisture and extremes in temperature. All told, deserts make up one-third of the surface of the Earth. But most of that is found in the polar regions.

Antarctica:

In terms of sheer size, the Antarctic Desert is the largest desert on Earth, measuring a total of 13.8 million square kilometers. Antarctica is the coldest, windiest, and most isolated continent on Earth, and is considered a desert because its annual precipitation can be less than 51 mm in the interior.

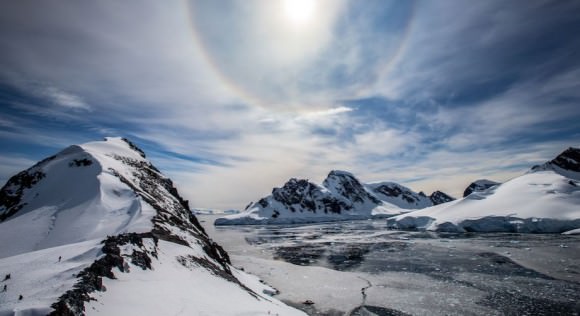
A Sun halo seen among the the landscape and ice flows of Antarctica. Credit and copyright: Alex Cornell.
A Sun halo seen among the the landscape and ice flows of Antarctica. Credit and copyright: Alex Cornell

It’s covered by a permanent ice sheet that contains 90% of the Earth’s fresh water. Only 2% of the continent isn’t covered by ice, and this land is strictly along the coasts, where all the life that is associated with the land mass (i.e. penguins, seals and various species of birds) reside. The other 98% of Antarctica is covered by ice which averages 1.6 km in thickness.

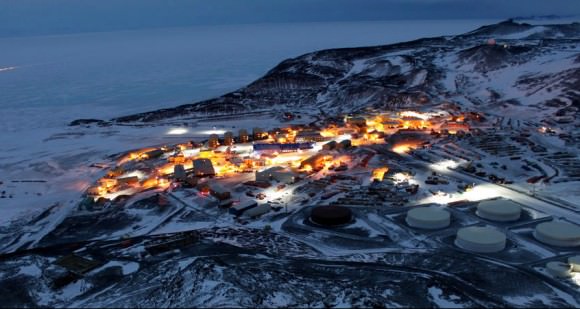
There are no permanent human residents, but anywhere from 1,000 to 5,000 researchers inhabit the research stations scattered across the continent – the largest being McMurdo Station, located on the tip of Ross Island. Beyond a limited range of mammals, only certain cold-adapted species of mites, algaes, and tundra vegetation can survive there.

Despite having very little precipitation, Antarctica still experiences massive windstorms. Much like sandstorms in the desert, the high winds pick up snow and turn into blizzards. These storms can reach speeds of up to 320 km an hour (200 mph) and are one of the reasons the continent is so cold.

In fact, the coldest temperature ever recorded was taken at the Soviet Vostok Station on the Antarctic Plateau. Using ground-based measurements, the temperature reached a historic low of -89.2°C (-129°F) on July 21st, 1983. Analysis of satellite data indicated a probable temperature of around -93.2 °C (-135.8 °F; 180.0 K), also in Antarctica, on August 10th, 2010. However, this reading was not confirmed.

McMurdo station at night. Credit: m.earthtripper.com
Antarctica’s McMurdo Station at night. Credit: m.earthtripper.com

Other Deserts:

Interestingly, the second-largest desert in the world is also notoriously cold – The Arctic Desert. Located above 75 degrees north latitude, the Arctic Desert covers a total area of about 13.7 million square km (5.29 million square mi). Here, the total amount of precipitation is below 250mm (10 inches), which is predominantly in the form of snow.

The average temperature in the Arctic Desert is -20 °C, reaching as low as -50 °C in the winter. But perhaps the most interesting aspect of the Arctic Desert is its sunshine patterns. During the summer months, the sun doesn’t set for a period of 60 days. These are then followed in the winter by a period of prolonged darkness.

The third largest desert in the world is the more familiar Sahara, with a total size of 9.4 million square km. The average annual rainfall ranges from very low (in the northern and southern fringes of the desert) to nearly non-existent over the central and the eastern part. All told, most of the Saraha receives less than 20 mm (0.79 in).

However, in northern fringe of the desert, low pressure systems from the Mediterranean Sea result in an annual rainfall of between 100 to 250 mm (3.93 – 9.84 in). The southern fringe of the desert – which extends from coastal Mauritania to the Sudan and Eritrea – receives the same amount of rainfall from the south. The central core of the desert, which is extremely arid, experiences an annual rainfall of less than 1 mm (0.04 in).

Temperatures are also quite intense in the Sahara, and can rise to more than 50 °C. Interestingly, this is not the hottest desert on the planet though. The hottest temperature ever recorded on Earth was 70.7 °C (159 °F), which was taken in the Lut Desert of Iran. These measurements were part of a global temperature survey conducted by scientists at NASA’s Earth Observatory during the summers of 2003 to 2009.

In short, deserts are not just sand dunes and places where you might come across Bedouins and Berbers, or a place you have to drive through to get to Napa Valley. They are common to every continent of the world, and can take the form of sandy deserts or icy deserts. In the end, the defining characteristic is their pronounced lack of moisture.

In that respect, the polar regions are the largest deserts in the world, with Antarctica narrowly beating out the Arctic for first place. And going by this definition – i.e. cold, arid, and with little to no precipitation – we’re sure to find some particularly big deserts elsewhere in Solar System. After all, what is Mars if not one big, cold, arid, and extremely dry climate?

We have written many articles about the Earth for Universe Today. Here is What Percent of the Earth’s Land Surface is Desert?, What is the Driest Place on Earth?, What is the Hottest Place on Earth?, What is the Earths’ Average Temperature?

Want more resources on the Earth? Here’s a link to NASA’s What is Antarctica?, and here’s NASA’s Visible Earth.

We have also recorded an episode of Astronomy Cast about Earth, as part of our tour through the Solar System – Episode 51: Earth.

Sources:
Grab Your Smartphone And Become A Citizen Scientist For NASA

NASA's new app, the Globe Observer, will allow users to collect observations of clouds, and engage in a little citizen science. Image: NASA GLOBE Observer

It’s long been humanity’s dream to do something useful with our smartphones. Sure, we can take selfies, and post pictures of our meals, but true smartphone greatness has eluded us. Until now, that is.

Thanks to NASA, we can now do some citizen science with our ubiquitous devices.

For over 20 years, and in schools in over 110 countries, NASA’s Global Learning and Observations to Benefit the Environment (GLOBE) program has helped students understand their local environment in a global context. Now NASA has released the GLOBE Observer app, which allows users to capture images of clouds in their local environment, and share them with scientists studying the Earth’s climate.

“With the launch of GLOBE Observer, the GLOBE program is expanding beyond the classroom to invite everyone to become a citizen Earth scientist,” said Holli Riebeek Kohl, NASA lead of GLOBE Observer. The app will initially be used to capture cloud observations and images because they’re such an important part of the global climate system. But eventually, GLOBE Observer will also be used to observe land cover, and to identify types of mosquito larvae.

GLOBE has two purposes. One is to collect solid scientific data, the other is to increase users’ awareness of their own environments. “Once you collect environmental observations with the app, they are sent to the GLOBE data and information system for use by scientists and students studying the Earth,” said Kohl. “You can also use these observations for your own investigations and interact with a vibrant community of individuals from around the world who care about Earth system science and our global environment.”

Clouds are a dynamic part of the Earth’s climate system. Depending on their type, their altitude, and even the size of their water droplets, they either trap heat in the atmosphere, or reflect sunlight back into space. We have satellites to observe and study clouds, but they have their limitations. An army of citizen scientists observing their local cloud population will add a lot to the efforts of the satellites.

“Clouds are one of the most important factors in understanding how climate is changing now and how it’s going to change in the future,” Kohl said. “NASA studies clouds from satellites that provide either a top view or a vertical slice of the clouds. The ground-up view from citizen scientists is valuable in validating and understanding the satellite observations. It also provides a more complete picture of clouds around the world.”

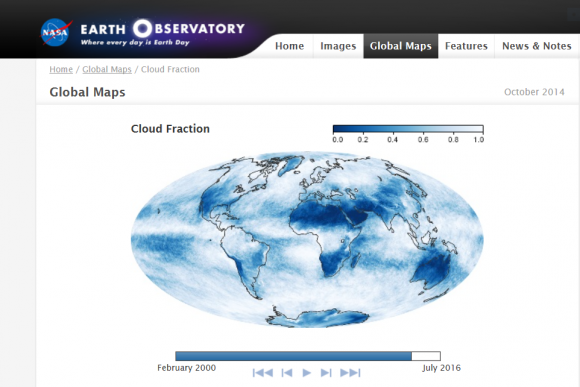
The observations collected by GLOBE users could end up as part of NASA's Earth Observatory, which tracks the cloud fraction around the world. Image: NASA/NASA Earth Observation.
The observations collected by GLOBE users could end up as part of NASA’s Earth Observatory, which tracks the cloud fraction around the world. Image: NASA/NASA Earth Observation.

The GLOBE team has issued a challenge to any interested citizen scientists who want to use the app. Over the next two weeks, the team is hoping that users will make ground observations of clouds at the same time as a cloud-observing satellite passes overhead. “We really encourage all citizen scientists to look up in the sky and take observations while the satellites are passing over through Sept. 14,” said Kohl.

The app makes this easy to do. It informs users when a satellite will be passing overhead, so we can do a quick observation at that time. We can also use Facebook or Twitter to view daily maps of the satellite’s path.

“Ground measurements are critical to validate measurements taken from space through remote sensing,” said Erika Podest, an Earth scientist at NASA’s Jet Propulsion Laboratory in Pasadena, California, who is working with GLOBE data. “There are some places in the world where we have no ground data, so citizen scientists can greatly contribute to advancing our knowledge this important part of the Earth system.”

The app itself seems pretty straightforward. I checked for upcoming satellite flyovers and was notified of 6 flyovers that day. It’s pretty quick and easy to step outside and take an observation at one of those times.

I did a quick observation from the street in front of my house and it took about 2 minutes. To identify cloud types, you just match what you see with in-app photos of the different types of clouds. Then you estimate the percentage of cloud cover, or specify if the sky is obscured by blowing snow, or fog, or something else. You can also add pictures, and the app guides you in aiming the camera properly.

The GLOBE Observer app is easy to use, and kind of fun. It’s simple enough to fit a quick cloud observation in between selfies and meal pictures.

Download it and try it out.

You can download the IOS version from the App Store, and the Android version from Google Play.

What Are The Lagrange Points?

What Are The Lagrange Points?

Being stuck here on Earth, at the bottom of this enormous gravity well really sucks. The amount of energy it takes to escape into the black would make even Captain Reynolds curse up a gorram storm.

But gravity has a funny way of evening the score, giving and taking in equal measure.

There are special places in the Universe, where the forces of gravity nicely balance out. Places that a clever and ambitious Solar System spanning civilization could use to get a toehold on the exploration of the Universe.

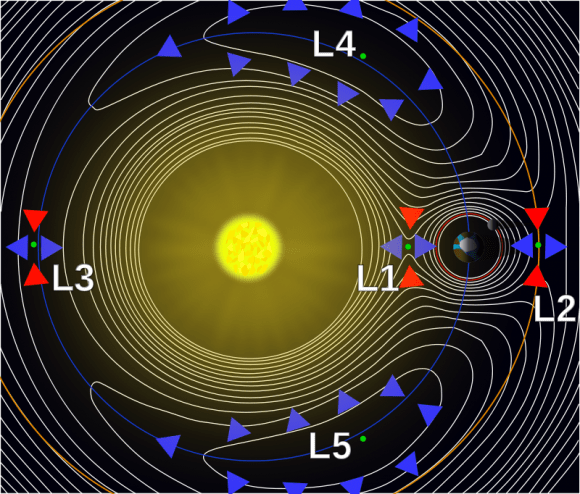
The five Sun-Earth Lagrange points. Credit: NOAA

These are known as the Lagrange Points, or Lagrangian Points, or libration points, or just L-Points. They’re named after the French mathematician Joseph-Louis Lagrange, who wrote an “Essay on the Three Body Problem” in 1772. He was actually extending the mathematics of Leonhard Euler.

Euler discovered the first three Lagrangian Points, even though they’re not named after him, and then Lagrange turned up the next two.

But what are they?

When you consider the gravitational interaction between two massive objects, like the Earth and the Sun, or the Earth and the Moon, or the Death Star and Alderaan. Actually, strike that last example…

As I was saying, when you’ve got two massive objects, their gravitational forces balance out perfectly in 5 places. In each of these 5 places you could position a relatively low mass satellite, and maintain its position with very little effort.

Sun-Earth Lagrange Points. Credit: Xander89/Wikimedia Commons

For example, you could park a space telescope or an orbital colony, and you’d need very little, or even zero energy to maintain its position.

The most famous and obvious of these is L1. This is the point that’s balanced between the gravitational pull of the two objects. For example, you could position a satellite a little above the surface of the Moon. The Earth’s gravity is pulling it towards the Moon, but the Moon’s gravity is counteracting the pull of the Earth, and the satellite doesn’t need to use much fuel to maintain position.

There’s an L1 point between the Earth and the Moon, and a different spot between the Earth and the Sun, and a different spot between the Sun and Jupiter, etc. There are L1 points everywhere.

L2 is located on the same line as the mass but on the far side. So, you’d get Sun, Earth, L2 point. At this point, you’re probably wondering why the combined gravity of the two massive objects doesn’t just pull that poor satellite down to Earth.

It’s important to think about orbital trajectories. The satellite at that L2 point will be in a higher orbit and would be expected to fall behind the Earth, as it’s moving more slowly around the Sun. But the gravitational pull of the Earth pulls it forward, helping to keep it in this stable position.

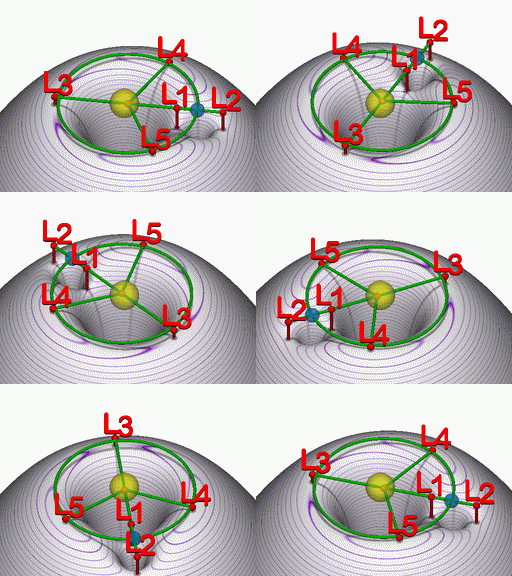
Animation showing the relationship between the five Lagrangian points (red) of a planet (blue) orbiting a star (yellow), and the gravitational potential in the plane containing the orbit (grey surface with purple contours of equal potential). Credit: cmglee (CC-SA 3.0)
Animation showing the relationship between the Lagrangian points (red) of a planet (blue) orbiting a star (yellow), and the gravitational potential in the plane containing the orbit (grey surface with purple contours of equal potential). Credit: cmglee (CC-SA 3.0)

You’ll want to play a lot of Kerbal Space Program to really wrap your head around it. Sadly, your No Man’s Sky time isn’t helping you at all, except to teach you that hyperdrives are notoriously finicky and you’ll never have enough inventory space.

L3 is located on the direct opposite side of the system. Again, the forces of gravity between the two masses balance out so that the third object maintains the same orbital velocity. For example, a satellite in the L3 point would always remain exactly hidden by the Sun.

Hold on, hold on, I know there are a million thoughts going through your brain right now, but bear with me.

There are two more points, the L4 and L5 points. These are located ahead and behind the lower mass object in orbit. You form an equilateral triangle between the two masses, and the third point of the triangle is the L4 point, flip the triangle upside down and there’s L5.

Now, it’s important to note that the first 3 Lagrange points are gravitationally unstable. Any satellite positioned there will eventually drift away from stability. So they need some kind of thrusters to maintain this position.

Imagine a tall smooth mountain, with a sharp peak. Put a bowling ball at the very top and you’re not going to need a lot of energy to keep it in that location. But the blowing wind will eventually knock it out of place, and down the mountain. That’s L1, L2 and L3, and it’s why we don’t see any natural objects located in those places.

But L4 and L5 are actually stable. It’s the opposite situation, a deep valley where a bowling ball will tend to fall down into. And we find asteroids in the natural L4 and L5 positions in the larger planets, like Jupiter. These are the Trojan asteroids, trapped in these natural gravity wells though the gravitational interaction of Jupiter and the Sun.

Artist's diagram of Jupiter and some Trojan asteroids nearby the gas giant. Credit: NASA/JPL-Caltech
Artist’s diagram of Jupiter and some Trojan asteroids nearby the gas giant. Credit: NASA/JPL-Caltech

So what can we use Lagrange points for? There are all kinds of space exploration applications, and there are already a handful of satellites in the various Earth-Sun and Earth-Moon points.

Sun-Earth L1 is a great place to station a solar telescope, where it’s a little closer to the Sun, but can always communicate with us back on Earth.

The James Webb Space Telescope is destined for Sun-Earth L2, located about 1.5 million km from Earth. From here, the bright Sun, Earth and Moon are huddled up in a tiny location in the sky, leaving the rest of the Universe free for observation.

Image: James Webb Space Telescope
NASA’s James Webb Telescope, shown in this artist’s conception, will provide more information about previously detected exoplanets. It will be at Sun-Earth L2.

Earth-Moon L1 is a perfect place to put a lunar refueling station, a place that can get to either the Earth or the Moon with minimal fuel.

Perhaps the most science fictiony idea is to put huge rotating O’Neill Cylinder space stations at the L4 and L5 points. They’d be perfectly stable in orbit, and relatively easy to get to. They’d be the perfect places to begin the colonization of the Solar System.

Thanks gravity. Thanks for interacting in all the strange ways that you do, and creating these stepping stones that we can use as we reach up and out from our planet to become a true Solar System spanning civilization.

Crackling Roar of Atlas Rocket Carries Clandestine NRO Surveillance Satellite Aloft From Cape

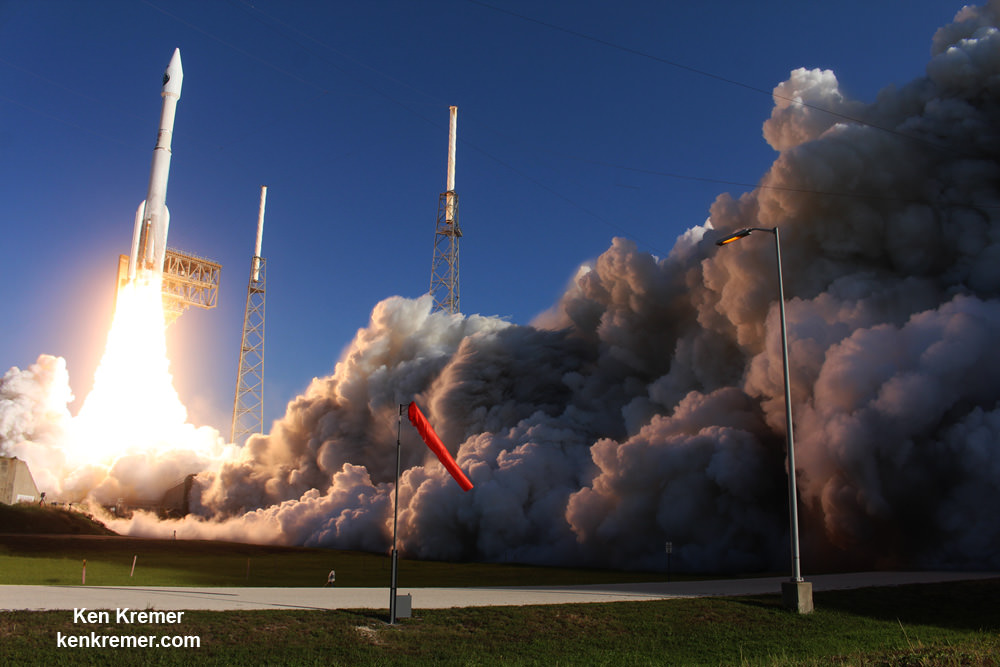
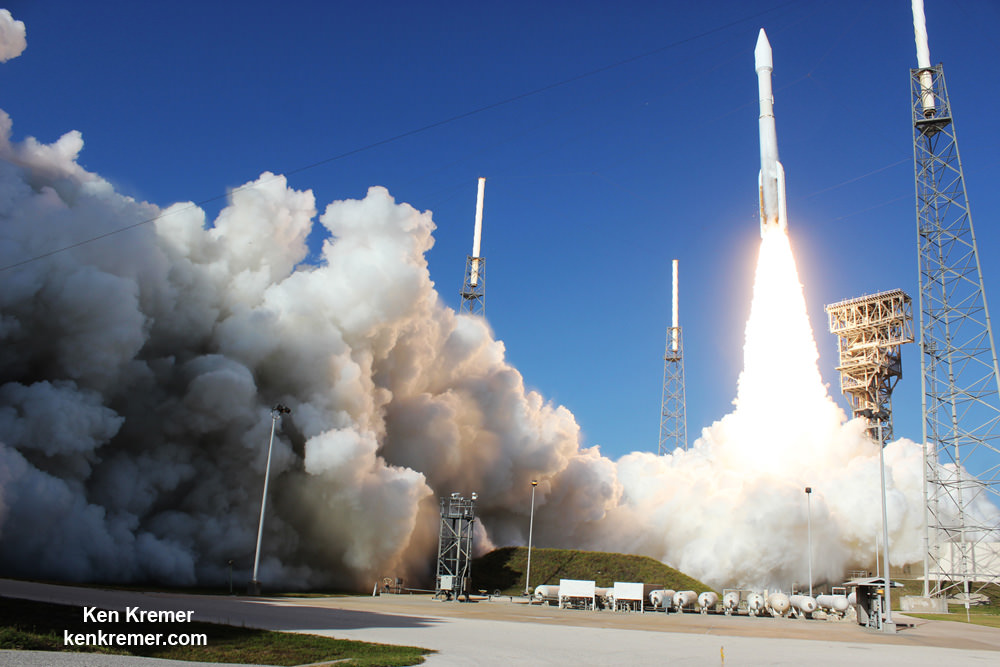
A United Launch Alliance (ULA) Atlas V rocket carrying the NROL-61 surveillance satellite for the National Reconnaissance Office (NRO) lifts off from Space Launch Complex-41 on July 28, 2016 at 8:37 a.m. EDT from Cape Canaveral Air Force Station, FL. Credit: Ken Kremer/kenkremer.com

A United Launch Alliance (ULA) Atlas V rocket carrying the NROL-61 surveillance satellite for the National Reconnaissance Office (NRO) lifts off from Space Launch Complex-41 on July 28, 2016 at 8:37 a.m. EDT. Credit: Ken Kremer/kenkremer.com
A United Launch Alliance (ULA) Atlas V rocket carrying the NROL-61 surveillance satellite for the National Reconnaissance Office (NRO) lifts off from Space Launch Complex-41 on July 28, 2016 at 8:37 a.m. EDT from Cape Canaveral Air Force Station, FL. Credit: Ken Kremer/kenkremer.com

CAPE CANAVERAL AIR FORCE STATION, FL — Riding atop the crackling roar of an Atlas V rocket, a clandestine surveillance satellite for our nation’s spy masters was carried aloft by a powerful booster from the Florida space coast to an undisclosed orbit at breakfast time today, Thursday, July 28.

The United Launch Alliance (ULA) Atlas V rocket carrying the NROL-61 surveillance satellite for the National Reconnaissance Office (NRO) lifted off from Space Launch Complex-41 right at the appointed time of 8:37 a.m. EDT this morning with approximately 1.5 million pounds of thrust.

The top secret NROL-61 satellite bolted on top and inside the 4 meter diameter nose cone was launched in support of US national defense and is vital to US national security.

“Thank you to the entire mission team for years of hard work and collaboration on today’s successful launch of NROL-61. We are proud the U.S. Air Force and NRO Office of Space Launch have entrusted ULA with delivering this critical asset for our nation’s security,” said Laura Maginnis, ULA vice president of Custom Services, in a statement.

“Our continued one launch at a time focus and exceptional teamwork make launches like today’s successful.”

A United Launch Alliance (ULA) Atlas V rocket carrying the NROL-61 surveillance satellite for the National Reconnaissance Office (NRO) lifts off from Space Launch Complex-41 on July 28, 2016 at 8:37 a.m. EDT. Credit: Ken Kremer/kenkremer.com
A United Launch Alliance (ULA) Atlas V rocket carrying the NROL-61 surveillance satellite for the National Reconnaissance Office (NRO) lifts off from Space Launch Complex-41 on July 28, 2016 at 8:37 a.m. EDT from Cape Canaveral Air Force Station, FL. Credit: Ken Kremer/kenkremer.com

The launch was webcast live by ULA and featured video recorded call in questions about spaceflight from the general public – especially children!

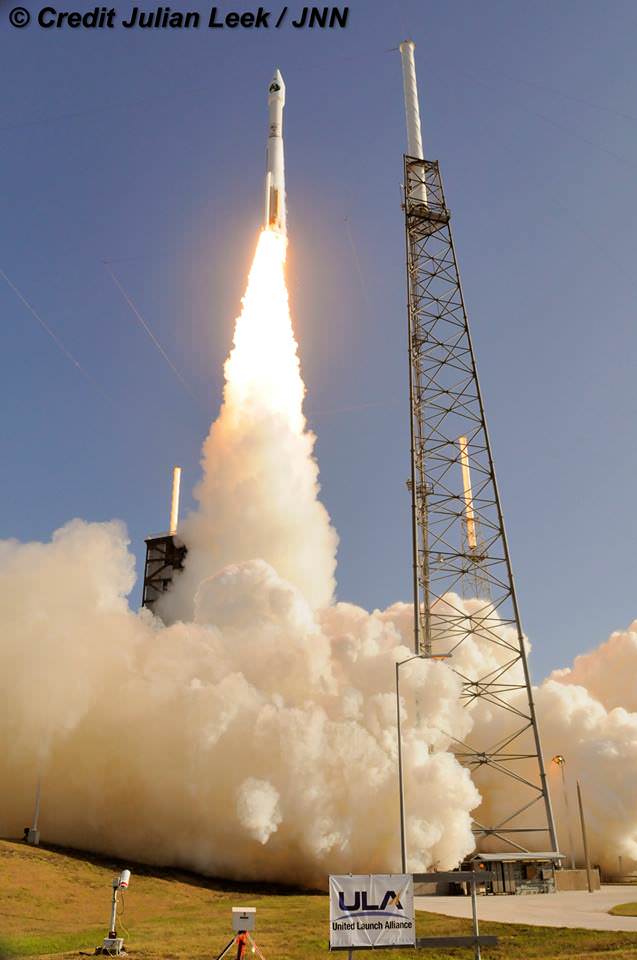
The rocket roared off pad 41 atop an ever expanding plume of smoke and ash into a brilliant and cloudless blue sky under absolutely ideal weather conditions with clear lines of sight enjoyed by hordes of spectators gathered here from near and far, and lining the space coast beaches and surrounding viewing areas.

Many local area hotels were packed with space enthusiasts hoping for a space spectacular at this unusually convenient launch time – and they were not disappointed!!

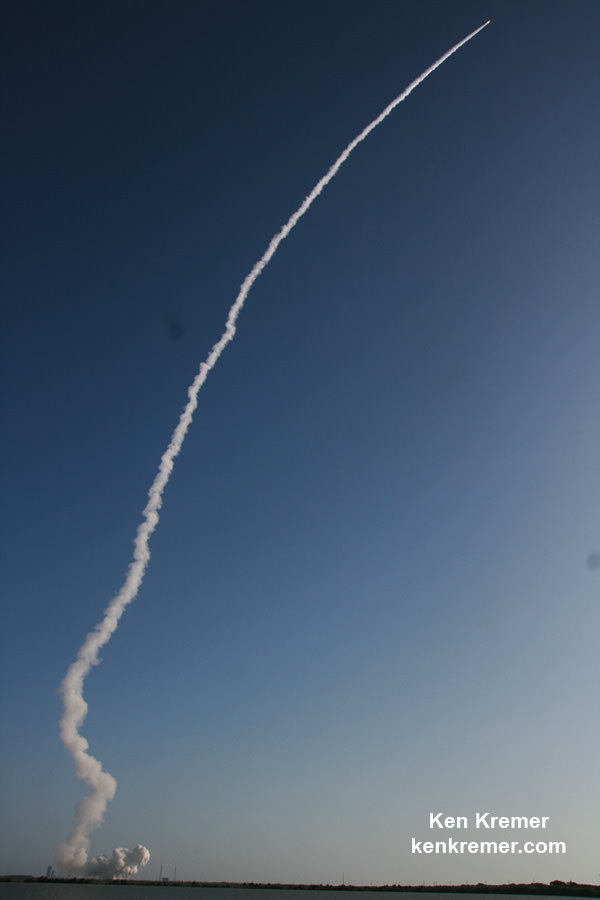
Because the Atlas rocket was equipped with a pair of powerful solid rocket boosters to augment its liftoff thrust, the smoke plume was visible for as long as we could see it.

ULA Atlas V rocket lifts off with NROL-61 spy satellite for the NRO from pad 41 on July 28, 2016 at 8:37 a.m. EDT. Credit: Julian Leek

The rocket soon arced over, racing southeasterly to orbit and towards the African continent.

Virtually everything about the clandestine payload, its mission, purpose and goals are classified top secret on a mission of vital importance to America’s national security and defense needs.

The NRO is the government agency that runs a vast fleet of powerful orbital assets hosting a multitude of the most advanced, wide ranging and top secret capabilities.

The most recent NRO payload, known as NROL 37, was just launched by ULA last month on their Delta IV Heavy – the most powerful rocket in the world on June 11 – read my story here.

The venerable ULA Atlas V rocket sports a 100% record of launch success and its unusual for technical issues to hold up a launch. The ever changeable Florida weather is another matter entirely.

The NROL-61 mission counts as ULA’s sixth launch of 2016 and the 109th overall since the company was founded in 2006.

The 20 story tall Atlas V launched in its 421 configuration – the same as what will be used for manned launches with the crewed Boeing ‘Starliner’ space taxi carrying astronaut crews to the International Space Station.
This was the sixth Atlas V to launch in the 421 configuration.

The Atlas 421 vehicle includes a 4-meter diameter Extra Extended Payload Fairing (XEPF) payload fairing and two solid rocket boosters that augment the first stage. The Atlas booster for this mission was powered by the RD AMROSS RD-180 engine and the Centaur upper stage was powered by the Aerojet Rocketdyne RL10C-1 engine.

The RD-180 burns RP-1 (Rocket Propellant-1 or highly purified kerosene) and liquid oxygen and delivers 860,200 lb of thrust at sea level.

The strap on solids deliver approximately 500,000 pounds of thrust.

The solids were jettisoned about 2 minutes after liftoff.

Virtually everything about the clandestine payload, its mission, purpose and goals are classified top secret.

The NRO is the government agency that runs a vast fleet of powerful orbital assets hosting a multitude of the most advanced, wide ranging and top secret capabilities.

The possible roles for the reconnaissance payload include signals intelligence, eavesdropping, imaging and spectroscopic observations, early missile warnings and much more.

The NRO was formed in response to the Soviet launch of Sputnik and secretly created on September 6, 1961.

“The purpose is overseeing all satellite and overflight reconnaissance projects whether overt or covert. The existence of the organization is no longer classified today, but we’re still pressing to perform the functions necessary to keep American citizens safe,” according to the official NRO website.

Atlas V rocket streaks to orbit on smoke and ash carrying NROL-61 spy satellite for the NRO  after launch on July 28, 2016 at 8:37 a.m. EDT from Cape Canaveral Air Force Station, FL.  Credit: Ken Kremer/kenkremer.com
Atlas V rocket streaks to orbit on smoke and ash carrying NROL-61 spy satellite for the NRO after launch on July 28, 2016 at 8:37 a.m. EDT from Cape Canaveral Air Force Station, FL. Credit: Ken Kremer/kenkremer.com

Watch for Ken’s continuing on site reports direct from Cape Canaveral Air Force Station, the Kennedy Space Center and the ULA Atlas launch pad.

Stay tuned here for Ken’s continuing Earth and Planetary science and human spaceflight news.

Ken Kremer

………….

Learn more about SLS and Orion crew vehicle, SpaceX CRS-9 rocket launch, ISS, ULA Atlas and Delta rockets, Juno at Jupiter, Orbital ATK Antares & Cygnus, Boeing, Space Taxis, Mars rovers, NASA missions and more at Ken’s upcoming outreach events:
July 27-28: “ULA Atlas V NRO Spysat launch July 28, SpaceX launch to ISS on CRS-9, SLS, Orion, Juno at Jupiter, ULA Delta 4 Heavy NRO spy satellite, Commercial crew, Curiosity explores Mars, Pluto and more,” Kennedy Space Center Quality Inn, Titusville, FL, evenings
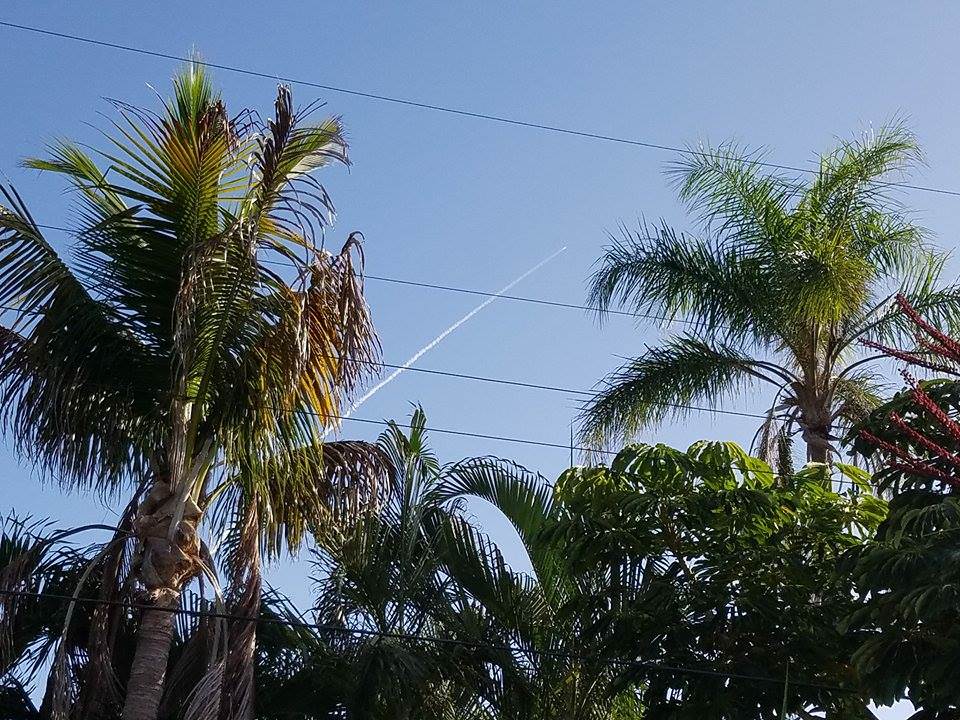
Atlas V rocket streaks to orbit carrying NROL-61 spy satellite for the NRO  on July 28, 2016 at 8:37 a.m. EDT as seen from Satellite Beach, FL.  Credit: Jillian Laudick
Atlas V rocket streaks to orbit carrying NROL-61 spy satellite for the NRO on July 28, 2016 at 8:37 a.m. EDT as seen from Satellite Beach, FL. Credit: Jillian Laudick

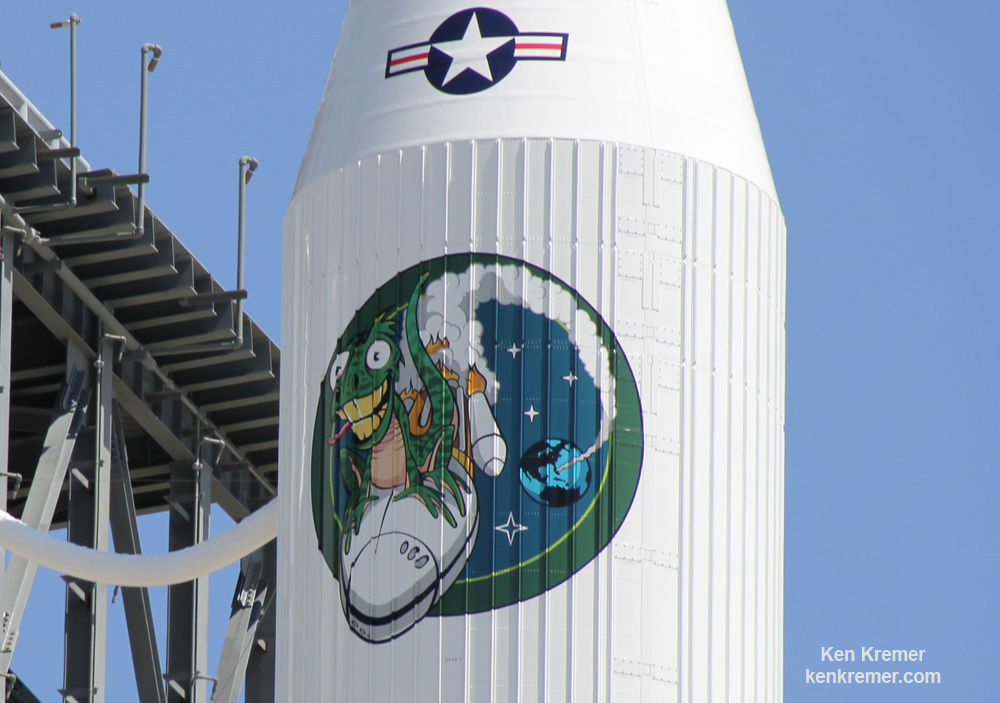
Mission artwork for Atlas V NROL-61 mission for the National Reconnaissance Office (NRO) is painted on nose cone of Atlas V rocket and depicts a green lizard, Spike, riding an Atlas V  launch vehicle.  Credit: Ken Kremer/kenkremer.com
Mission artwork for Atlas V NROL-61 mission for the National Reconnaissance Office (NRO) is painted on nose cone of Atlas V rocket and depicts a green lizard, Spike, riding an Atlas V launch vehicle. Credit: Ken Kremer/kenkremer.com

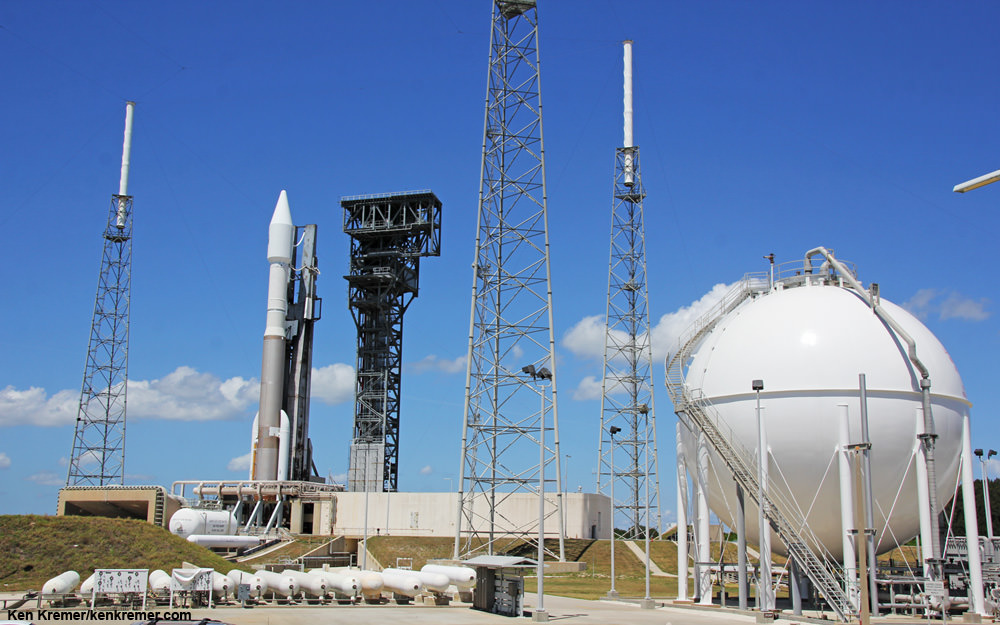
A ULA Atlas V rocket carrying the NROL-61 satellite is poised for blastoff from the pad at Space Launch Complex-41 at Cape Canaveral Air Force Station in Florida on July 28, 2016.   Credit: Ken Kremer/kenkremer.com
A ULA Atlas V rocket carrying the NROL-61 satellite is poised for blastoff from the pad at Space Launch Complex-41 at Cape Canaveral Air Force Station in Florida on July 28, 2016. Credit: Ken Kremer/kenkremer.com

The Moon Is A Real Attention Junkie

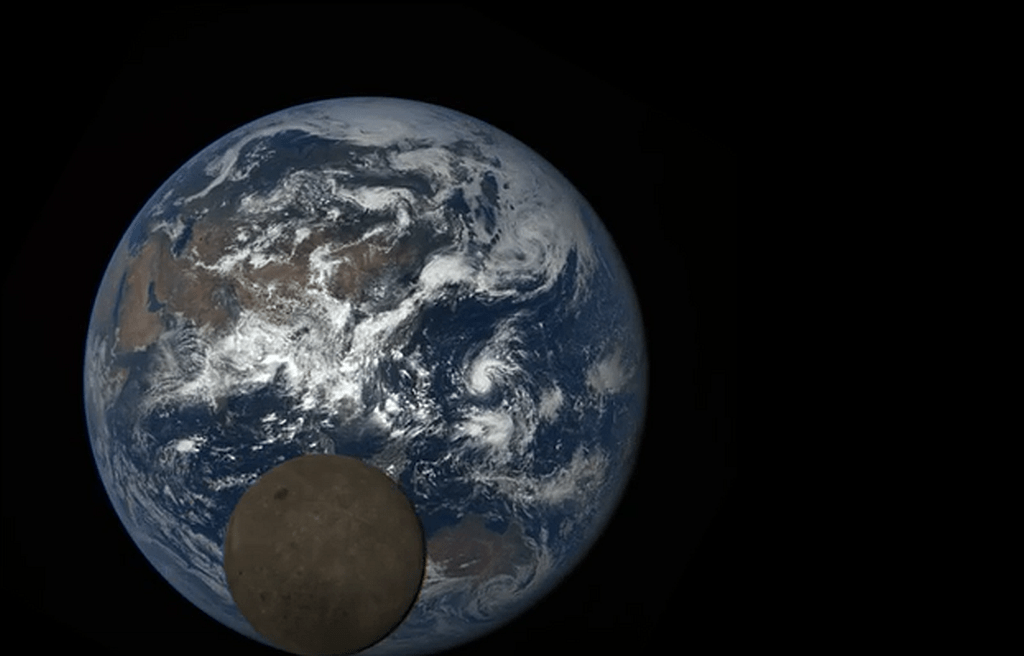
NASA's Deep Space Climate Observatory captured a series of images of the Moon passing in front of the Earth on July 5th. Image: NASA/NOAA

We’re accustomed to seeing stunning images of both the Moon and Earth floating in space. It’s the age we live in. But seeing them together is rare. Now, NASA’s Deep Space Climate Observatory (DSCOVR) has captured images of the Moon passing between itself and the Earth, in effect photo-bombing Earth.

The image was captured with the Earth Polychromatic Imaging Camera (EPIC) camera on DISCOVR, and is the second time this has been captured. EPIC is a 4 megapixel camera on board DSCOVR, and DSCOVR is in orbit about 1.6 million km (1 million miles) from Earth, between the Earth and the Sun.

“For the second time in the life of DSCOVR, the moon moved between the spacecraft and Earth,” said Adam Szabo, DSCOVR project scientist at NASA’s Goddard Space Flight Center in Greenbelt, Maryland.

Cool pictures of the Moon are a bonus, though, as DSCOVR’s primary mission is to monitor the solar wind in real time for the National Oceanic and Atmospheric Administration (NOAA). It does so while inhabiting the first LaGrange point between the Earth and the Sun, where the gravitational pull of the Sun and the Earth balance each other. To do so requires a complex orbit called a Lissajous orbit, a non-recurring orbit which takes DSCOVR from an ellipse to a circle and back.

DSCOVR occupies the LaGrange point 1 between the Earth and the Sun. Image: NOAA

DSCOVR has other important work to do. From its vantage point, DSCOVR keeps a constantly illuminated view of the surface of the Earth as it rotates. DSCOVR provides observations of cloud height, vegetation, ozone, and aerosols in the atmosphere. This is important scientific data in monitoring and understanding Earth’s climate.

DSCOVR is a partnership between NASA, NOAA and the U.S. Air Force. As mentioned above, its primary objective is maintaining the nation’s real-time solar wind monitoring capabilities, which are critical to the accuracy and lead time of space weather alerts and forecasts from NOAA. The DSCOVR website also has daily color pictures of the Earth, for all your eye-candy needs.

Check it out:

http://epic.gsfc.nasa.gov/

ESA Discovers Where All The Missing Socks Have Been Going

earth's atmosphere has an ozone hole (not seen here)
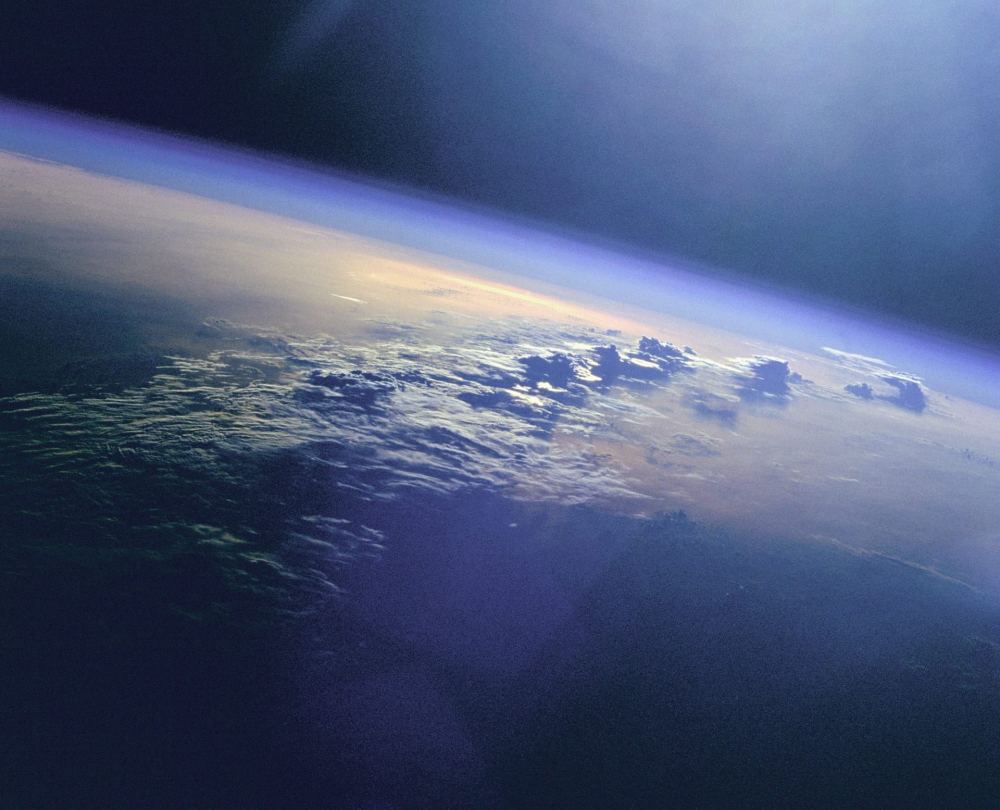
Earth’s atmosphere seen from space. The top layer of the stratosphere is the ozone layer, which protects us from harmful solar UV. Scientists are tracking the ozone hole over the Antarctic. Credit: NASA

We here at Earth are fortunate that we have a viable atmosphere, one that is protected by Earth’s magnetosphere. Without this protective envelope, life on the surface would be bombarded by harmful radiation emanating from the Sun. However, Earth’s upper atmosphere is still slowly leaking, with about 90 tonnes of material a day escaping from the upper atmosphere and streaming into space.

And although astronomers have been investigating this leakage for some time, there are still many unanswered questions. For example, how much material is being lost to space, what kinds, and how does this interact with solar wind to influence our magnetic environment? Such has been the purpose of the European Space Agency’s Cluster project, a series of four identical spacecraft that have been measuring Earth’s magnetic environment for the past 15 years.

Understanding our atmosphere’s interaction with solar wind first requires that we understand how Earth’s magnetic field works. For starters, it extends from the interior of our planet (and is believed to be the result of a dynamo effect in the core), and reaches all the way out into space. This region of space, which our magnetic field exerts influence over, is known as the magnetosphere.

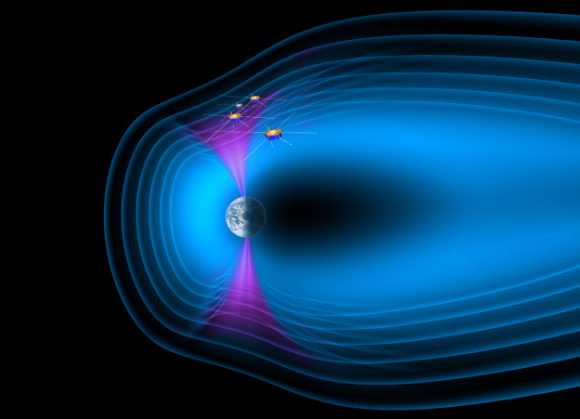
The four Cluster spacecraft crossing the northern cusp of Earth's magnetosphere. Credit: ESA/AOES Medialab
The four Cluster spacecraft crossing the northern cusp of Earth’s magnetosphere. Credit: ESA/AOES Medialab

The inner portion of this magnetosphere is called the plasmasphere, a donut-shaped region which extends to a distance of about 20,000 km from the Earth and co-rotates with it. The magnetosphere is also flooded with charged particles and ions that get trapped inside, and then are sent bouncing back and forth along the region’s field lines.

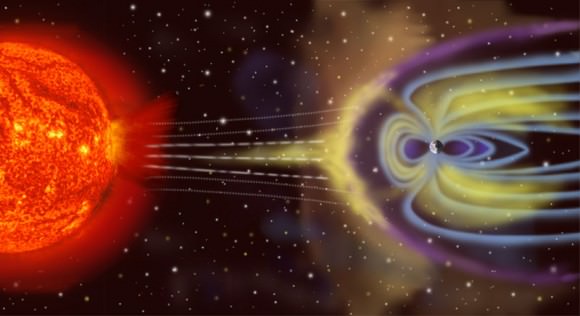
At its forward, Sun-facing edge, the magnetosphere meets the solar wind – a stream of charged particles flowing from the Sun into space. The spot where they make contact is known as the “Bow Shock”, which is so-named because its magnetic field lines force solar wind to take on the shape of a bow as they pass over and around us.

As the solar wind passes over Earth’s magnetosphere, it comes together again behind our planet to form a magnetotail – an elongated tube which contains trapped sheets of plasma and interacting field lines. Without this protective envelope, Earth’s atmosphere would have been slowly stripped away billions of years ago, a fate that is now believed to have befallen Mars.

That being said, Earth’s magnetic field is not exactly hermetically sealed. For example, at our planet’s poles, the field lines are open, which allows solar particles to enter and fill our magnetosphere with energetic particles. This process is what is responsible for Aurora Borealis and Aurora Australis (aka. the Northern and Southern Lights).

An illustration showing the natural barrier Earth gives us against solar radiation. Credit: NASA.

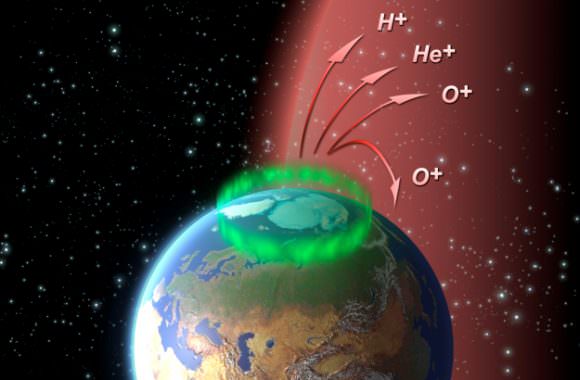
At the same time, particles from Earth’s upper atmosphere (the ionosphere) can escape the same way, traveling up through the poles and being lost to space. Despite learning much about Earth’s magnetic fields and how plasma is formed through its interaction with various particles, much about the whole process has been unclear until quite recently.

As Arnaud Masson, ESA’s Deputy Project Scientist for the Cluster mission stated in an ESA press release:

The question of plasma transport and atmospheric loss is relevant for both planets and stars, and is an incredibly fascinating and important topic. Understanding how atmospheric matter escapes is crucial to understanding how life can develop on a planet. The interaction between incoming and outgoing material in Earth’s magnetosphere is a hot topic at the moment; where exactly is this stuff coming from? How did it enter our patch of space?

Given that our atmosphere contains 5 quadrillion tons of matter (that’s 5 x 10¹⁵, or 5,000,000 billion tons), a loss of 90 tons a day doesn’t amount to much. However, this number does not include the mass of “cold ions” that are regularly being added. This term is typically used to described the hydrogen ions that we now know are being lost to the magnetosphere on a regular basis (along with oxygen and helium ions).

Since hydrogen requires less energy to escape our atmosphere, the ions that are created once this hydrogen becomes part of the plasmasphere also have low energy. As a result, they have been very difficult to detect in the past. What’s more, scientists have only known about this flow of oxygen, hydrogen and helium ions – which come from the Earth’s polar regions and replenish plasma in the magnetosphere – for a few decades.

Illustration of ions flowing out from the polar cap towards the magnetotail. Credit: ESA - C. Carreau
Illustration of ions flowing out from the polar cap towards the magnetotail. Credit: ESA – C. Carreau

Prior to this, scientists believed that solar particles alone were responsible for plasma in Earth’s magnetosphere. But in more recent years, they have come to understand that two other sources contribute to the plasmasphere. The first are sporadic “plumes” of plasma that grow within the plasmasphere and travel outwards towards the edge of the magnetosphere, where they interact with solar wind plasma coming the other way.

The other source? The aforementioned atmospheric leakage. Whereas this consists of abundant oxygen, helium and hydrogen ions, the cold hydrogen ions appear to play the most important role. Not only do they constitute a significant amount of matter lost to space, and may play a key role in shaping our magnetic environment. What’s more, most of the satellites currently orbiting Earth are unable to detect the cold ions being added to the mix, something which Cluster is able to do.

In 2009 and in 2013, the Cluster probes were able to characterize their strength, as well as that of other sources of plasma being added to the Earth’s magnetosphere. When only the cold ions are considered, the amount of atmosphere being lost o space amounts to several thousand tons per year. In short, its like losing socks. Not a big deal, but you’d like to know where they are going, right?

This has been another area of focus for the Cluster mission, which for the last decade and a half has been attempting to explore how these ions are lost, where they come from, and the like. As Philippe Escoubet, ESA’s Project Scientist for the Cluster mission, put it:

In essence, we need to figure out how cold plasma ends up at the magnetopause. There are a few different aspects to this; we need to know the processes involved in transporting it there, how these processes depend on the dynamic solar wind and the conditions of the magnetosphere, and where plasma is coming from in the first place – does it originate in the ionosphere, the plasmasphere, or somewhere else?

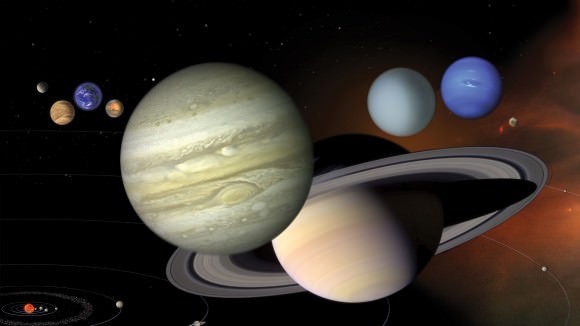
Color illustration showing the scale of planets in our solar system, focusing on Jupiter and Saturn. Credit: NASA

The reasons for understanding this are clear. High energy particles, usually in the form of solar flares, can pose a threat to space-based technology. In addition, understanding how our atmosphere interacts with solar wind is also useful when it comes to space exploration in general. Consider our current efforts to locate life beyond our own planet in the Solar System. If there is one thing that decades of missions to nearby planets has taught us, it is that a planet’s atmosphere and magnetic environment are crucial in determining habitability.

Within close proximity to Earth, there are two examples of this: Mars, which has a thin atmosphere and is too cold; and Venus, who’s atmosphere is too dense and far too hot. In the outer Solar System, Saturn’s moon Titan continues to intrigue us, mainly because of the unusual atmosphere. As the only body with a nitrogen-rich atmosphere besides Earth, it is also the only known planet where liquid transfer takes place between the surface and the atmosphere – albeit with petrochemicals instead of water.

Moreover, NASA’s Juno mission will spend the next two years exploring Jupiter’s own magnetic field and atmosphere. This information will tell us much about the Solar System’s largest planet, but it is also hoped to shed some light on the history planetary formation in the Solar System.

In the past fifteen years, Cluster has been able to tell astronomers a great deal about how Earth’s atmosphere interacts with solar wind, and has helped to explore magnetic field phenomena that we have only begun to understand. And while there is much more to be learned, scientists agree that what has been uncovered so far would have been impossible without a mission like Cluster.

Further Reading: ESA