Earth May Have Lost Some Primoridial Atmosphere to Meteors

Earth's Hadean Eon is a bit of a mystery to us, because geologic evidence from that time is scarce. Researchers at the Australian National University have used tiny zircon grains to get a better picture of early Earth. Credit: NASA

During the Hadean Eon, some 4.5 billion years ago, the world was a much different place than it is today. As the name Hades would suggest (Greek for “underworld”), it was a hellish period for Earth, marked by intense volcanism and intense meteoric impacts. It was also during this time that outgassing and volcanic activity produced the primordial atmosphere composed of carbon dioxide, hydrogen and water vapor.

Little of this primordial atmosphere remains, and geothermal evidence suggests that the Earth’s atmosphere may have been completely obliterated at least twice since its formation more than 4 billion years ago. Until recently, scientists were uncertain as to what could have caused this loss.

But a new study from MIT, Hebrew Univeristy, and Caltech indicates that the intense bombardment of meteorites in this period may have been responsible.

This meteoric bombardment would have taken place at around the same time that the Moon was formed. The intense bombardment of space rocks would have kicked up clouds of gas with enough force to permanent eject the atmosphere into space. Such impacts may have also blasted other planets, and even peeled away the atmospheres of Venus and Mars.

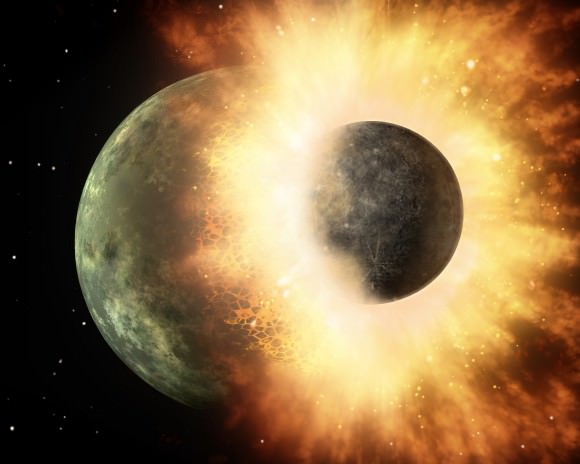
In fact, the researchers found that small planetesimals may be much more effective than large impactors –  such as Theia, whose collision with Earth is believed to have formed the Moon – in driving atmospheric loss. Based on their calculations, it would take a giant impact to disperse most of the atmosphere; but taken together, many small impacts would have the same effect.
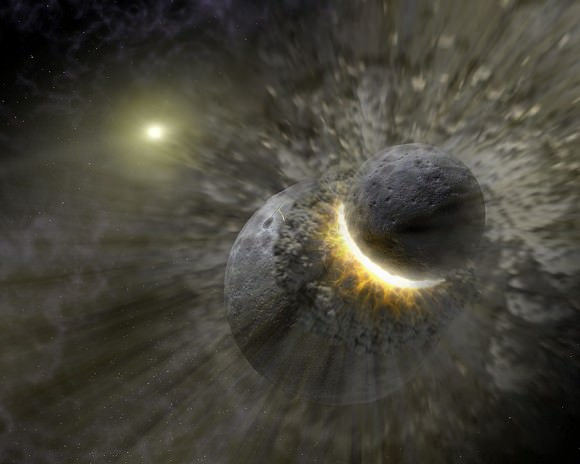
Artist's concept of a collision between proto-Earth and Theia, believed to happened 4.5 billion years ago. Credit: NASA
Artist’s concept of a collision between proto-Earth and Theia, believed to happened 4.5 billion years ago. Credit: NASA

Hilke Schlichting, an assistant professor in MIT’s Department of Earth, Atmospheric and Planetary Sciences, says understanding the drivers of Earth’s ancient atmosphere may help scientists to identify the early planetary conditions that encouraged life to form.

“[This finding] sets a very different initial condition for what the early Earth’s atmosphere was most likely like,” Schlichting says. “It gives us a new starting point for trying to understand what was the composition of the atmosphere, and what were the conditions for developing life.”

What’s more, the group examined how much atmosphere was retained and lost following impacts with giant, Mars-sized and larger bodies and with smaller impactors measuring 25 kilometers or less.

What they found was that a collision with an impactor as massive as Mars would have the necessary effect of generating a massive a shockwave through the Earth’s interior and potentially ejecting a significant fraction of the planet’s atmosphere.

However, the researchers determined that such an impact was not likely to have occurred, since it would have turned Earth’s interior into a homogenous slurry. Given the appearance of diverse elements observed within the Earth’s interior, such an event does not appear to have happened in the past.

A series of smaller impactors, by contrast, would generate an explosion of sorts, releasing a plume of debris and gas. The largest of these impactors would be forceful enough to eject all gas from the atmosphere immediately above the impact zone. Only a fraction of this atmosphere would be lost following smaller impacts, but the team estimates that tens of thousands of small impactors could have pulled it off.

An artistic conception of the early Earth, showing a surface pummeled by large impact, resulting in extrusion of deep seated magma onto the surface. At the same time, distal portion of the surface could have retained liquid water. Credit: Simone Marchi
Artist’s concept of the early Earth, showing a surface pummeled by large impacts. Credit: Simone Marchi

Such a scenario did likely occur 4.5 billion years ago during the Hadean Eon. This period was one of galactic chaos, as hundreds of thousands of space rocks whirled around the solar system and many are believed to have collided with Earth.

“For sure, we did have all these smaller impactors back then,” Schlichting says. “One small impact cannot get rid of most of the atmosphere, but collectively, they’re much more efficient than giant impacts, and could easily eject all the Earth’s atmosphere.”

However, Schlichting and her team realized that the sum effect of small impacts may be too efficient at driving atmospheric loss. Other scientists have measured the atmospheric composition of Earth compared with Venus and Mars; and compared to Venus, Earth’s noble gases have been depleted 100-fold. If these planets had been exposed to the same blitz of small impactors in their early history, then Venus would have no atmosphere today.

She and her colleagues went back over the small-impactor scenario to try and account for this difference in planetary atmospheres. Based on further calculations, the team identified an interesting effect: Once half a planet’s atmosphere has been lost, it becomes much easier for small impactors to eject the rest of the gas.

The researchers calculated that Venus’ atmosphere would only have to start out slightly more massive than Earth’s in order for small impactors to erode the first half of the Earth’s atmosphere, while keeping Venus’ intact. From that point, Schlichting describes the phenomenon as a “runaway process — once you manage to get rid of the first half, the second half is even easier.”

This gave rise to another important question: What eventually replaced Earth’s atmosphere? Upon further calculations, Schlichting and her team found the same impactors that ejected gas also may have introduced new gases, or volatiles.

“When an impact happens, it melts the planetesimal, and its volatiles can go into the atmosphere,” Schlichting says. “They not only can deplete, but replenish part of the atmosphere.”
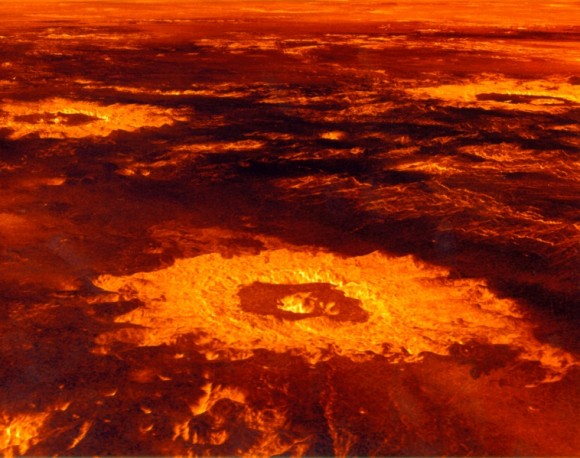
The "impact farm:, an area on Venus marked by impact craters and volcanic activity. Credit: NASA/JPL
The “impact farm:, an area on Venus marked by impact craters and volcanic activity. Credit: NASA/JPL

The group calculated the amount of volatiles that may be released by a rock of a given composition and mass, and found that a significant portion of the atmosphere may have been replenished by the impact of tens of thousands of space rocks.

“Our numbers are realistic, given what we know about the volatile content of the different rocks we have,” Schlichting notes.

Jay Melosh, a professor of earth, atmospheric, and planetary sciences at Purdue University, says Schlichting’s conclusion is a surprising one, as most scientists have assumed the Earth’s atmosphere was obliterated by a single, giant impact. Other theories, he says, invoke a strong flux of ultraviolet radiation from the sun, as well as an “unusually active solar wind.”

“How the Earth lost its primordial atmosphere has been a longstanding problem, and this paper goes a long way toward solving this enigma,” says Melosh, who did not contribute to the research. “Life got started on Earth about this time, and so answering the question about how the atmosphere was lost tells us about what might have kicked off the origin of life.”

Going forward, Schlichting hopes to examine more closely the conditions underlying Earth’s early formation, including the interplay between the release of volatiles from small impactors and from Earth’s ancient magma ocean.

“We want to connect these geophysical processes to determine what was the most likely composition of the atmosphere at time zero, when the Earth just formed, and hopefully identify conditions for the evolution of life,” Schlichting says.

Schlichting and her colleagues have published their results in the February edition of the journal Icarus.

Further Reading: MIT News

NASA’s Van Allen Probes Spot Impenetrable Radiation Barrier in Space

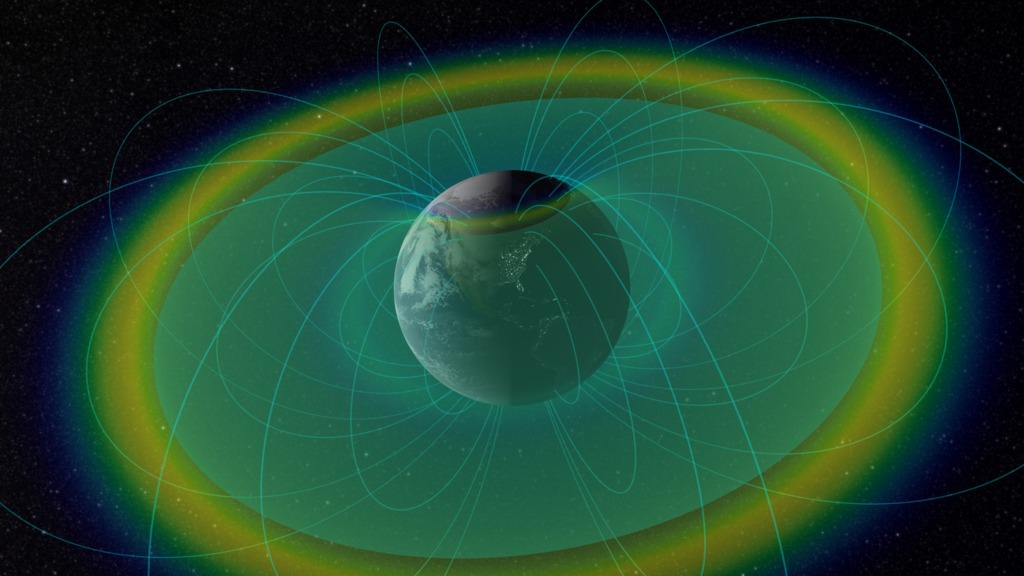
Visualization of the radiation belts with confined charged particles (blue & yellow) and plasmapause boundary (blue-green surface). Image Credit: NASA/Goddard

It’s a well-known fact that Earth’s ozone layer protects us from a great deal of the Sun’s ultra-violet radiation. Were it not for this protective barrier around our planet, chances are our surface would be similar to the rugged and lifeless landscape we observe on Mars.

Beyond this barrier lies another – a series of shields formed by a layer of energetic charged particles that are held in place by the Earth’s magnetic field. Known as the Van Allen radiation belts, this wall prevents the fastest, most energetic electrons from reaching Earth.

And according to new research from NASA’s Van Allen probes, it now appears that these belts may be nearly impenetrable, a finding which could have serious implications for future space exploration and research.

The existence of a belt of charged particles trapped by the Earth’s magnetosphere has been the subject of research since the early 20th century. However, it was not until 1958 that the Explorer 1 and Explorer 3 spacecrafts confirmed the existence of the belt, which would then be mapped out by the Explorer 4, Pioneer 3, and Luna 1 missions.

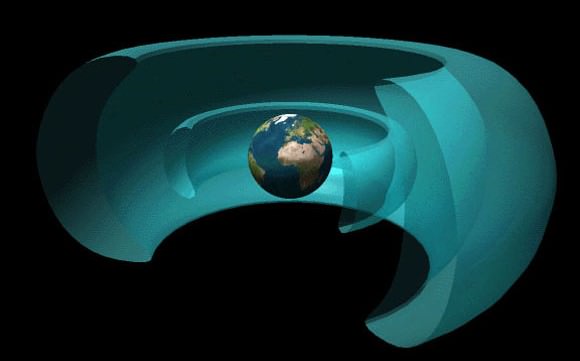
Two giant belts of radiation surround Earth. The inner belt is dominated by protons and the outer one by electrons. Credit: NASA

Since that time, scientists have discovered much about this belt, including how it interacts with other fields around our planet to form a nearly-impenetrable barrier to incoming electrons.

This discovery was made using NASA’s Van Allen Probes, launched in August 2012 to study the region. According to the observations made by the probes, this region can wax and wane in response to incoming energy from the sun, sometimes swelling up enough to expose satellites in low-Earth orbit to damaging radiation.

“This barrier for the ultra-fast electrons is a remarkable feature of the belts,” said Dan Baker, a space scientist at the University of Colorado in Boulder and first author of the paper. “We’re able to study it for the first time, because we never had such accurate measurements of these high-energy electrons before.”

Understanding what gives the radiation belts their shape and what can affect the way they swell or shrink helps scientists predict the onset of those changes. Such predictions can help scientists protect satellites in the area from the radiation.

In the decades since they were first discovered, scientists have learned that the size of the two belts can change – or merge, or even separate into three belts occasionally. But generally the inner belt stretches from 644 km to 10,000 km (400 – 6,000 mi) above the Earth’s surface while the outer belt stretches from 13,500 t0 58,000 km (8,400 – 36,000 mi).

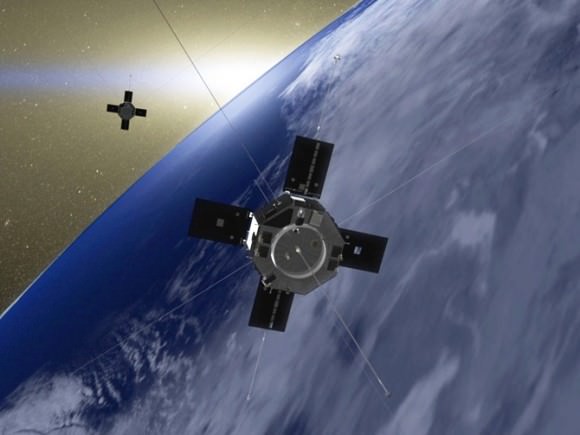
Artist's rendition of Van Allen Probes A and B in Earth orbit. Credit: NASA
Artist’s rendition of Van Allen Probes A and B in Earth orbit. Credit: NASA

Up until now, scientists have wondered why these two these belts have existed separately. Why, they have wondered, is there a fairly empty space between the two that appears to be free of electrons? That is where the newly discovered barrier comes in.

The Van Allen Probes data showed that the inner edge of the outer belt is, in fact, highly pronounced. For the fastest, highest-energy electrons, this edge is a sharp boundary that, under normal circumstances, cannot be penetrated.

“When you look at really energetic electrons, they can only come to within a certain distance from Earth,” said Shri Kanekal, the deputy mission scientist for the Van Allen Probes at NASA’s Goddard Space Flight Center in Greenbelt, Maryland, and a co-author on the Nature paper. “This is completely new. We certainly didn’t expect that.”

The team looked at possible causes. They determined that human-generated transmissions were not the cause of the barrier. They also looked at physical causes, asking if the shape of the Earth’s magnetic field could be the cause of the boundary. However, NASA scientists studied and eliminated that possibility and determined that the presence of other space particles appears to be the more likely cause.

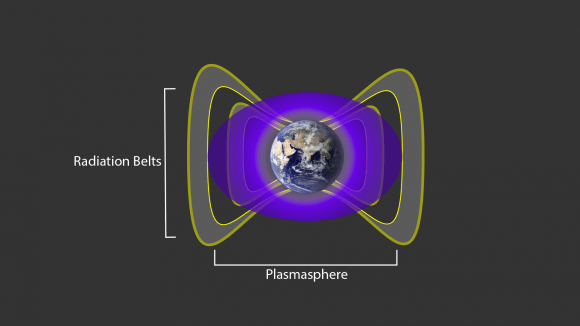
A cloud of cold, charged gas around Earth, called the plasmasphere and seen here in purple, interacts with the particles in Earth's radiation belts (shown in grey). Image Credit: NASA/Goddard
A cloud of cold, charged gas around Earth called the plasmasphere (seen here in purple), interacts with the particles in Earth’s radiation belts (shown in grey). Image Credit: NASA/Goddard

The radiation belts are not the only particle structures surrounding Earth. A giant cloud of relatively cool, charged particles called the plasmasphere fills the outermost region of Earth’s atmosphere, beginning at about 600 miles up and extending partially into the outer Van Allen belt. The particles at the outer boundary of the plasmasphere cause particles in the outer radiation belt to scatter, removing them from the belt.

This scattering effect is fairly weak and might not be enough to keep the electrons at the boundary in place, except for a quirk of geometry – the radiation belt electrons move incredibly quickly, but not toward Earth. Instead, they move in giant loops around Earth.

The Van Allen Probes’ data show that in the direction toward Earth, the most energetic electrons have very little motion at all – just a gentle, slow drift that occurs over the course of months. This movement is so slow and weak that it can be rebuffed by the scattering caused by the plasmasphere.

This also helps explain why – under extreme conditions, when an especially strong solar wind or a giant solar eruption such as a coronal mass ejection sends clouds of material into near-Earth space – the electrons from the outer belt can be pushed into the usually-empty slot region between the belts.

“The scattering due to the plasmapause is strong enough to create a wall at the inner edge of the outer Van Allen Belt,” said Baker. “But a strong solar wind event causes the plasmasphere boundary to move inward.”

A massive inflow of matter from the sun can erode the outer plasmasphere, moving its boundaries inward and allowing electrons from the radiation belts the room to move further inward too.

The Johns Hopkins Applied Physics Laboratory in Laurel, Maryland, built and operates the Van Allen Probes for NASA’s Science Mission Directorate. The mission is the second in NASA’s Living With a Star program, managed by Goddard.

A paper on these results appeared in the Nov. 26, 2014, issue of Nature magazine. And be sure to watch this animated video produced by the Goddard Space Center that explains the Van Allen belt in brief:

Further Reading: NASA

Antares Rocket Failure Pushes Tiny Satellite Company To Hitch Ride With SpaceX

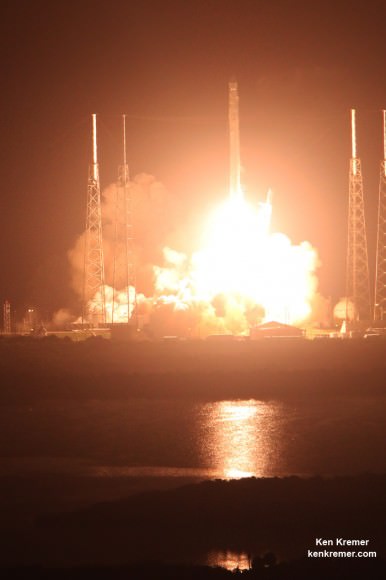
Orbital Sciences Antares rocket explodes violently and is consumed in a gigantic aerial fireball seconds after blastoff from NASA’s Wallops Flight Facility, VA, on Oct. 28, 2014 at 6:22 p.m. Credit: Ken Kremer – kenkremer.com

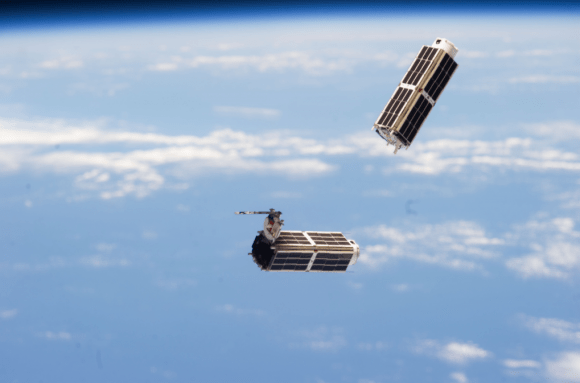
The various companies that had stuff sitting on the failed Orbital Sciences Antares rocket launch last month are busy looking for alternatives. One example is Planet Labs, which is best known for deploying dozens of tiny satellites from the International Space Station this year.

The company lost 26 satellites in the explosion. But within nine days of the Oct. 28 event, Planet Labs had a partial backup plan — send two replacements last-minute on an upcoming SpaceX Falcon 9 launch.

In what Planet Labs’ Robbie Schingler calls “the future of aerospace”, almost immediately after the explosion Planet Labs began working with NanoRacks, which launches its satellites from the space station, to find a replacement flight. Half of Planet Labs’ employees began building satellites, while the other half began working through the regulations and logistics. They managed to squeeze two satellites last-minute on to the next SpaceX manifest, which is scheduled to launch in December.

“In space, each element is very difficult to get right by itself, and it takes an ecosystem to deliver a capability this quickly,” wrote Schingler, a president and co-founder of the company, in a blog post last week.

NanoRacks CubeSats deployed from the International Space Station in February 2014, during Expedition 38. Credit: NASA

“Central to making this possible was developing our own custom design of the satellite that is free from specialty suppliers (thus decreasing lead time) and having a spacecraft design optimized for manufacturing and automated testing. Moreover, we certainly couldn’t have done it without the collaboration from NanoRacks and support from NASA, and we thank them for their support. This is a great example for how to create a resilient aerospace ecosystem.”

There’s no word on how they will replace the other satellites, nor how this will affect Planet Labs’ vision (explained in this March TED talk) to have these small sentinels frequently circling Earth to provide near-realtime information on what is happening with our planet. But the company acknowledged that space is hard and satellites do get lost from time to time.

The company has been testing hardware in space, Silicon Valley-style, and starting to sign partnerships with various entities who want access to the imagery. Check out some of the free stuff below.

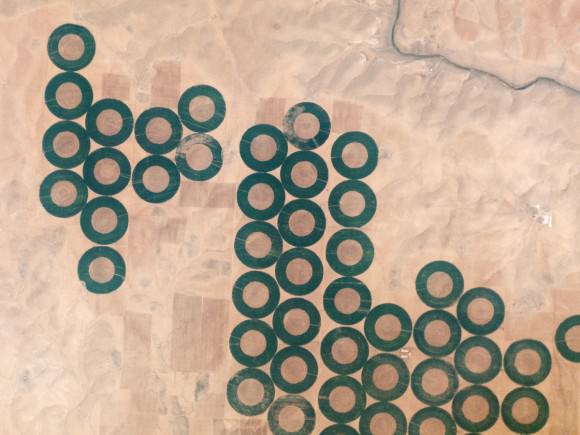
Writes Planet Labs of this image: "Water from reservoirs developed on the Tigris and Euphrates Rivers in the past 25 years enabled the expansion of cropland in the region, including these circular fields in the ?anliurfa Province of southeastern Turkey." Credit: Planet Labs
Writes Planet Labs of this image: “Water from reservoirs developed on the Tigris and Euphrates Rivers in the past 25 years enabled the expansion of cropland in the region, including these circular fields in the ?anliurfa Province of southeastern Turkey.” Credit: Planet Labs
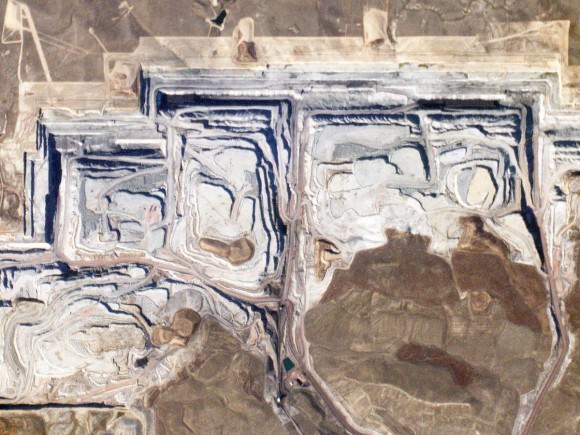
Writes Planet Labs of this image: "Forty percent of the coal mined in the United States comes from the Powder River Basin in Wyoming. The North Antelope Rochelle Mine, pictured here, is both the largest in the basin, and the largest in the United States." Credit: Planet Labs
Writes Planet Labs of this image: “Forty percent of the coal mined in the United States comes from the Powder River Basin in Wyoming. The North Antelope Rochelle Mine, pictured here, is both the largest in the basin, and the largest in the United States.” Credit: Planet Labs
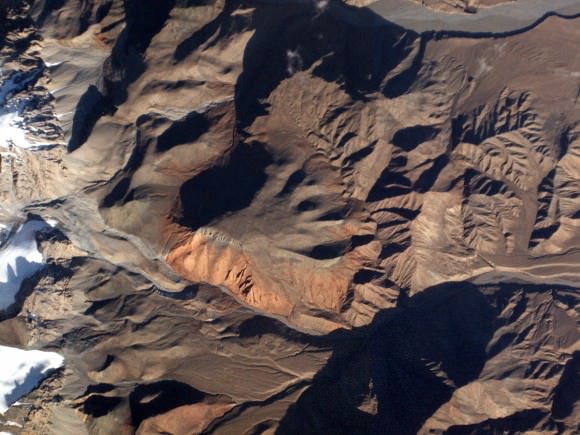
Writes Planet Labs of this image: "The deep valleys and sharp ridges of the Nan Shan range in central China are highlighted in this early-morning satellite image." Credit: Planet Labs
Writes Planet Labs of this image: “The deep valleys and sharp ridges of the Nan Shan range in central China are highlighted in this early-morning satellite image.” Credit: Planet Labs
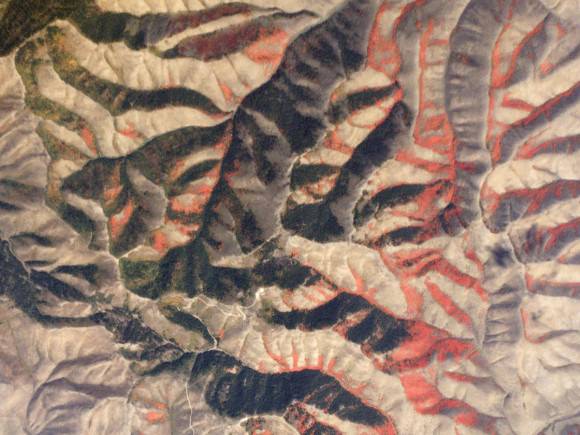
Writes Planet Labs of this image: "Vivid red maples stand out against the dark green evergreen forest and brown scrub landscape of the Pleasantview Hills." Credit: Planet Labs
Writes Planet Labs of this image: “Vivid red maples stand out against the dark green evergreen forest and brown scrub landscape of the Pleasantview Hills.” Credit: Planet Labs
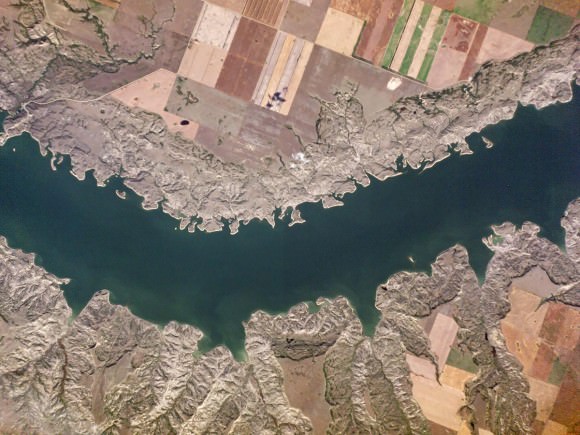
Writes Planet Labs of this image: "Filled in 1967, Lake Diefenbaker is a 140-mile-long reservoir along the South Saskatchewan and Qu’Appelle Rivers. Diefenbaker is renowned for harboring extremely large fish: the world record rainbow trout (48 pounds) and burbot (25 pounds) were both caught in the lake." Credit: Planet Labs
Writes Planet Labs of this image: “Filled in 1967, Lake Diefenbaker is a 140-mile-long reservoir along the South Saskatchewan and Qu’Appelle Rivers. Diefenbaker is renowned for harboring extremely large fish: the world record rainbow trout (48 pounds) and burbot (25 pounds) were both caught in the lake.” Credit: Planet Labs
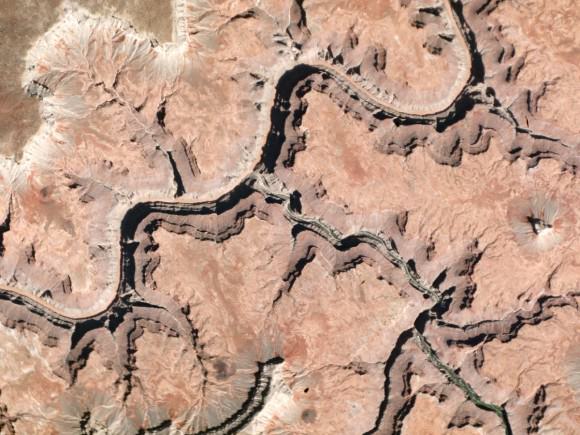
Writes Planet Labs of this image: "The red, sediment-filled Colorado River contrasts with blue-green Havasu Creek in the heart of Grand Canyon National Park. The Colorado River is almost always red in spring and summer, since it collects silt from a huge watershed. Short tributaries, however, usually run clear—only picking up significant sediment during flash floods." Credit: Planet Labs
Writes Planet Labs of this image: “The red, sediment-filled Colorado River contrasts with blue-green Havasu Creek in the heart of Grand Canyon National Park. The Colorado River is almost always red in spring and summer, since it collects silt from a huge watershed. Short tributaries, however, usually run clear—only picking up significant sediment during flash floods.” Credit: Planet Labs
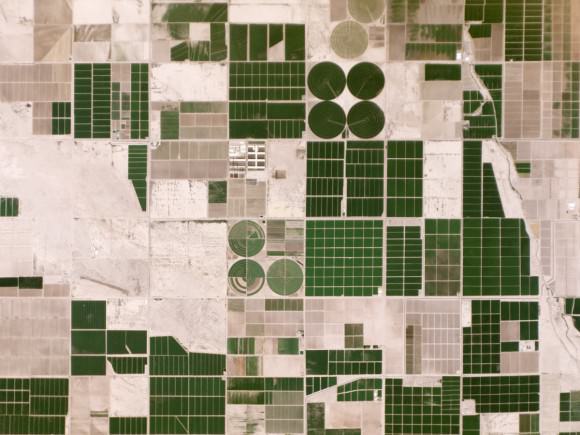
Writes Planet Labs of this image: "Dark green fields stand out against the pale desert floor in Pinal County, Arizona. The region’s farms rely on irrigation, since they receive less than 10 inches of rain a year. Irrigation water comes from two main sources: the Colorado River and aquifers." Credit: Planet Labs
Writes Planet Labs of this image: “Dark green fields stand out against the pale desert floor in Pinal County, Arizona. The region’s farms rely on irrigation, since they receive less than 10 inches of rain a year. Irrigation water comes from two main sources: the Colorado River and aquifers.” Credit: Planet Labs

Global Warming Watch: How Carbon Dioxide Bleeds Across The Earth

High concentrations of carbon dioxide (in red) tend to congregate in the northern hemisphere during colder months, when plants can't absorb as much from the atmosphere. This picture is based on a NASA Goddard computer model from ground-based observations and depicts concentrations on March 30, 2006. Credit: NASA's Goddard Space Flight Center/B. Putman/YouTube (screenshot)

Red alert — the amount of carbon dioxide in the atmosphere is increasing year-by-year due to human activity. It’s leading to a warming Earth, but just how quickly — and how badly it will change the environment around us — is hard to say.

NASA released a new video showing how carbon dioxide — a product mainly of fossil fuels — shifts during a typical year. Billed as the most accurate model to date, the emissions shown in 2006 (tracked by ground-based sources) show how wind currents across the globe spread the gas across the globe. The red you see up there indicates high concentrations. The full video is below the jump.

In spring and summer, plants absorb carbon dioxide and the amount in the atmosphere above that hemisphere decreases. In fall and winter, carbon dioxide is not absorbed as well since the plants are dead or dormant. Also seen in the video is carbon monoxide that spreads out from forest fires, particularly in the southern hemisphere.

“Despite carbon dioxide’s significance, much remains unknown about the pathways it takes from emission source to the atmosphere or carbon reservoirs such as oceans and forests,” NASA stated.

“Combined with satellite observations such as those from NASA’s recently launched OCO-2 [Orbiting Carbon Observatory-2], computer models will help scientists better understand the processes that drive carbon dioxide concentrations.”

The model is called GEOS-5 and was made by scientists at the NASA Goddard Space Flight Center’s global modeling and assimilation office.

Source: NASA

The Origins of Life Could Indeed Be “Interstellar”

This image shows a star-forming region in interstellar space. A new study used AI and radiotelescope data to find 140,000 regions in the Milky Way that will eventually form stars like this region. Image credit: NASA, ESA and the Hubble Heritage (STScI/AURA)-ESA/Hubble Collaboration

Some of science’s most pressing questions involve the origins of life on Earth. How did the first lifeforms emerge from the seemingly hostile conditions that plagued our planet for much of its history? What enabled the leap from simple, unicellular organisms to more complex organisms consisting of many cells working together to metabolize, respire, and reproduce? In such an unfamiliar environment, how does one even separate “life” from non-life in the first place?

Now, scientists at the University of Hawaii at Manoa believe that they may have an answer to at least one of those questions. According to the team, a vital cellular building block called glycerol may have first originated via chemical reactions deep in interstellar space.

Glycerol is an organic molecule that is present in the cell membranes of all living things. In animal cells this membrane takes the form of a phospholipid bilayer, a dual-layer membrane that sandwiches water-repelling fatty acids between outer and inner sheets of water-soluble molecules. This type of membrane allows the cell’s inner aqueous environment to remain separate and protected from its external, similarly watery world. Glycerol is a vital component of each phospholipid because it forms the backbone between the molecule’s two characteristic parts: a polar, water-soluble head, and a non-polar, fatty tail.

Many scientists believe that cell membranes such as these were a necessary prerequisite to the evolution of multicellular life on Earth; however, their complex structure requires a very specific environment – namely, one low in calcium and magnesium salts with a fairly neutral pH and stable temperature. These carefully balanced conditions would have been hard to come by on the prehistoric Earth.

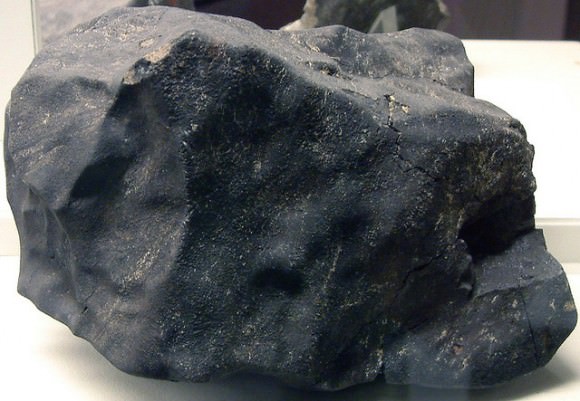
Icy bodies born in interstellar space offer an alternative scenario. Scientists have already discovered organic molecules such as amino acids and lipid precursors in the Murchison meteorite that landed in Australia in 1969. Although the idea remains controversial, it is possible that glycerol could have been brought to Earth in a similar manner.

The Murchison Meteorite. Image credit: James St. John
The Murchison Meteorite.
Image credit: James St. John

Meteors typically form from tiny crumbs of material in cold molecular clouds, regions of gaseous hydrogen and interstellar dust that serve as the birthplace of stars and planetary systems. As they move through the cloud, these grains accumulate layers of frozen water, methanol, carbon dioxide, and carbon monoxide. Over time, high-energy ultraviolet radiation and cosmic rays bombard the icy fragments and cause chemical reactions that enrich their frozen cores with organic compounds. Later, as stars form and ambient material falls into orbit around them, the ices and the organic molecules they contain are incorporated into larger rocky bodies such as meteors. The meteors can then crash into planets like ours, potentially seeding them with building blocks of life.

In order to test whether or not glycerol could be created by the high-energy radiation that typically bombards interstellar ice grains, the team at the University of Hawaii designed their own meteorites: small bits of icy methanol cooled to 5 degrees Kelvin. After blasting their model ices with energetic electrons meant to mimic the effects of cosmic rays, the scientists found that some molecules of methanol within the ices did, in fact, transform into glycerol.

While this experiment appears to be a success, scientists realize that their laboratory models do not exactly replicate conditions in interstellar space. For instance, methanol traditionally makes up only about 30% of the ice in space rocks. Future work will investigate the effects of high-energy radiation on model ices made primarily of water. High-energy electrons fired in a lab are also not a perfect substitute for true cosmic rays and do not represent effects on ice that may result from ultraviolet radiation in interstellar space.

More research is necessary before scientists can draw any global conclusions; however, this study and its predecessors do provide compelling evidence that life as we know it truly could have come from above.

NASA’s RapidScat Ocean Wind Watcher Starts Earth Science Operations at Space Station

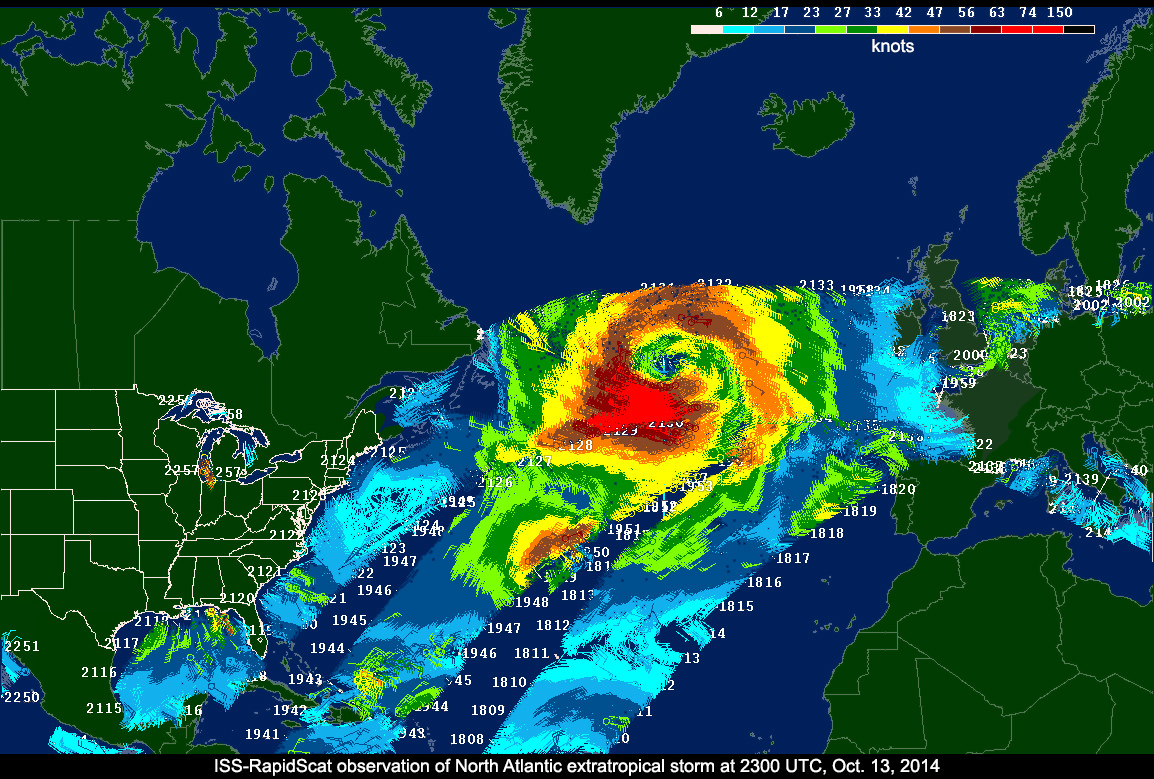
ISS-RapidScat data on a North Atlantic extratropical cyclone, as seen by the National Centers for Environmental Prediction Advanced Weather Interactive Processing System used by weather forecasters at the National Oceanic and Atmospheric Administration's Ocean Prediction Center. Image Credit: NASA/JPL-Caltech/NOAA

Barely two months after being launched to the International Space Station (ISS), NASA’s first science payload aimed at conducting Earth science from the station’s exterior has started its ocean wind monitoring operations two months ahead of schedule.

Data from the ISS Rapid Scatterometer, or ISS-RapidScat, payload is now available to the world’s weather and marine forecasting agencies following the successful completion of check out and calibration activities by the mission team.

Indeed it was already producing high quality, usable data following its power-on and activation at the station in late September and has monitored recent tropical cyclones in the Atlantic and Pacific Oceans prior to the end of the current hurricane season.

RapidScat is designed to monitor ocean winds for climate research, weather predictions, and hurricane monitoring for a minimum mission duration of two years.

“RapidScat is a short mission by NASA standards,” said RapidScat Project Scientist Ernesto Rodriguez of JPL.

“Its data will be ready to help support U.S. weather forecasting needs during the tail end of the 2014 hurricane season. The dissemination of these data to the international operational weather and marine forecasting communities ensures that RapidScat’s benefits will be felt throughout the world.”

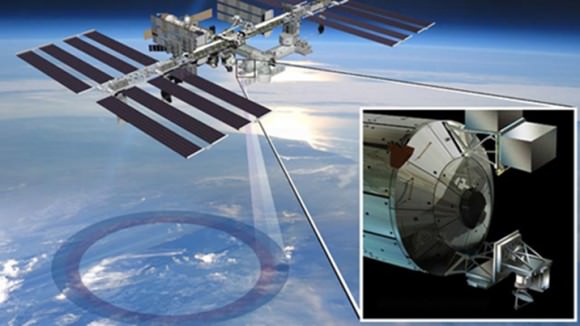
ISS-RapidScat instrument, shown in this artist's rendering, was launched to the International Space Station aboard the SpaceX CRS-4 mission on Sept. 21, 2014 and attached at ESA’s Columbus module.  It will measure ocean surface wind speed and direction and help improve weather forecasts, including hurricane monitoring. Credit: NASA/JPL-Caltech/Johnson Space Center.
ISS-RapidScat instrument, shown in this artist’s rendering, was launched to the International Space Station aboard the SpaceX CRS-4 mission on Sept. 21, 2014, and attached at ESA’s Columbus module. It will measure ocean surface wind speed and direction and help improve weather forecasts, including hurricane monitoring. Credit: NASA/JPL-Caltech/Johnson Space Center.

The 1280 pound (580kilogram) experimental instrument was developed by NASA’s Jet Propulsion Laboratory. It’s a cost-effective replacement to NASA’s former QuikScat satellite.

The $26 million remote sensing instrument uses radar pulses reflected from the ocean’s surface at different angles to calculate the speed and direction of winds over the ocean for the improvement of weather and marine forecasting and hurricane monitoring.

The RapidScat, payload was hauled up to the station as part of the science cargo launched aboard the commercial SpaceX Dragon CRS-4 cargo resupply mission that thundered to space on the company’s Falcon 9 rocket from Space Launch Complex-40 at Cape Canaveral Air Force Station in Florida on Sept. 21.

ISS-RapidScat is NASA’s first research payload aimed at conducting near global Earth science from the station’s exterior and will be augmented with others in coming years.

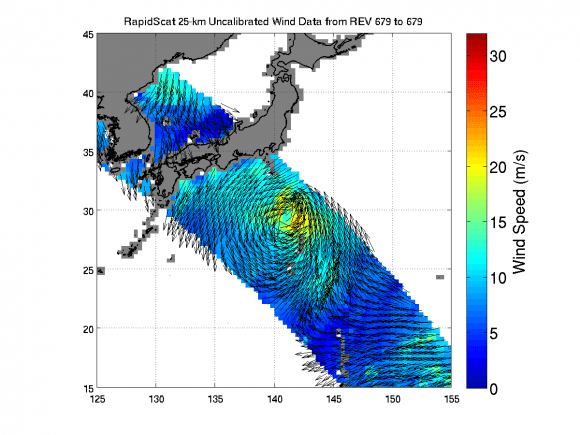
ISS-RapidScat viewed the winds within post-tropical cyclone Nuri as it moved parallel to Japan on Nov. 6, 2014 05:30 UTC. Image Credit: NASA/JPL-Caltech
ISS-RapidScat viewed the winds within post-tropical cyclone Nuri as it moved parallel to Japan on Nov. 6, 2014, 05:30 UTC. Image Credit: NASA/JPL-Caltech

It was robotically assembled and attached to the exterior of the station’s Columbus module using the station’s robotic arm and DEXTRE manipulator over a two day period on Sept 29 and 30.

Ground controllers at Johnson Space Center intricately maneuvered DEXTRE to pluck RapidScat and its nadir adapter from the unpressurized trunk section of the Dragon cargo ship and attached it to a vacant external mounting platform on the Columbus module holding mechanical and electrical connections.

The nadir adapter orients the instrument to point its antennae at Earth.

The couch sized instrument and adapter together measure about 49 x 46 x 83 inches (124 x 117 x 211 centimeters).

“The initial quality of the RapidScat wind data and the timely availability of products so soon after launch are remarkable,” said Paul Chang, ocean vector winds science team lead at NOAA’s National Environmental Satellite, Data and Information Service (NESDIS)/Center for Satellite Applications and Research (STAR), Silver Spring, Maryland.

“NOAA is looking forward to using RapidScat data to help support marine wind and wave forecasting and warning, and to exploring the unique sampling of the ocean wind fields provided by the space station’s orbit.”

A SpaceX Falcon 9 rocket carrying a Dragon cargo capsule packed with science experiments and station supplies blasts off from Space Launch Complex 40 at Cape Canaveral Air Force Station, Florida, at 1:52 a.m. EDT on Sept. 21, 2014 bound for the ISS.  Credit: Ken Kremer/kenkremer.com
A SpaceX Falcon 9 rocket carrying a Dragon cargo capsule packed with science experiments and station supplies blasts off from Space Launch Complex 40 at Cape Canaveral Air Force Station, Florida, at 1:52 a.m. EDT on Sept. 21, 2014, bound for the ISS. Credit: Ken Kremer/kenkremer.com

This has been a banner year for NASA’s Earth science missions. At least five missions will be launched to space within a 12 month period, the most new Earth-observing mission launches in one year in more than a decade.

ISS-RapidScat is the third of five NASA Earth science missions scheduled to launch over a year.

NASA has already launched the of the Global Precipitation Measurement (GPM) Core Observatory, a joint mission with the Japan Aerospace Exploration Agency, in February and the Orbiting Carbon Observatory-2 (OCO-2) carbon observatory in July 2014.

Stay tuned here for Ken’s continuing Earth and Planetary science and human spaceflight news.

Ken Kremer

We are not Alone: Government Sensors Shed New Light on Asteroid Hazards

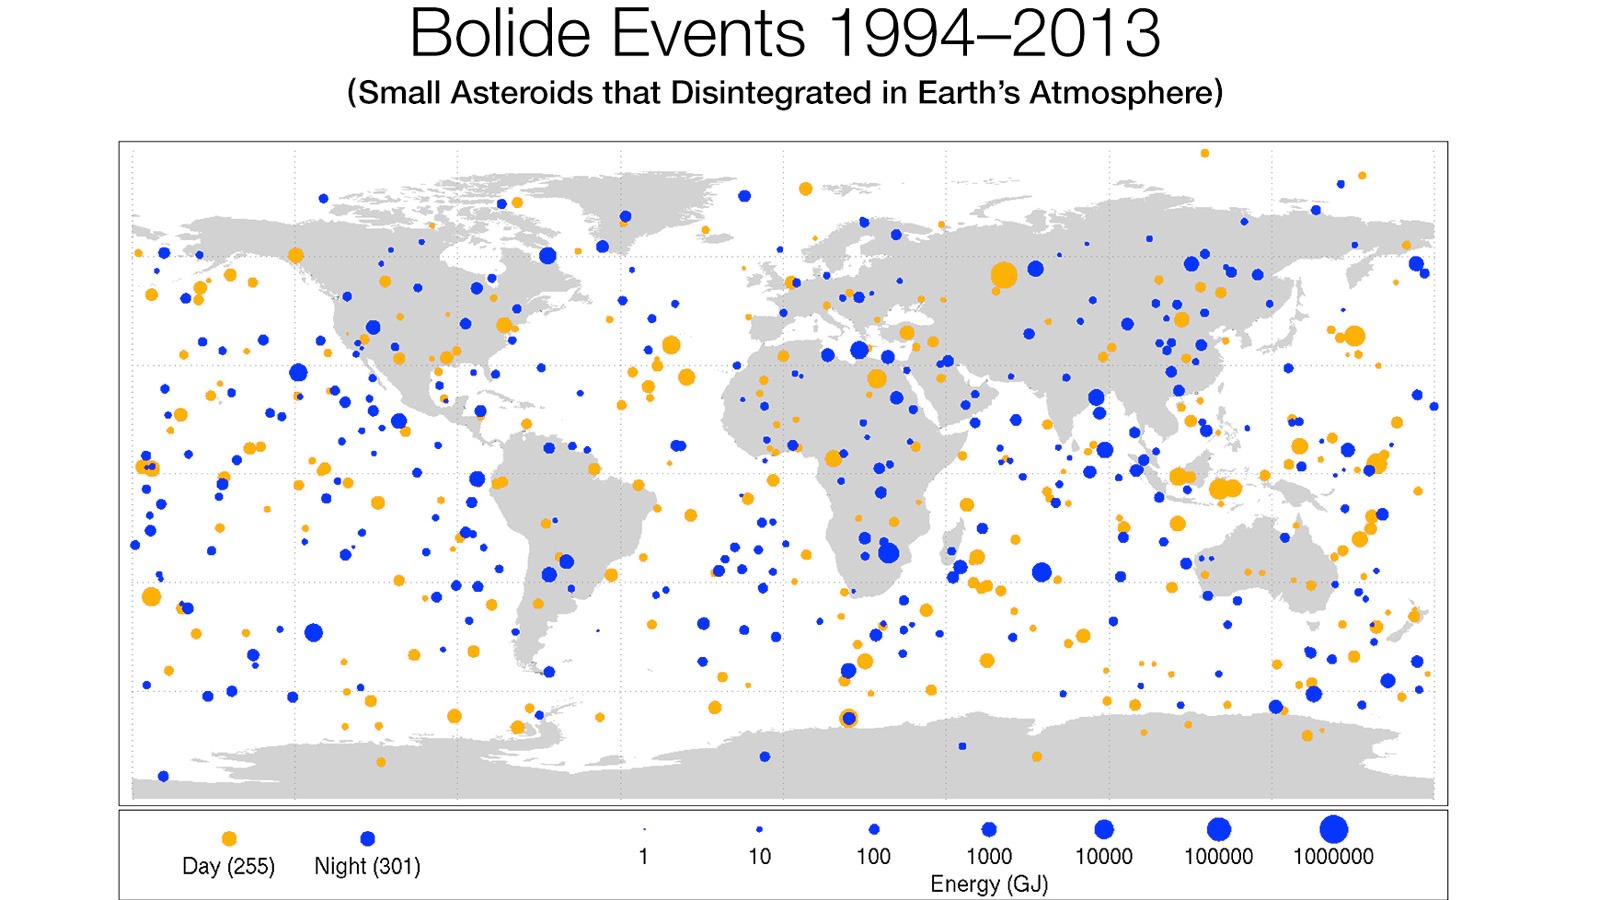
This diagram maps data gathered from 1994-2013 on small asteroids impacting Earth's atmosphere to create very bright meteors (bolides). The location of impacts from objects ranging from 1 meter (3 feet) to nearly 20 meters (60 feet) in size such as Chelyabinsk asteroid are shown globally. (Credit: Planetary Science, NASA)

How hazardous are the thousands and millions of asteroids that surround the third rock from the Sun – Earth? Since an asteroid impact represents a real risk to life and property, this is a question that has been begging for answers for decades. But now, scientists at NASA’s Jet Propulsion Laboratory have received data from a variety of US Department of Defense assets and plotted a startling set of data spanning 20 years.

This latest compilation of data underscores how frequent some of these larger fireballs are, with the largest being the Chelyabinsk event on February 15, 2013 which injured thousands in Russia. The new data will improve our understanding of the frequency and presence of small and large asteroids that are hazards to populated areas anywhere on Earth.

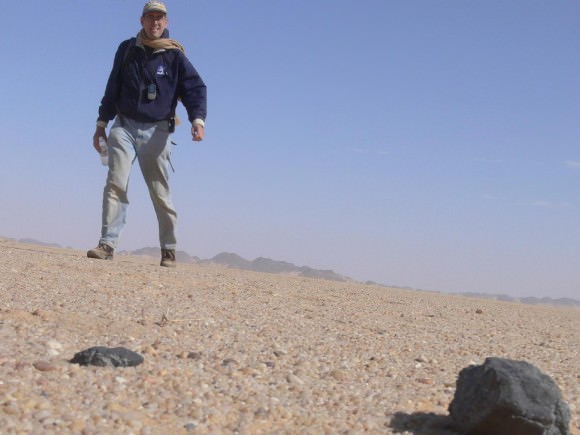
On Feb. 28, 2009, Peter Jenniskens (SETI/NASA), finds his first 2008TC3 meteorite after an 18-mile long journey. "It was an incredible feeling," Jenniskens said. The African Nubian Desert meteorite of Oct 7, 2008 was the first asteroid whose impact with Earth was predicted while still in space approaching Earth. 2008TC3 and Chelyabinsk are part of the released data set. (Credit: NASA/SETI/P.Jenniskens)
On Feb. 28, 2009, Peter Jenniskens (SETI/NASA), finds his first 2008TC3 meteorite after an 18-mile long journey. “It was an incredible feeling,” Jenniskens said. The meteorite which impacted in the Nubian Desert of Africa on Oct 7, 2008 was the first asteroid whose impact with Earth was predicted while still in space approaching Earth. Meteorite 2008TC3 and Chelyabinsk’s are part of the released data set. (Credit: NASA/SETI/P.Jenniskens)

The data from “government sensors” – meaning “early warning” satellites to monitor missile launches (from potential enemies) as well as infrasound ground monitors – shows the distribution of bolide (fireball) events. The data first shows how uniformly distributed the events are around the world. This data is now released to the public and researchers for more detailed analysis.

The newest data released by the US government shows both how frequent bolides are and also how effectively the Earth’s atmosphere protects the surface. A subset of this data had been analyzed and reported by Dr. Peter Brown from the University of Western Ontario, Canada and his team in 2013 but included only 58 events. This new data set holds 556 events.

The newly released data also shows how the Earth’s atmosphere is a superior barrier that prevents small asteroids’ penetration and impact onto the Earth’s surface. Even the 20 meter (65 ft) Chelyabinsk asteroid exploded mid-air, dissipating the power of a nuclear blast 29.7 km (18.4 miles, 97,400 feet) above the surface. Otherwise, this asteroid could have obliterated much of a modern city; Chelyabinsk was also saved due to sheer luck – the asteroid entered at a shallow angle leading to its demise; more steeply, and it would have exploded much closer to the surface. While many do explode in the upper atmosphere, a broad strewn field of small fragments often occurs. In historical times, towns and villages have reported being pelted by such sprays of stones from the sky.

NASA and JPL emphasized that investment in early detection of asteroids has increased 10 fold in the last 5 years. Researchers such as Dr. Jenniskens at the SETI Institute has developed a network of all-sky cameras that have determined the orbits of over 175,000 meteors that burned up in the atmosphere. And the B612 Foundation has been the strongest advocate of discovering of all hazardous asteroids. B612, led by former astronauts Ed Lu and Rusty Schweikert has designed a space telescope called Sentinel which would find hazardous asteroids and help safeguard Earth for centuries into the future.

Speed is everything. While Chelyabinsk had just 1/10th the mass of Nimitz-class super carrier, it traveled 1000 times faster. Its kinetic energy on account of its speed was 20 to 30 times that released by the nuclear weapons used to end the war against Japan – about 320 to 480 kilotons of TNT. Briefly, asteroids are considered to be any space rock larger than 1 meter and those smaller are called meteoroids.

Two earlier surveys can be compared to this new data. One by Eugene Shoemaker in the 1960s and another by Dr. Brown. The initial work by Shoemaker using lunar crater counts and the more recent work of Dr. Brown’s group, utilizing sensors of the Department of Defense, determined estimates of the frequency of asteroid impacts (bolide) rates versus the size of the small bodies. Those two surveys differ by a factor of ten, that is, where Shoemaker’s shows frequencies on the order of 10s or 100s years, Brown’s is on the order of 100s and 1000s of years. The most recent data, which has adjusted Brown’s earlier work is now raising the frequency of hazardous events to that of the work of Shoemaker.

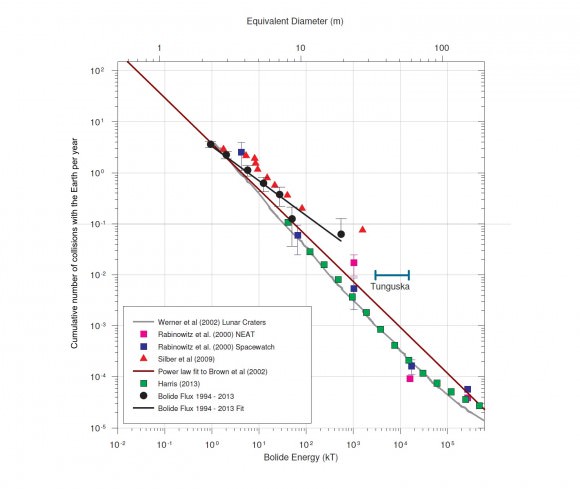
The work of Dr. Brown and co-investigators led to the following graph showing the frequency of collisions with the Earth of asteroids of various sizes. This plot from a Letter to Nature by P. Brown et al. used 58 bolides from data accumulated from 1994 to 2014 from government sensors. Brown and others will improve their analysis with this more detailed dataset. The plot shows that a Chelyabinsk type event can be expected approximately every 30 years though the uncertainty is high. The new data may reduce this uncertainty. Tungunska events which could destroy a metropolitan area the size of Washington DC occur less frequently – about once a century.

The estimated cumulative flux of impactors at the Earth. The bolide impactor flux at Earth (Bolide flux 1994-2013 - black circles) based on ~20 years of global observations from US Government sensors and infrasound airwave data. Global coverage averages 80% among a total of 58 observed bolides with E > 1 kt and includes the Chelyabinsk Chelyabinsk bolide (far right black circle). This coverage correction is approximate and the bolide flux curve is likely a lower limit. The full caption is at bottom. (Credit: P. Brown, Letter to Nature, 2013, Figure 3)
The estimated cumulative flux of impactors at the Earth. The bolide impactor flux at Earth (Bolide flux 1994-2013 – black circles) based on ~20 years of global observations from US Government sensors and infrasound airwave data. Global coverage averages 80% among a total of 58 observed bolides with E > 1 kt and includes the Chelyabinsk Chelyabinsk bolide (far right black circle). This coverage correction is approximate and the bolide flux curve is likely a lower limit. The full caption is at bottom. (Credit: P. Brown, Letter to Nature, 2013, Figure 3)

Asteroids come in all sizes. Smaller asteroids are much more common, larger ones less so. A common distribution seen in nature is represented by a bell curve or “normal” distribution. Fortunately the bigger asteroids number in the hundreds while the small “city busters” count in the 100s of thousands, if not millions. And fortunately, the Earth is small in proportion to the volume of space even just the space occupied by our Solar System. Additionally, 69% of the Earth’s surface is covered by Oceans. Humans huddle on only about 10% of the surface area of the Earth. This reduces the chances of any asteroid impact effecting a populated area by a factor of ten.

Altogether the risk from asteroids is very real as the Chelyabinsk event underscored. Since the time of Tugunska impact in Siberia in 1908, the human population has quadrupled. The number of cities of over 1 million has increased from 12 to 400. Realizing how many and how frequent these asteroid impacts occur plus the growth of the human population in the last one hundred years raises the urgency for a near-Earth asteroid discovery telescope such as B612’s Sentinel which could find all hazardous objects in less than 10 years whereas ground-based observations will take 100 years or more.

Reference:
New Map Shows Frequency of Small Asteroid Impacts, Provides Clues on Larger Asteroid Population

Full Caption of the included plot from LETTERS TO NATURE, The Chelyabinsk airburst : Implications for the Impact Hazard, P.G. Brown, et al.

The estimated cumulative flux of impactors at the Earth. The bolide impactor flux at Earth (Bolide flux 1994-2013 – black circles) based on ~20 years of global observations from US Government sensors and infrasound airwave data. Global coverage averages 80% among a total of 58 observed bolides with E > 1 kt and includes the Chelyabinsk Chelyabinsk bolide (far right black circle). This coverage correction is approximate and the bolide flux curve is likely a lower limit. The brown-coloured line represents an earlier powerlaw fit from a smaller dataset for bolides between 1 – 8 m in diameter15. Error bars represent counting statistics only. For comparison, we plot de-biased estimates of the near-Earth asteroid impact frequency based on all asteroid survey telescopic search data through mid- 2012 (green squares)8 and other earlier independently analysed telescopic datasets including NEAT discoveries (pink squares) and finally from the Spacewatch (blue squares) survey, where diameters are determined assuming an albedo of 0.1. Energy for telescopic data is computed assuming a mean bulk density of 3000 kgm-3 and average impact velocity of 20.3 kms-1. The intrinsic impact frequency for these telescopic data was found using an average probability of impact for NEAs as 2×10⁻⁹ per year for the entire population. Lunar crater counts converted to equivalent impactor flux and assuming a geometric albedo of 0.25 (grey solid line) are shown for comparison9, though we note that contamination by secondary craters and modern estimates of the NEA population which suggest lower albedos will tend to shift this curve to the right and down. Finally, we show estimated influx from global airwave measurements conducted from 1960-1974 which detected larger (5-20m) bolide impactors (upward red triangles) using an improved method for energy estimation compared to earlier interpretations of these same data.

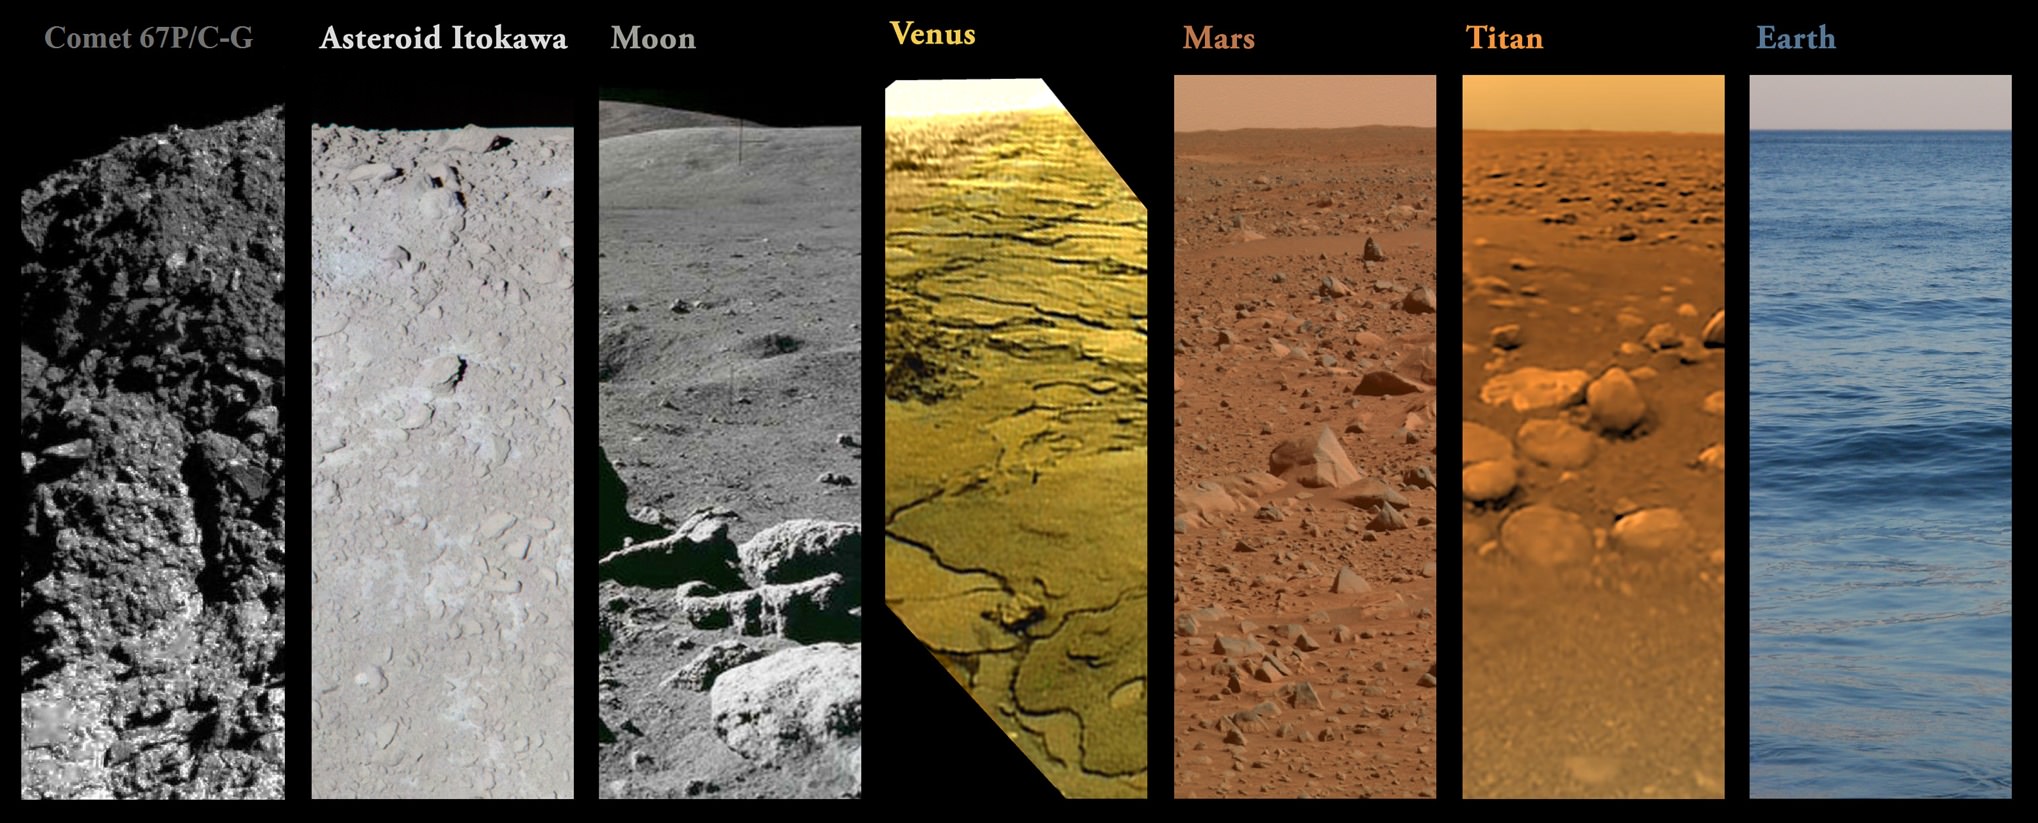
Comet Landing: Side-By-Side Pics Of Alien Surfaces Humanity Explored

As of November 2014, these are all of the planetary, lunar and small body surfaces where humanity has either lived, visited, or sent probes to. Composition by Mike Malaska, updated by Michiel Straathof. Image credits: Comet 67P/C-G [Rosetta/Philae]: ESA / Rosetta / Philae / CIVA / Michiel Straathof. Asteroid Itokawa [Hayabusa]: ISAS / JAXA / Gordan Ugarkovic. Moon [Apollo 17]: NASA. Venus [Venera 14]: IKI / Don Mitchell / Ted Stryk / Mike Malaska. Mars [Mars Exploration Rover Spirit]: NASA / JPL / Cornell / Mike Malaska. Titan [Cassini-Huygens]: ESA / NASA / JPL / University of Arizona. Earth: Mike Malaska

Correction, 11:33 a.m. EST: The University of Central Florida’s Phil Metzger points out that the image composition leaves out Eros, which NEAR Shoemaker landed on in 2001. This article has been corrected to reflect that and to clarify that the surfaces pictured were from “soft” landings.

And now there are eight. With Philae’s incredible landing on a comet earlier this week, humans have now done soft landings on eight solar system bodies. And that’s just in the first 57 years of space exploration. How far do you think we’ll reach in the next six decades? Let us know in the comments … if you dare.

More seriously, this amazing composition comes courtesy of two people who generously compiled images from the following missions: Rosetta/Philae (European Space Agency), Hayabusa (Japan Aerospace Exploration Agency), Apollo 17 (NASA), Venera 14 (Soviet Union), the Spirit rover (NASA) and Cassini-Huygens (NASA/ESA). Omitted is NEAR Shoemaker, which landed on Eros in 2001.

Before Philae touched down on Comet 67P/Churyumov–Gerasimenko Wednesday, the NASA Jet Propulsion Laboratory’s Mike Malaska created a cool infographic of nearly every place we’ve lived or visited before then. This week, Michiel Straathof updated the infographic to include 67P (and generously gave us permission to use it.)

And remember that these are just the SURFACES of solar system bodies that we have visited. If you include all of the places that we have flown by or taken pictures from of a distance in space, the count numbers in the dozens — especially when considering prolific imagers such as Voyager 1 and Voyager 2, which flew by multiple planets and moons.

To check out a small sampling of pictures, visit this NASA website that shows some of the best shots we’ve taken in space.

‘Double Earths’ Could Be Fun Exoplanets To Hunt For — If They Exist

Artist's conception of binary Earths. Credit: NASA

One big driver in the search for exoplanets is whether life can exist elsewhere in the Universe. In fact, a major goal of the Kepler space telescope is to discover an Earth-like planet in the habitable zone of a star like our Sun.

But what about having two Earths orbiting close to each other for billions of years? Is this even possible? A new study suggests that yes, this could happen. Imagine the implications for planetary searches if a double Earth is possible.

With current technology it’s hard to spot an Earth-sized planet, let alone resolve two, but if such planets exist it presents interesting questions. Could they be habitable? How do they form? More study is needed.

The study says double Earths can happen if they form at least half a Sun-Earth distance from their star. In what scientists say is the first-ever study considering binary Earths they suggest a scenario where two rocky bodies get close to each other early in their Solar System’s formation. They don’t collide (such as what likely formed our Moon), but they’re close enough to be within three or so radii of each other.

Artist's conception of two celestial bodies smacking into each other. Such a collision is believed to have formed Earth's moon. Credit: NASA/JPL-Caltech
Artist’s conception of two celestial bodies smacking into each other. Such a collision is believed to have formed Earth’s moon. Credit: NASA/JPL-Caltech

“There is a good reason to believe terrestrial binary planetary systems may be possible,” read a press release from the California Institute of Technology. “In a grazing collision the angular momentum is too high to be contained within a single rotating body (it would fission) and if the bodies barely touch then they could retain their identity. However, it requires an encounter where the bodies are initially approaching each other at low enough velocity.”

Scientists simulated these planetary encounters using a simulation, dubbed Smooth Particle Hydrodynamics, which has been used in the past for scenarios such as the collision that created the Moon. The scenarios showed that a collision between two Earth-sized planets would only produce a Moon. However, if the bodies came close enough to produce tidal distortion on each other, the planets could form a binary system.

The research was presented at the Division for Planetary Sciences meeting of the American Astronomical Society this week by undergraduate Keegan Ryan, graduate student Miki Nakajima, and planetary science researcher David Stevenson, all of the California Institute of Technology. A press release did not disclose plans for publication, or if the research is peer-reviewed.

Source: California Institute of Technology

NASA’s Pathfinding Orion Rolls to Launch Pad, Hoisted atop Rocket for Maiden Blastoff

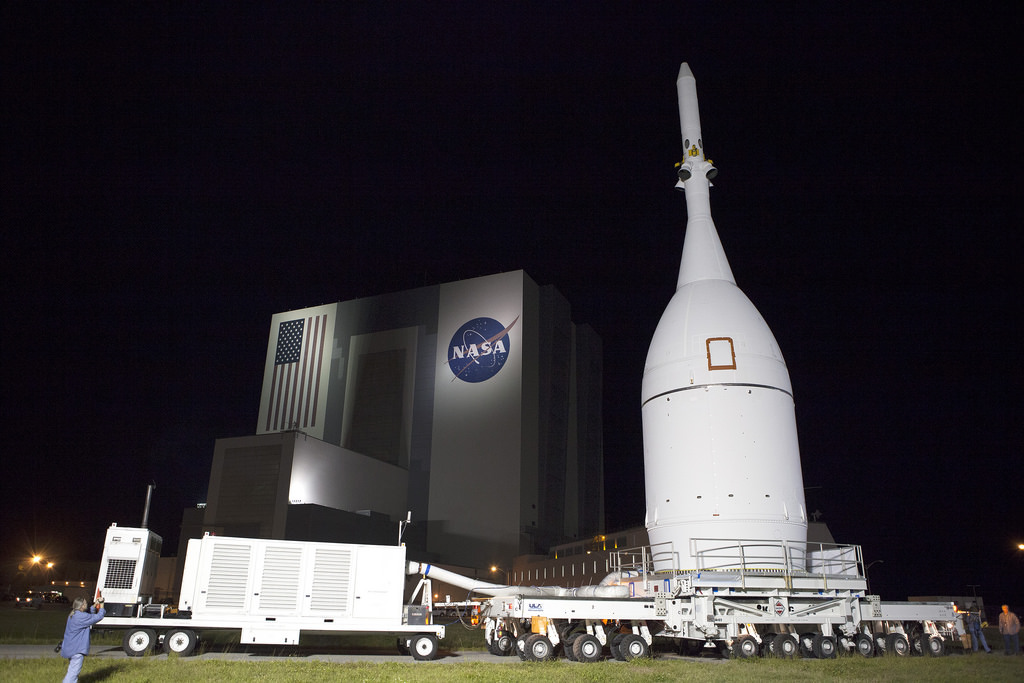
At NASA's Kennedy Space Center in Florida, the agency's Orion spacecraft pauses in front of the spaceport's iconic Vehicle Assembly Building as it is transported to Launch Complex 37 at Cape Canaveral Air Force Station. After arrival at the launch pad, United Launch Alliance engineers and technicians will lift Orion and mount it atop its Delta IV Heavy rocket. Credit: NASA/Frankie Martin

After years of effort, NASA’s pathfinding Orion spacecraft was rolled out to the launch pad early this morning, Wednesday, Nov. 12, and hoisted atop the rocket that will blast it to space on its history making maiden test flight in December.

Orion’s penultimate journey began late Tuesday, when the spacecraft was moved 22 miles on a wheeled transporter from the Kennedy Space Center assembly site to the Cape Canaveral launch site at pad 37 for an eight hour ride.

Watch a timelapse of the journey, below:

Technicians then lifted the 50,000 pound spacecraft about 200 feet onto a United Launch Alliance Delta IV Heavy rocket, the world’s most powerful rocket, in preparation for its first trip to space.

Orion’s promise is that it will fly America’s astronauts back to deep space for the first time in over four decades since the NASA’s Apollo moon landing missions ended in 1972.

Liftoff of the state-of-the-art Orion spacecraft on the unmanned Exploration Flight Test-1 (EFT-1) mission is slated for December 4, 2014, from Space Launch Complex 37 (SLC-37) at Cape Canaveral Air Force Station in Florida.

“This is the next step on our journey to Mars, and it’s a big one,” said William Gerstenmaier, NASA’s associate administrator for human exploration and operations.

“In less than a month, Orion will travel farther than any spacecraft built for humans has been in more than 40 years. That’s a huge milestone for NASA, and for all of us who want to see humans go to deep space.”

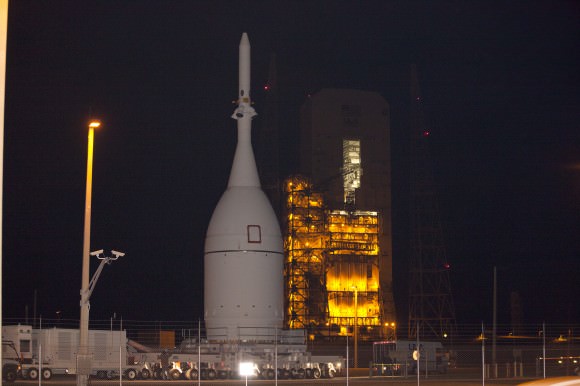
NASA's Orion spacecraft arrived at Space Launch Complex 37 at Cape Canaveral Air Force Station to complete its 22 mile move from the agency’s Kennedy Space Center in Florida. Orion is the exploration spacecraft designed to carry astronauts to deep space destinations, including an asteroid and on the journey to Mars. It will have emergency abort capability, sustain the crew during space travel and provide safe re-entry from deep space return velocities. The first uncrewed flight test of Orion is scheduled to launch Dec. 4, 2014 atop a United Launch Alliance Delta IV Heavy rocket. Credit:  NASA/Kim Shiflett
NASA’s Orion spacecraft arrived at Space Launch Complex 37 at Cape Canaveral Air Force Station to complete its 22 mile move from the agency’s Kennedy Space Center in Florida. Orion is the exploration spacecraft designed to carry astronauts to deep space destinations, including an asteroid and on the journey to Mars. It will have emergency abort capability, sustain the crew during space travel and provide safe re-entry from deep space return velocities. The first uncrewed flight test of Orion is scheduled to launch Dec. 4, 2014, atop a United Launch Alliance Delta IV Heavy rocket. Credit: NASA/Kim Shiflett

Orion is NASA’s next generation human rated vehicle that will eventually carry America’s astronauts beyond Earth on voyages venturing farther into deep space than ever before – beyond the Moon to Asteroids, Mars, and other destinations in our Solar System.

The fully assembled Orion vehicle stack consists of the crew module, service module, launch abort system, and adapter that connect it to the Delta IV Heavy rocket. It was completed in October inside Kennedy’s Launch Abort System Facility.

Today’s move was completed without issue after a one day delay due to storms in the KSC area.

The triple barreled Delta IV Heavy booster became the world’s most powerful rocket upon the retirement of NASA’s Space Shuttle program in 2011 and is the only rocket sufficiently powerful to launch the Orion EFT-1 spacecraft.

The two-orbit, four and a half hour EFT-1 flight will lift the Orion spacecraft and its attached second stage to an orbital altitude of 3,600 miles, about 15 times higher than the International Space Station (ISS) – and farther than any human spacecraft has journeyed in 40 years.

Orion will travel almost 60,000 miles into space during the uncrewed Dec. 4 test flight.

Stay tuned here for Ken’s continuing Orion and Earth and planetary science and human spaceflight news.

Ken Kremer