Fires in the Sky, Fires on the Ground

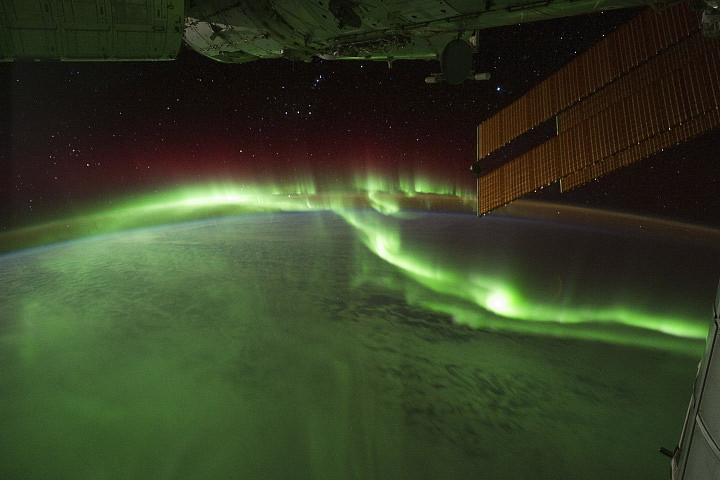
The aurora australis seen from the ISS on September 17, 2011. Credit: NASA.


[/caption]

With all of the activity that’s been occurring on the Sun recently, the aurorae have been exceptionally bright and have created quite a show to viewers – both on Earth as well as above it!

The image above was taken over the southern Indian Ocean by astronauts aboard the International Space Station. The southern lights – a.k.a. aurora australis – glow bright green and red in the upper layers of the atmosphere, creating a dazzling aerial display. (Click here to watch a movie of this.)

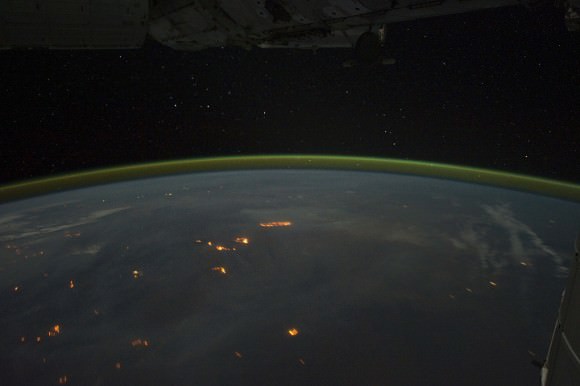
Shortly after, fires can be seen on the ground as the ISS passes over Australia:

Wildfires in Australia seen from orbit. Credit: NASA.

From NASA’s Earth Observatory website:

Astronauts on the International Space Station (ISS) used a digital camera to capture several hundred photographs of the aurora australis, or “southern lights,” while passing over the Indian Ocean on September 17, 2011. You can see the flowing ribbons and rays below as the ISS passed from south of Madagascar to just north of Australia between 17:22 and 17:45 Universal Time. Solar panels and other sections of the ISS fill some of the upper right side of the photograph.

Auroras are a spectacular sign that our planet is electrically and magnetically connected to the Sun. These light shows are provoked by energy from the Sun and fueled by electrically charged particles trapped in Earth’s magnetic field, or magnetosphere. In this case, the space around Earth was stirred up by an explosion of hot, ionized gas from the Sun — a coronal mass ejection — that left the Sun on September 14, 2011.

In the second image above, and in the last frames of the movie, light from the ground replaces the light show in the sky. Wildfires and perhaps some intentionally set agricultural fires burn on the continent of Australia,with smoke plumes faintly visible in the night sky. A gold and green halo of atmospheric airglow hangs above the horizon in the distance.

______________

Airglow is created by particles in the upper atmosphere that have been charged by UV light from the Sun during the day releasing the energy at night as greenish-yellow visible light.

Fires on the ground, fires in the sky… the stars blazing all around, the Sun in its full glory and a never-ending view of our entire planet… what an incredible place the ISS must be to work in! Absolutely amazing!

And the skies of night were alive with light, with a throbbing, thrilling flame; Amber and rose and violet, opal and gold it came. It swept the sky like a giant scythe, it quivered back to a wedge; Argently bright, it cleft the night with a wavy golden edge.

— “The Ballad of the Northern Lights”, Robert Service

Read more on the NASA Earth Observatory.

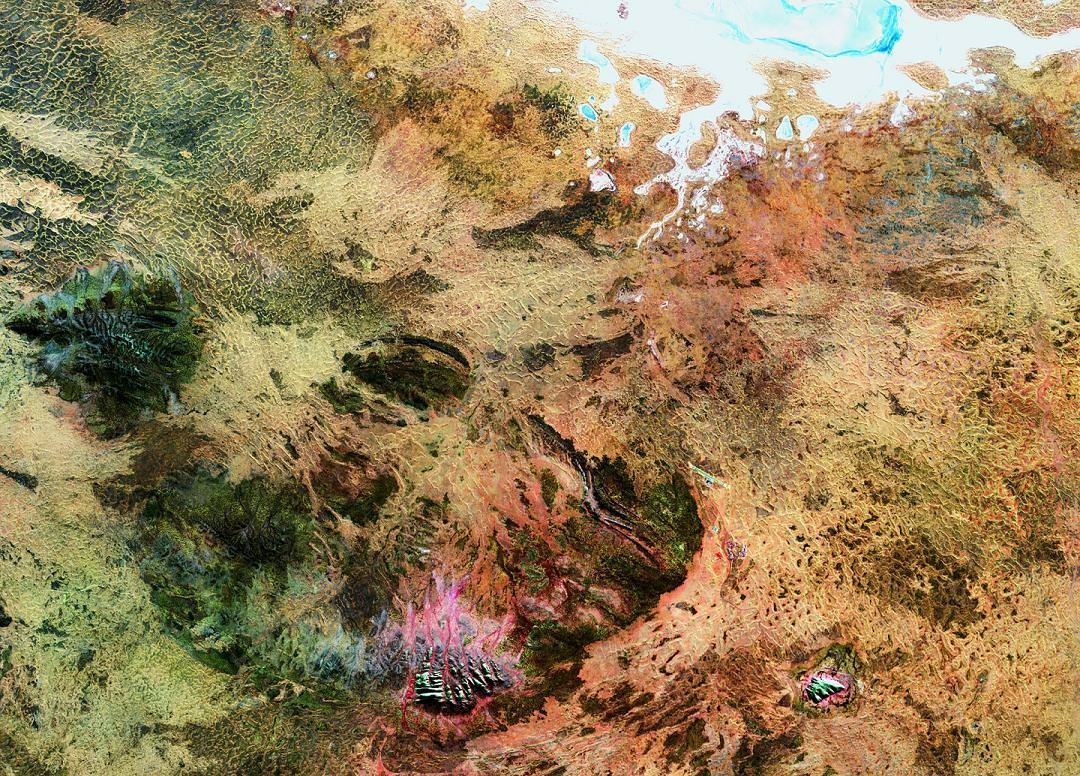
Seen From Space: Sacred Rocks Of The Outback

Landsat 5 Image - Credits: USGS

[/caption]

Is this a close-up of what’s in that long forgotten plastic container you found on the back shelf of your refrigerator? No. It’s a Landsat 5 image of some of the most sacred areas in the Australian Outback. Let’s learn what they are…

The big picture is the Amadeus Basin – a sprawling area which covers much of the southern quarter of the Northern Territory and extends about 150 km into Western Australia. At the top of the image, you’ll see the salty Lake Amadeus. But looks here can be deceiving. Most of the time it isn’t a lake by traditional standards… it’s a huge salt deposit that awaits rainfall to become fluid.

The “bumps” at the center of the bottom of the image is Kata Tjuta, with its tallest peak being Mount Olga. Here the Pitjantjatjara Dreamtime legends begin, with nighttime ceremonies not revealed to outsiders. These legends are very beautiful and the formations echo their sentiments. Forty kilometres east of Kata Tjuta (and to the right) is one of the oldest formations on Earth – Ayers Rock – known to the Aboriginals as Uluru.

Ayers Rock by Joe Brimacombe

Formed some 500 million years ago when an ocean still covered the area, Uluru is thought of as the center of creation… not hard to imagine given that its singularity rises 1,142 feet above the desert and the base is an amazing 5 miles around. Ayers Rock consists of cave-covered walls with deep runnels caused by perpetual erosion. Aboriginal legend has it that the blood-red Uluru arose from the ocean in protest of war.

Perhaps a legend we’d all do well to listen to, eh?

Original Image: ESA – Observing Earth. Many thanks to the incomparable Joe Brimacombe for the use of his Ayers Rock image. Be sure to visit Joe’s Ayers Rock Area photo pages!

Report Earthquakes for Science!

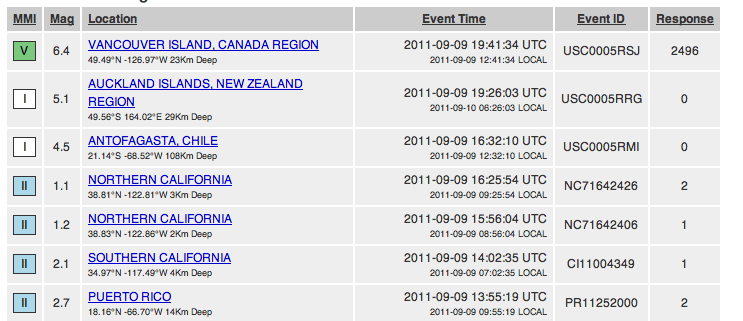
We had a bit of a trembler here at Universe Today headquarters on Vancouver Island. According to the USGS, it was 6.4 magnitude, and the epicenter was located about 150 km from my house. It wasn’t the most severe earthquake I’ve felt, but there was no question… that was an earthquake.

Twitter user @OzoneVibe was good enough to pass along a link so I could report my experience for Science! The USGS provides a questionnaire for every earthquake so you can give your details about the shaking, any damage, etc. Here’s the one created for the Vancouver Island earthquake.

If you’re caught in an earthquake in the future, do a Google search for “did you feel it“. Then you can report your own experience and help geologists better understand earthquakes.

Now I’ve got to prepare for my kids coming home from school – they’ll hammer me with questions. I’m sure we’re going to be doing earth science late into the evening.

It Turns Out Some Borders *Are* Visible from Space

This picture shows the illuminated man-made border between India and Pakistan,the line snaking through the landscape, as seen from the International Space Station on August 21, 2011. Of the hundreds of clusters lights, the largest are the capital cities of Islamabad, Pakistan, and New Delhi, India. Credit: NASA/Ron Garan

[/caption]

There is an oft-repeated and perhaps beautiful saying that you can’t see political borders from space. Well, it turns out that saying isn’t true; not anymore. ISS astronaut Ron Garan took this image recently which clearly shows the border between India and Pakistan. Since 2003, India has illuminated the border with Pakistan by floodlights in attempt to prevent ammunition trafficking and the infiltration of terrorists.

“Since the beginning of human spaceflight fifty years ago, astronauts have reflected on how peaceful, beautiful, and fragile the Earth looks from space,” Garan wrote on his Fragile Oasis blog. “These reflections are not clichés that astronauts say because it feels good. It is truly moving to look at the Earth from space.”

But seeing this clearly visible political border was sobering for Garan and his crewmates.

“Realizing what this picture depicted had a big impact on me,” he said. “When viewed from space, Earth almost always looks beautiful and peaceful. However, this picture is an example of man-made changes to the landscape in response to a threat, clearly visible from space. This was a big surprise to me.”

Garan added, however, that the point here is not that we can look down at the Earth and see a man-made border between India and Pakistan. “The point is that we can look down at that same area and feel empathy for the struggles that all people face,” he said. “We can look down and realize that we are all riding through the Universe together on this spaceship we call Earth, that we are all interconnected, that we are all in this together, that we are all family.”

Garan said he believes our world is a place where possibilities are limited only by our imagination and our will to act. “It is within our power to eliminate the suffering and poverty that exist on our planet,” he said.

Read more on Fragile Oasis.

Exploring Geomagnetic Substorms

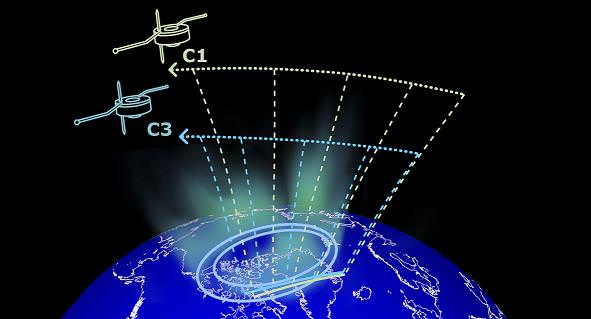
Schematic view of Cluster C3 and C1 satellite trajectories Copyright: ESA

[/caption]

Every now and again, a sudden pulse of energy in Earth’s magnetosphere just cuts loose. As a result, we have a bright polar auroral display. While we’re beginning to understand more about magnetism and the Sun/Earth connection, there’s still a few rogues left in the gallery. Just what is a geomagnetic substorm and what does it do?

Although we’ve known about them for years, the exact process behind a geomagnetic substorm has been a mystery… one that’s being solved with data from missions like ESA’s Cluster spacecraft. Earth is continually being bathed in incoming sheets of electrons and protons – the product of an active Sun. These highly energized particles are simply a part of solar winds flowing from coronal holes and even powerful blasts from events like coronal mass ejections. For the most part, we’re shielded by the magnetosphere – but sometimes a wee bit escapes and collects in the magnetotail – stored like a battery charge. At a point, it’s released… and when it does, it re-arranges our magnetic field lines. The energy then conducts itself along these lines like a filament in a light bulb. When the watts hit the fan? Wow… We have polar aurora!

It’s not a new concept, but there’s never been a clear understanding of where these geomagnetic storms originate. Do they come from a sudden disruption of electric current about 64 000 km from the planet? Or are the created by a process called magnetic reconnection which occurs much further down the magnetotail, at a distance of around 125 000 – 200 000 km? If you remember our recent study of Alfven waves, then you know current consensus points towards the reconnection theory. But there’s only one problem. Alfven waves are slow movers, traveling at a reconnection speed of about 250 seconds. What we’re seeing is an event that occurs about 60 seconds after reconnection… and the birth of a new movement. The kinetic Alfven wave (KAW).

“We ran a very simple system, and simulated how the reconnection event released energy in the plasma sheet of charged particles,” said Shay. “We were looking for a faster mechanism for propagating the signal from the explosion than the Alfven waves that were already widely recognized.”

Unlike its predecessor which motivates both ions and electrons, the KAW only excites the electron, moving them through the plasma at twice the speed. Through simulations, it’s been proved the kinetic Alfven wave could be spawned by reconnection, move away from the explosion and activate aurora. The data was returned by the Fluxgate Magnetometer (FGM) and the Electric Fields and Waves (EFW) instrument and found by Jonathan Eastwood, a Research Fellow at The Blackett Laboratory, Imperial College London.

“I found 18 events which occurred at the time the four spacecraft were flying through the tail region,” said Dr. Eastwood. “The fast signal predicted by Michael Shay showed up in the Cluster data, supporting the theory that kinetic Alfven waves generated by reconnection were rapidly energizing the auroras.”

“It’s rather like what happens in a thunderstorm,” he added. “The fast-moving lightning flash arrives first, followed some time later by the slower sound waves of the thunderclap.”

Fancy that… Coming from a substorm!

Original Story Source: ESA Science and Technology News. For Further Reading: Super-Alfvenic Propagation of Substorm Reconnection Signatures and Poynting Flux.

First Image Captured by NASAs Jupiter bound Juno; Earth – Moon Portrait

Earth & Moon Portrait - First Photo transmitted from Jupiter Bound Juno. This image of Earth (on the left) and the moon (on the right) was taken by NASA's Juno spacecraft on Aug. 26, 2011, when the spacecraft was about 6 million miles (9.66 million kilometers) away. It was taken by the spacecraft's onboard camera, JunoCam. Credit: NASA/JPL-Caltech

[/caption]

NASA’s solar powered Jupiter bound Juno orbiter has captured her first image – a beautiful portrait of the Earth & Moon – since the probe blasted off from the home planet.

Juno lifted off 25 days ago at 12: 25 p.m. on August 5 from Space Launch Complex 41 at Cape Canaveral Air Force Station in Florida. The spacecraft snapped the portrait with the onboard JunoCam camera on August 26 after journeying some 6 million miles (9.66 million km) from Earth and while traveling at a velocity of 77,600 miles per hour (124,900 kilometers per hour) relative to the sun.

“The image of the Earth Moon system is a rather unique perspective that we can get only by stepping outside of our home planet,” said Scott Bolton, Juno principal investigator, in an exclusive interview with Universe Today. Bolton is from the Southwest Research Institute in San Antonio.

“On our way to Jupiter, we’ve looked back at home and managed to take this amazing image.”

“Earth looking much like any other planet or star from a distance is glorious as this somewhat average looking “star” is home to all of humanity. Our companion, the moon, so beautiful and important to us, stands out even less.”

“We appear almost average and inconspicuous, yet all of our history originates here. It makes one wonder just how many other planets or solar systems might contain life like ours,” Bolton told me.

Juno casts a shadow back toward Earth and Space Shuttle Launch Pad 39A and the shuttle crawler way (at left) seconds after liftoff from adjacent Launch Pad 41 at Cape Canaveral, Florida. View from the VAB Roof. Credit: Ken Kremer

The Juno team commanded the probe to take the image as part of the checkout phase of the vehicles instruments and subsystems.

“The JunoCam instrument turn on and check out were planned activities. The instrument is working great and in fact, all the instruments that we’ve turned on thus far have been working great,” Bolton added.

So far the spacecraft is in excellent health and the team has completed the checkout of the Waves instrument and its two Flux Gate Magnetometer sensors and deployment of its V-shaped electric dipole antenna.

“We have a couple more instruments still to do,” Bolton noted.

The team reports that Juno also performed its first precession, or reorientation maneuver, using its thrusters and that the first trajectory control maneuver (TCM-1) was cancelled as unnecessary because of the extremely accurate targeting provided by the Atlas V rocket.

The portrait shot is actually not Juno’s last photo of her home.

The 8000 pound (3,600 kilogram) probe will fly by Earth once more on October 9, 2013 for a gravity assisted speed boost of 16,330 MPH (7.3 km/sec) to accelerate Juno past the asteroid belt on its long journey to the Jovian system.

Juno soars skyward to Jupiter on Aug. 5 from launch pad 41 at Cape Canaveral Air Force Station at 12:25 p.m. EDT. View from the VAB roof. Credit: Ken Kremer

JunoCam will collect new photos and the other science instruments will make measurements as Juno cartwheels past Earth during the slingshot to Jupiter.

Juno is on a 5 year and 1.7 Billion mile (2.8 Billion km) trek to the largest planet in our solar system. When she arrives at Jupiter on July 4, 2016, Juno will become the first polar orbiting spacecraft at the gas giant.

During a one year science mission – entailing 33 orbits lasting 11 days each – the probe will plunge to within about 3000 miles (5000 km) of the turbulent cloud tops and collect unprecedented new data that will unveil the hidden inner secrets of Jupiter’s genesis and evolution.

The goal is to find out more about the planets origins, interior structure and atmosphere, observe the aurora, map the intense magnetic field and investigate the existence of a solid planetary core.

“This is a remarkable sight people get to see all too rarely,” said Bolton in a NASA statement about the Earth-Moon photo. “This view of our planet shows how Earth looks from the outside, illustrating a special perspective of our role and place in the universe. We see a humbling yet beautiful view of ourselves.”

NASA’s Jet Propulsion Laboratory manages the Juno mission. The spacecraft was designed and built by Lockheed Martin Space Systems, Denver.

Juno and Booster Streak Across the Stars
NASA's Juno spacecraft and its spent Centaur upper rocket stage are captured in this telescope view as they move across the field of stars. The five-minute, timed exposure was acquired on Aug. 5 11:18pm Eastern time (Aug. 6 at 3:18 UTC) when Juno was at a distance of about 195,000 miles (314,000 kilometers) from Earth. The images were taken remotely by amateur astronomer Scott Ferguson using Global Rent-a-Scope's GRAS-016 Takahashi Widefield Refractor, which is located in Nerpio, Spain. Credit: Scott Ferguson
Juno Spacecraft Cruise Trajectory to Jupiter
This graphic shows Juno's trajectory, or flight path, from Earth to Jupiter. The spacecraft travels around the Sun, to a point beyond the orbit of Mars where it fires its main engine a couple of times. These deep space maneuvers set up the Earth flyby maneuver that occurs approximately two years after launch. The Earth flyby gives Juno the boost in velocity it needs to coast all the way to Jupiter. Juno arrives at Jupiter in July 2016. Credit: NASA/JPL-Caltech
View of Juno’s position on Aug. 24, 2011 nearly 6 million miles distant from Earth visualized by NASA’s Eyes on the Solar System website.

Read my continuing features about Juno
Juno Blasts off on Science Trek to Discover Jupiter’s Genesis
Juno Jupiter Orbiter poised at Launch Pad for Aug. 5 Blastoff
JUNO Orbiter Mated to Mightiest Atlas rocket for Aug. 5 Blastoff to Jupiter
Solar Powered Jupiter bound JUNO lands at Kennedy Space Center

Deadly and Destructive Path of Hurricane Irene seen in NASA Videos and Images

Irene Makes Landfall Over New York. This GOES-13 satellite image is of Hurricane Irene just 28 minutes before the storm made landfall in New York City. The image shows Irene's huge cloud cover blanketing New England, New York and over Toronto, Canada. Shadows in Irene's clouds indicate the bands of thunderstorms that surrounded the storm. Credit: NASA/NOAA GOES Project

NASA Video Caption: The Life of Hurricane Irene from the Caribbean to Canada from August 21 through August 29 seen by NASA/NOAA satellites. Credit: NASA/NOAA/GOES/MODIS

The new NASA animation above shows the birth and subsequent destructive and deadly path followed by Hurricane Irene from August 21 through August 29, 2011 starting in the Caribbean, and then tracking along the US East Cost and up into Canada. The observations combine images taken by NASA and NOAA Earth orbiting satellites.

The cloud images were captured by the NASA/NOAA GOES-13 satellite and overlaid on a true-color NASA MODIS map. Irene followed a lengthy course over Puerto Rico, Hispaniola, the Bahamas, and then along the entire US East with landfalls over North Carolina, New Jersey and New York.

NASA ISS astronaut Ron Garan and cameras flying overhead aboard the International Space Station (ISS) also photographed vivid images showing the magnitude of Irene slamming into the US East coast.

Irene caused widespread property damage. Massive and raging flooding in several US states destroyed houses, crushed businesses and washed away bridges and roads and more. The worst flooding is yet to come to some inland portions of Vermont, New Jersey, New York, Pennsylvania and elsewhere as uncontrollable waters continue to rise at numerous rivers, lakes and even ponds, threatening even more misery in their wake.

[/caption]

So far 41 fatalities in 12 states have been attributed to Irene and more may be expected as searches continue. Some communities have been entirely cut off due to washed out access. Airlifts of food and water have begun. More people are being evacuated from New Jersey towns today, Aug 30.

Brave emergency rescue workers have put their own lives at peril and saved the lives of countless others of all ages from babies to the elderly. Some 8 million customers, including my area, lost power due to extensive flooding, downed trees and electrical wires, and devastated infrastructure.

Hurricane Irene twitpic from the International Space Station on 8/27/11 by NASA Astronaut Ron Garan
Irene From Space and the ISS as it crossed the coast on August 27, 2011 at 3:32pm EST. Hope everyone is OK wrote NASA Astronaut Ron Garan with his twitpic from the ISS. Credit: NASA/Ron Garan aboard the ISS

Emergency crews are hard at work to restore power as quickly as possible, but many thousands of homes and businesses could be without power for up to a week or more. About 3.3 million customers are still without power today.

NASA’s GOES-13 satellite captured a dramatic view of Hurricane Irene just 28 minutes prior to making landfall over New York City. Today’s NASA Image of the day shows the humongous cloud cover spanning the US East coast from the Mid-Atlantic States up to New Jersey, New York, Pennsylvania, and New England and into Toronto, Canada.

This GOES-13 image from Monday, August 29 at 7:45 a.m. EDT shows an active Atlantic Ocean with the remnants of Hurricane Irene moving into Quebec and Newfoundland (left), Tropical Storm Jose (center) and newly formed Tropical Depression 12 (right). Credit: NASA/NOAA GOES Project
Irene slams into North Carolina. The GOES-13 satellite saw Hurricane Irene on August 27, 2011 at 10:10 a.m. EDT after it made landfall at 8 a.m. in Cape Lookout, North Carolina. Irene's outer bands had already extended into New England. Credit: NASA/NOAA GOES Project

Many transit systems and airports in Irene’s path were shutdown ahead of the storm.

Send me your photos of Irene’s destruction to post at Universe Today.

Explosive Phytoplankton Bloom Seen From Space

Phytoplankton bloom in the Barents Sea. Credit: NASA/Moderate Resolution Imaging Spectroradiometer (MODIS) on the Aqua satellite

[/caption]

Phytoplankton are tiny, microscopic plant-like organisms, but when they get together and start growing they can cover hundreds of square kilometers and be easily visible in satellite images. This image of the Barents Sea was taken on August 14, 2011 by the Moderate Resolution Imaging Spectroradiometer (MODIS) on the Aqua satellite. When conditions are right, phytoplankton populations can grow explosively, a phenomenon known as a bloom. A bloom may last several weeks, but the life span of any individual phytoplankton is rarely more than a few days. The area in this image is immediately north of the Scandinavian peninsula. Blooms spanning hundreds or even thousands of kilometers occur across the North Atlantic and Arctic Oceans every year. But, said Jeff Schmaltz from NASA’s Earth Observatory website, seeing such a wide area without clouds during the bloom is a rare treat.

Phytoplankton thrive in cold ocean waters, which tend to be rich in nutrients. Schmaltz said the milky blue color is an indicator that the bloom probably contains coccolithophores, which are plated with white calcium carbonate. Seen through ocean water, a coccolithophore bloom is bright blue. Other shades may be from other species of phytoplankton.

Source: NASA’s Earth Observatory website

Geodesy Is Alive And Well… And Splitting Hairs On Planet Earth

This view of Earth comes from NASA's Moderate Resolution Imaging Spectroradiometer aboard the Terra satellite. Image credit: NASA

[/caption]

When it comes to planet Earth, it’s very important to know if we’re growing or shrinking. While plate tectonics are responsible for major changes in our planet’s outer crust, we need to have accurate measurements of our atmosphere and magnetic fields, too. To make these appraisals accurate, the global science community established the International Terrestrial Reference Frame.

At one time scientists theorized that Earth might be expanding or contracting. After all, major events like volcanoes, landslides and ice sheets were at the root of significant elevation changes. Even sizable climate events like El Nino and La Nina are responsible for redistributing large amounts of water. Now a new NASA study, published recently in Geophysical Research Letter, has pointed towards the utilization of space measurement tools and a new data calculation techniques which show no vital changes in the size of our planet.

Why is monitoring our size so important? The International Terrestrial Reference Frame is not only important for ground navigation, but satellite tracking as well. NASA says to think of it this way: “If all of Earth’s GPS stations were located in Norway, their data would indicate that Earth is growing, because high-latitude countries like Norway are still rising in elevation in response to the removal of the weight of Ice Age ice sheets.” So for all intents and purposes, the ITRF uses the average center of mass of the total Earth, a computation of a quarter of a century of satellite data. High-precision space geodesy includes:

  • Satellite Laser Ranging — a global observation station network that measures, with millimeter-level precision, the time it takes for ultrashort pulses of light to travel from the ground stations to satellites specially equipped with retroreflectors and back again.
  • Very-Long Baseline Interferometry — a radio astronomy technology that combines observations of an object made simultaneously by many telescopes to simulate a telescope as big as the maximum distance between the telescopes.
  • Global Positioning System — the U.S.-built space-based global navigation system that provides users around the world with precise location and time information.
  • Doppler Orbitography and Radiopositioning Integrated by Satellite — a French satellite system used to determine satellite orbits and positioning. Beacons on the ground emit radio signals that are received by satellites. The movement of the satellites causes a frequency shift of the signal that can be observed to determine ground positions and other information.

A team of scientists led by Xiaoping Wu of NASA’s Jet Propulsion Laboratory, Pasadena, Calif., and including participants from the Institut Geographique National, Champs-sur-Marne in France, and Delft University of Technology in The Netherlands are currently busy assessing the accuracy of the International Terrestrial Reference Frame. Through the use of the new data and calculation techniques combined with measurements of Earth’s gravity from NASA’s Gravity Recovery and Climate Experiment (GRACE) spacecraft and models of ocean bottom pressure, they are even able to account for minute changes in Earth’s gravity. The resultant changes have shown Earth’s radius to vary about 0.004 inches (0.1 millimeters) – or less than the thickness of a human hair.

“Our study provides an independent confirmation that the solid Earth is not getting larger at present, within current measurement uncertainties,” said Wu.

Original Story Source: JPL News.

Ring Of Anti-Protons Found Encircling Earth

PAMELA team and detector in Rome before launch. Photo courtesy of the PAMELA Experiment

[/caption]

When it comes to planets with rings, we know the answer: Jupiter, Saturn, Uranus, and Neptune. But new findings from the PAMELA experiment show that Earth has a ring system, too… One made up of geomagnetically trapped cosmic ray antiprotons.

“The existence of a significant flux of antiprotons confined to Earth’s magnetosphere has been considered in several theoretical works.” says team leader, O. Adriani of the University of Florence Department of Physics. “These antiparticles are produced in nuclear interactions of energetic cosmic rays with the terrestrial atmosphere and accumulate in the geomagnetic field at altitudes of several hundred kilometers.”

The PAMELA experiment – short for Payload for Antimatter Exploration and Light-nuclei Astrophysics – is based on an international collaboration involving about 100 physicists. Its state-of-the-art equipment was designed to investigate the nature of dark matter, the apparent absence of cosmological antimatter and the origin and evolution of matter in the galaxy. Utilizing a permanent magnet spectrometer with a variety of specialized detectors, PAMELA whips around Earth on a highly inclined orbit.

“The satellite orbit (70 degree inclination and 350–610 km altitude) allows PAMELA to perform a very detailed measurement of the cosmic radiation in different regions of Earth’s magnetosphere, providing information about the nature and energy spectra of sub-cutoff particles.” says Adriani. “The satellite orbit passes through the South Atlantic Anomaly (SAA), allowing the study of geomagnetically trapped particles in the inner radiation belt.”

From its subdetectors, PAMELA dished up a serving of antiprotons, but it wasn’t an easy job. “Antiprotons in the selected energy range are likely to annihilate inside the calorimeter, thus leaving a clear signature.” says the team. “The longitudinal and transverse segmentation of the calorimeter is exploited to allow the shower development to be characterized. These selections are combined with dE/dx measurements from individual strips in the silicon detector planes to allow electromagnetic showers to be identified with very high accuracy.”

For 850 days, the detectors collected data and compared it against simulations. The trapped antiprotons were highly dependent on angular collection, directional response function on the satellite orbital position and on its orientation relative to the geomagnetic field. “All the identified antiprotons, characterized by a pitch angle near 90 deg, were found to spiral around field lines, bounce between mirror points, and also perform a slow longitudinal drift around the Earth, for a total path length amounting to several Earth radii.” said the team. “PAMELA results allow CR transport models to be tested in the terrestrial atmosphere and significantly constrain predictions from trapped antiproton models, reducing uncertainties concerning the antiproton production spectrum in Earth’s magnetosphere.”

Original Story Source: Astrophysical Journal Newsletters.