World Needs to Aim for Near-Zero Carbon Emissions

traffic1.thumbnail.jpg

If we really want to combat climate change, how much carbon can we reasonably generate? How much will still push temperatures up? The current presidential candidates are all calling for serious carbon reductions over the next 40 years, but according to researchers at the Carnegie Institution for Science, it’s not enough. To really stabilize our planet’s climate, we need to get away from carbon forever.

In a recent article, published in latest issue of Geophysical Research Letters, climate scientists used a detailed Earth system model to simulate what might happen to the Earth’s climate at various levels of carbon emissions.

What’s the most carbon you can generate and not warm the planet?

“Most scientific and policy discussions about avoiding climate change have centered on what emissions would be needed to stabilize greenhouse gases in the atmosphere,” said Ken Caldeira. “But stabilizing greenhouse gases does not equate to a stable climate. We studied what emissions would be needed to stabilize climate in the foreseeable future.”

They ran various scenarios through the climate model, each time reducing the amount of carbon emissions. Even at the lowest levels, there was an increment of warming. In other words, until humans generate next to zero carbon emissions, there will be increased warming. There’s no amount that the planet can absorb on a regular basis.

Once the carbon emissions in the simulation hit zero, the levels of carbon dioxide in the atmosphere finally started to drop, getting absorbed into various carbon sinks such as the oceans and land vegetation. Even so, global temperatures remained high for at least 500 years after the end of carbon emissions.

The big worry are the climate tipping points. These are temperatures that might cause runaway processes that can’t be stopped, such as the melting of the Arctic sea ice. If the world hits some point of severe climate instability, people might need to cut their carbon emissions to the absolute minimum.

And according to this research, that’s essentially zero.

Although eliminating carbon dioxide emissions seems like a radical idea, the researchers see it as a reasonable goal.

“It is just not that hard to solve the technological challenges. We can develop and deploy wind turbines, electric cars, and so on, and live well without damaging the environment. The future can be better than the present, but we have to take steps to start kicking the CO2 habit now, so we won’t need to go cold turkey later.”

Original Source: CIS News Release

Human Damage to World Oceans Mapped, 40% “Strongly Impacted”

oceanmap_article.thumbnail.jpg

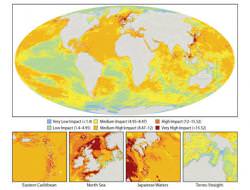
If we needed any more proof that we as a race are damaging the worlds oceans, for the first time, our impact has been mapped by new study to be published in Science. It makes for uncomfortable viewing. Taking 17 known types of human impact on marine ecosystems, this new research suggests that only 4% of the oceans are relatively untouched, whilst 40% are strongly impacted by human activity. The most impacted marine ecosystems include the North Sea, the South and East China Seas, the Caribbean, the Mediterranean, the Red Sea, the Gulf, the Bering Sea, the East coast of North America and in much of the western Pacific.

The new, high-resolution map of predominantly yellow regions and red dots could be mistaken for a global temperature map. However, this map is the first of its kind, mapping damaging human activity in the worlds oceans. At first glance it is obvious that most of the oceans have been affected in some way by the continued onslaught of human activity, with only the Polar Regions holding some of the most pristine and untouched seas. These are about the only portions of the map where the reach of human activity cannot grasp, but as global warming increases, the protective ice-sheets are likely to reveal more sea for humankind to exploit.

This new research was released today at the AAAS Annual Meeting and will be published in the February 15th issue of Science. The scientists behind this study are attending a special three day seminar on “Managing Threats to Marine Ecosystems”. Although this work highlights the concerns about damage to our oceans, it may also aid future efforts to preserve areas of low human impact and will help us identify the worst affected regions.

Whether one is interested in protecting ocean wilderness, assessing which human activities have the greatest impact, or prioritizing which ecosystem types need management intervention, our results provide a strong framework for doing so.” – Kimberly Selkoe of the National Center for Ecological Analysis and Synthesis (NCEAS) in Santa Barbara, CA and the University of Hawaii.

The map was created by dividing the Earths oceans into a grid of 1km×1km squares. The 17 contributing human factors were identified (including fishing, coastal development, fertiliser runoff and pollution from shipping traffic) and the extent at which each grid-point was influenced by each contributing factor was calculated. An “impact score” was then allocated at each location to rate how 20 different types of ecosystem are affected by each factor. It was found that an astonishingly high 41% of the oceans had medium-high to high impact ratings. 0.5% had very high impact ratings, representing 2.2 million square km (850,000 square miles).

Although these results may seem grim, it is the first chance scientists have had to evaluate the worst affected oceans, and many appear upbeat about managing the oceans better, preserving what is left of our pristine seas.

Our results show that when these and other individual impacts are summed up, the big picture looks much worse than I imagine most people expected. It was certainly a surprise to me. […] With targeted efforts to protect the chunks of the ocean that remain relatively pristine, we have a good chance of preserving these areas in good condition.” – Ben Halpern, assistant research scientist at the University of California, Santa Barbara, research leader. “

Source: AAAS, Guardian Online

Microbes Make the Best Climate Engineers

3rockledge_600.thumbnail.jpg

With the rising threat of global warming, you’d think humans are the best (or worst) climate engineers to arrive on planet Earth. But you’d be wrong. Tiny microbes have been modifying our climate for billions of years, and unless we learn how to work with them, we could be fighting a losing battle to get our greenhouse emissions under control.

For example, humans release tremendous amounts of methane into the atmosphere. But we do this indirectly through our livestock, rice fields and landfill. In each of these situations, it’s actually microbes producing the methane that makes such a potent greenhouse gas. We just give the microbes the environment they need to make the stuff.

In fact, unless we deeply understand how these microbes do their work, we might be fighting a losing battle to control climate change. This is based on a commentary published in the February 2008 issue of Microbiology Today. The article was written by Dr Dave Reay from the University of Edinburgh.

Much of the carbon cycle in the world involves the oceans, which breath carbon dioxide in and out of the atmosphere. But once again, it’s microbes which are taking in carbon from the atmosphere and releasing it again.

The trick, of course, is to learn how to work with them. If scientists can better understand the processes that go on, they could encourage microbes to pull more carbon out of the atmosphere, or break up methane generated in landfills. Plankton are already being used as feedstock for some biofuels, and cyanobacteria could provide hydrogen fuel.

For example, the wetlands of the Earth dump 100 million tonnes of methane into the atmosphere every year. This number would be much higher, but a significant amount is used by methanotropic bacteria before it can escape into the atmosphere. Compare this to the 150 million tonnes delivered directly to the atmosphere by human methods, like rice cultivation.

As we warm the planet, we don’t know what impact microbes might play to slow, or maybe even accelerate our actions.

“The impact of these microbially-controlled cycles on future climate warming is potentially huge,” says Dr Reay. “Microbes will continue as climate engineers long after humans have burned that final barrel of oil. Whether they help us to avoid dangerous climate change in the 21st century or push us even faster towards it depends on just how well we understand them.”

Original Source: Microbiology Today

Recovering from a Mass Extinction is Slow Going

800px-lycaenops.thumbnail.jpg

With the diversity of life on Earth, and its ability to exploit every niche, you would think planet could bounce back from a devastating extinction event. Or maybe not. According to researchers from the University of Bristol, life took a full 30 million years to recover from the Permian extinction.

The poor animals alive during the Permian extinctions were struck by three waves of disaster. The largest of these happened at the boundary between the Permian and Triassic periods around 251 million years ago. Geologists think it was caused by large-scale volcanism in Russia which produced the ‘Siberian Traps’ – vast regions of lava 200,000 square km (77,000 square miles) in area. In a geologic heartbeat, 90% of all life on Earth was completely wiped out: insects, planets, marine animals, amphibians, and reptiles… everything. Life never got so close to being completely wiped off the face of the Earth.

Life did bounce back quickly, but diversity didn’t. Instead of the rich ecosystems we see today, very opportunistic creatures filled the empty spaces left behind by the extinction. One example is Lystrosaurus, a hardy herbivore the size of a pig.

Sarda Sahney and Professor Michael Benton at the University of Bristol looked at the recovery of animals like amphibians and reptiles. Although these creatures did make a recovery quickly, it took 30 million years for the number of animals and their diversity to match the pre-extinction levels.

Sahney said: “Our research shows that after a major ecological crisis, recovery takes a very long time. So although we have not yet witnessed anything like the level of the extinction that occurred at the end of the Permian, we should nevertheless bear in mind that ecosystems take a very long time to fully recover.�

This is an important thought to consider now that we’re in one of the most rapid periods of species loss in history.

Original Source: University of Bristol

Regulating Traffic in the Final Frontier

debris.thumbnail.jpg

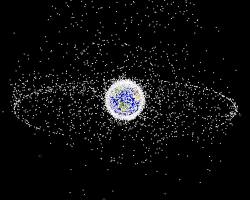
October of last year was the 50th anniversary of Sputnik, the first spacecraft to be launched into orbit. Since then, we’ve come a long, long way. Think of all the stuff that’s floating around our planet right now: GPS, television, and military satellites, the International Space Station and the Hubble telescope, and a host of debris. With more satellites and projects launching into space, the issue of regulating all of this space traffic is starting to become an issue.

Current regulations of space come from a series of treaties and agreements between nations and organizations, starting with the Outer Space Treaty created 40 years ago. But with private companies like Virgin Galactic merging into space traffic, as well as nations like Japan, India, and China, launching satellites and scientific spacecraft, the need for a defined set of regulations is in order.

“While the current state can be regarded as a “piecemeal engineering”, space traffic management would provide a regulatory “big bang”. Space traffic management would not tackle single issues, but regard the regulation of space activities as a comprehensive concept. This concept is based on functionality, aiming at the provision of a complete set of rules of the road for the current and future way,” wrote Kai-Uwe Schrogl of the European Space Policy Institute in a paper titled “Space traffic management: The new comprehensive approach for regulating the use of outer space – Results from the 2006 IAA cosmic study,” published in the most recent issue of Acta Astronautica.

Space law would be concerned with four areas: keeping tabs on the current space traffic, a system of notification between nations or companies planning launches and missions to space, comprehensive rules for traffic to follow and a way to enforce these rules.

Tracking and notifying are both important to help keep spacecraft from crashing into each other, and would improve the performance of those satellites able to make avoidance maneuvers of space debris. The ISS and Hubble both do this on a regular basis, but other satellites lack the ability to change their orbit on a, so minimizing and tracking the amount of space debris – at least in certain high-traffic areas in Earth’s orbit – is instrumental.

The organizations and means of implementing these rules are still being debated. Possibilities include the creation of World Space Organization, or placing the responsibilities on the shoulders of the existing International Civil Aviation Organization, which currently regulates the skies closer to Earth.

Schrogl writes that a comprehensive space law is a ways off, but the debate about what rules are needed – and how to go about keeping the increasing number of parties launching into space in check – is currently picking up speed. This means that you shouldn’t expect to see any space police pulling over NASA’s Atlantis Shuttle for littering anytime soon.

Source: Acta Astronautica

Study Shows More Antarctic Ice Loss

antarctica.thumbnail.jpg

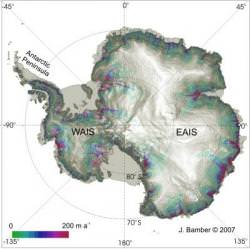
Increasing amounts of ice mass have been lost from West Antarctica and the Antarctic peninsula over the past ten years, according to a 10-year study from the University of Bristol, England. But at the same time, however, the ice mass in East Antarctica has been roughly stable, with neither loss nor accumulation over the past decade.

Professor Jonathan Bamber at the University of Bristol and colleagues estimated a loss of 132 billion tons of ice in 2006 from West Antarctica “up from about 83 billion tons in 1996” and a loss of about 60 billion tons in 2006 from the Antarctic Peninsula.

“To put these figures into perspective,” Bamber said, “four billion tons of ice is enough to provide drinking water for the whole of the UK population for one year.”

The data comes from satellite imagery that cover 85% of Antarctica’s coastline, which the researchers compared with simulations of snow accumulation over the same period, using a regional climate model.

“Over the 10 year time period of the survey, the ice sheet as a whole was certainly losing mass,” said Bamber, “and the mass loss increased by 75% during this time. Most of the mass loss is from the Amundsen Sea sector of West Antarctica and the northern tip of the Peninsula where it is driven by ongoing, pronounced glacier acceleration.”

In East Antarctica, the mass balance, which accounts for addition to the ice sheet due to snowfall and the subtraction of ice due to changes in the glacier, is near zero. But the thinning of its potentially vulnerable marine sectors suggests this may change in the near future.

As to the differences in the West and East Antarctic ice sheets, Bamber said, “The West Antarctic Ice Sheet is a “marine based” ice sheet resting on bedrock below sea level with bed slopes inclined downward inland. It has been suggested that this makes the WAIS more susceptible to change caused by the ocean than the East Antarctic Ice Sheet.”

The study conclude that the Antarctic ice sheet mass budget is more complex than indicated by the evolution of its surface mass balance or climate-driven predictions.

Changes in glacier dynamics are significant and may in fact dominate the ice sheet mass budget. This conclusion is contrary to model simulations of the response of the ice sheet to future climate change, which conclude that it will grow due to increased snowfall.

Satellite data was obtained from ERS-1, ERS-2, RADARSAT and ALOS.

Original News Source: University of Bristol Press Release

Cancer Rates Rise and Fall with Cosmic Rays

Showers of high energy particles occur when energetic cosmic rays strike the top of the Earth's atmosphere. Illustration Credit: Simon Swordy (U. Chicago), NASA.

Cancer is a mysterious and complicated disease, with many different types and causes. Researchers are still trying to track down all of the environmental effects that can lead to the disease, as anything from what someone eats to where they live determines the probability of developing cancer. A paper published in 2007 in the International Journal of Astrobiology looked at data for cancer deaths from around the world for the past 140 years, and found a strong correlation between rises in cancer deaths and the variation over time in the amount of galactic cosmic rays we encounter here on Earth.

In a paper titled, Correlation of a 140-year global time signature in cancer mortality birth cohorts with galactic cosmic ray variation by Dr. David A. Juckett from the Barros Research Institute at Michigan State University, he showed that the amount of deaths due to cancer on a global scale was higher when the background cosmic rays originating from outside the Solar System were more numerous.

The study looked at available cancer death data from the United States, United Kingdom, Australia, Canada and New Zealand for the past 100-140 years. These data were compared with the amount of variations in galactic cosmic rays during the same period, taken from analysis of ice core samples from Greenland and Antarctica.

Dr. Juckett showed that as the amount of cosmic ray activity increased, the number of people who died from cancer was also higher. There are two peaks in cosmic ray activity during this point, around 1800 and 1900, and a low point around 1860. The total deaths due to cancer were highest, though, around 1830 and 1930, and lowest in the 1890’s.

There is a 28-year lag between the increased presence of cosmic rays and the increase in cancer deaths. It’s not so simple as a person being exposed to cosmic rays and then developing cancer immediately afterwards. What is called the “grandmother effect” comes into play; the cosmic rays actually damage the germ cells of one’s parent while that parent is still in the grandmother’s womb.

“The grandmother would have to be exposed to radiation – which she is all the time – while she is pregnant with the mother of the affected individual. What this is basically implying is that, during a sensitive time in pregnancy, the constant background radiation may cause a chemical change in just the right cell and DNA stretch to lead to future cancer. The background radiation is causing very low level damage all the time to random cells in the body, but anything significant happening to germ cells would lead to a whole organism eventually carrying that damage (or predisposition),” said Dr. Juckett.

So, the parent is exposed to cosmic rays while the fetus is still developing, and this damage then emerges as cancer in child, but is not passed down further.

Galactic cosmic rays consist of high-energy radiation, and are composed primarily of high-energy protons and atomic nuclei. Their origin in not fully understood, but are thought to possibly come from supernovae, active galactic nuclei, quasars and/or gamma ray bursts.

There are several factors that may contribute to the flux of cosmic rays, and they may produce showers of secondary particles that penetrate and impact the Earth’s atmosphere and sometimes reach the surface.

In the study, the researchers found the trend between cosmic ray increase and cancer death increase was a global effect, but there are places on the Earth where the magnetosphere blocks more of the cosmic rays than others. At about 10°N of the equator, fewer cosmic rays get through than elsewhere on the Earth because of the way the Earth’s magnetosphere blocks energetic particles.

People in more northern and southern latitudes are exposed to more of this radiation, thus the rates of cancer death were higher in these regions than near the equator. On average, the oscillation in cancer deaths was between 10-15% during the period of the study.

Any good scientist will tell you that correlation does not necessarily mean causation; the increase in cosmic rays matches well the increase in cancer deaths over this time period, but there could yet be other reasons for this increase.

Dr. Juckett cautions, “Of course, other explanations could be hypothesized. Standard epidemiological approaches would partition individual cases by risk factors (e.g., smoking, environment pollution, diet, age-at-menarche, family history, etc.). Only when there is no correlation to these would other hypotheses, like cosmic rays be entertained. Unfortunately, to look at the 100-yr data for long-term trends, this kind of information is generally not available. The one thing that seems certain is that the common oscillations in the US, UK, CA, NZ, and AU data suggest a global environmental signal of some kind. This does limit things a bit (e.g., solar radiation effects, cosmic ray effects, global pollution).”

The effects that cosmic rays and other types of radiation have on human beings are important to study, as we venture outside the protective magnetic field of the Earth into space. The researchers said that “this effect has profound implications for evolution, long-distance space travel and the colonization of planets with high background radiation.” Long journeys in space would expose astronauts to this same type of radiation for long periods of time, so taking precautions to protect them makes good sense.

What can one do to protect themselves from this type of radiation here on Earth?

“I cannot of think of anything one can do to protect themselves from their inherited propensities. However, cancer is a multi-step process. It still requires other random ‘mutations’ to occur during life. Healthy living is still called for. In other words, reducing exposure to toxins, radiation, and injury. Eventually, the biochemical fingerprints of possible inherited changes may be deciphered and then testing could be possible,” said Dr. Juckett.

There is no cause for alarm, though; cosmic rays are only about 20-30% of the background radiation we are exposed to every day, and are a minimal cause of cancer in comparison to other environmental effects such as smoking.

Original Source: International Journal of Astrobiology

2007 Ozone Hole is Smaller than Average

2007-1003ozone.thumbnail.jpg

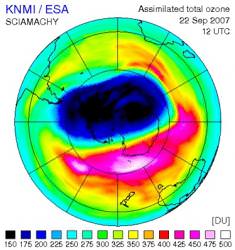
Good news everyone; the ozone hole above Antarctica has shrunk 30% since the same last year. According to ESA’s Envisat satellite, the ozone layer only lost a mere 27.7 million tonnes. Down from last year’s record loss of 40 million tonnes. But don’t jump to conclusions; it doesn’t necessarily mean that the ozone layer is recovering… yet.

As you probably know, the ozone layer is a region of the Earth’s atmosphere that contains a high volume of ozone – the combination of three oxygen molecules. This ozone acts like a shield, protecting us from harmful ultraviolet radiation from the Sun. Over the last decade, the ozone layer has thinned by about 0.3% per year across the entire planet, increasing everyone’s chances for skin cancer, cataracts, and causing damage to marine life. We now know that industrial chemicals like refrigerants are largely to blame for destroying this atmospheric ozone, and there has been a worldwide effort to reduce their use.

And then in 1985, a hole opened up above Antarctica, where there was almost no ozone in the atmosphere, and UV radiation from the Sun could stream right in unblocked.

Scientists measure ozone loss by calculating the area of the hole above Antarctica. This year, that size was 24.7 million sq km, roughly the size of North America. But the 30% smaller hole is probably a coincidence due to natural temperature and atmospheric dynamics.

Here’s what scientists think is happening. During last year’s season, the ozone hole wasn’t situated directly over the south pole, instead it was off to one side. This allowed it to mix with warmer air. And the warm air is the key: ozone is depleted when atmospheric temperatures go below -78 degrees Celsius. Since there was warmer air mixed in the area, it slowed down the process of ozone depletion.

Next year, you could just as easily have the opposite situation, with ozone being destroyed at greater rates. Instead, we need to look at the long term trends, and those don’t show that the ozone layer is on the road to recovery yet.

Original Source: ESA News Release

The Northwest Passage is Open, and That’s Not a Good Thing

2007-9201.thumbnail.jpg

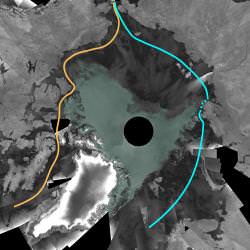
Here in Vancouver, we have a maritime museum with the first ship to completely circumnavigate North America, and the second vessel to complete a voyage through the Northwest Passage – the St. Roch. Their journey was long and difficult, taking 28 months to cross above North America. And just think, if they’d waited until now, they could sail right across with clear waters the whole way. Satellite photos show that Arctic ice levels have reached their lowest point in recorded history, opening up the Northwest Passage.

A mosaic of nearly 200 images captured by ESA’s Envisat satellite was recently released to the public. Here’s Leif Toudal Pedersen from the Danish National Space Centre, describing the ice coverage:

“We have seen the ice-covered area drop to just around 3 million sq km which is about 1 million sq km less than the previous minima of 2005 and 2006. There has been a reduction of the ice cover over the last 10 years of about 100 000 sq km per year on average, so a drop of 1 million sq km in just one year is extreme.”

Arctic sea ice coverage rises and falls over the course of the year. During the cold northern winters, it extends, and then recedes in the relatively warmer summer. The total coverage of ice has been decreasing on average since the first satellite observations were made in 1978.

In the image attached with this story you can see a yellow line and a blue line. The yellow line indicates the path you can take across northern Canada to get around North America. And the blue line indicates the path you can take above the Siberian coast. The Siberian route is still partially blocked – at the dotted line. Just give it a few years, though.

Climate researchers were predicting that there might be an ice free passage above North America in the middle of the 21st century, not this summer. The loss of sea ice has beaten their predictions by about 40 years. Some researchers are predicting the Arctic will be completely ice free in 2070 – they might want to revise their predictions.

Okay, so an open Arctic might make some shipping routes cheaper, but it could have bad consequences for the environment. Sea ice reflects sunlight back into space much more efficiently than dark ocean. Without the reflectivity of the Arctic, global warming could accelerate. The warmer oceans will make it difficult for sea ice to reform, so the process is probably irreversible.

Original Source: ESA News Release

Arctic Ice Coverage Will Shrink to 2050 Projections… This Summer

2007-0817seaice.thumbnail.jpg

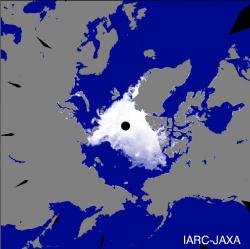
Sometimes you wish records didn’t get broken. A group of Japanese science agencies announced today that the area of the Arctic Sea covered by ice is at its lowest level ever recorded. It reached this low point on August 15th, and it’s going to get worse. Ice levels should continue to shrink all the way through mid-September. If reality matches predictions, the ice levels will reach IPCC predictions 40 years ahead of schedule.

On August 15th, 2007 the area of Arctic sea ice was 5.31 million square km (2.1 million square miles). This beats the previous record of 5.32 million seen back in September 2005. That might sound like it’s almost the same amount, but just you wait, ice is expected to continue shrinking until mid-September, getting as small as 4.5 million square km.

These results were announced today by the Japan Agency for Marine-Earth Science and Technology (JAMSTEC) and the Japan Aerospace Exploration Agency (JAXA), which have been tracking Arctic ice levels by satellite since 1978. By their calculation, an amount of ice equal to the Japanese archipelago has been lost in just the last 3 years.

According to the Japanese agencies, there could be several reasons why the ice levels are so low this year. One explanation is that ice in coastal areas which is more prone to melting could have entered the Arctic Sea. It’s also possible that melting within the Arctic Sea has quickened – thanks to global warming – and is leading to the ocean absorbing more sunlight. Finally, they suggest that more sea ice could have drifted from the Arctic Sea to the warmer Atlantic Ocean and melted.

Here’s the scary part. The United Nations Intergovernmental Panel on Climate Change predicted that this level of ice coverage would be met in 2050. I’ll say that again, Arctic ice will reach levels predicted for 2050 by the end of this summer. I wonder what the levels will be in 2050?

Here’s what one official had to say about the IPCC predictions:

The IPCC forecast cannot adequately explain what is now happening in the Arctic Sea.

Original Source: JAXA News Release