When it comes to space exploration, the motto “keep it simple” isn’t always followed! For the most part, satellites, spacecraft, telescopes, and the many other technologies that allow humans to study and explore the Universe are the result of highly-technical and complex feats of engineering. But sometimes, it is the simplest ideas that offer the most innovative solutions.
This is especially true when it comes to the today’s space agencies, who are concerned with cutting costs and increasing accessibility to space. A good example is the Fenix propulsion system, a proposal created by Italian tech company D-Orbit. As part of the last year’s Space Exploration Masters, this pen-sized booster will allow CubeSats to maneuver and accomplish more in space.
The Space Exploration Masters, which the European Space Agency (ESA) initiated in 2017, seeks to encourage space-based innovation and provide opportunities for commercial development. As such, this annual competition has become central to the implementation of the ESA Space Exploration strategy. For their application last year, D-Orbit was jointly awarded the the ESA and Space Application Services prize.
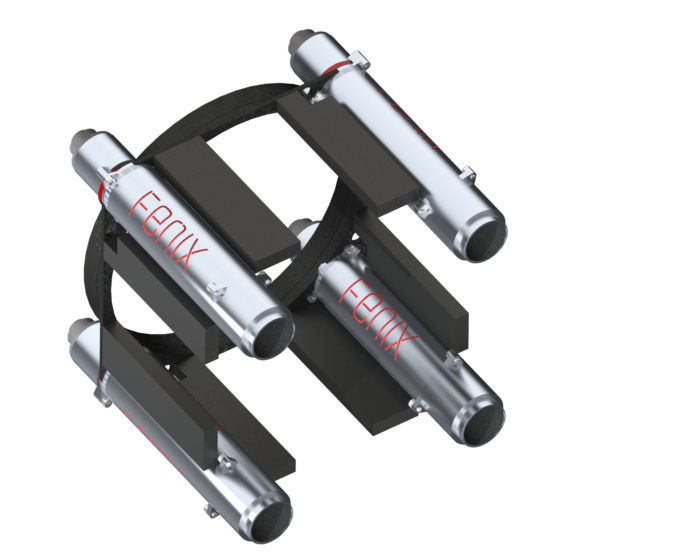
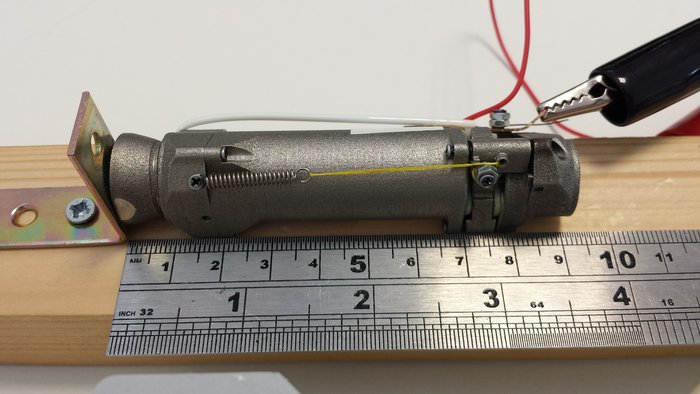
The thruster prototype itself measures only 10 cm long and 2 cm wide (~4 by 0.8 inches) and contain solid propellant that is triggered by a simple electrical ignition system. The boosters are designed to be placed at each corner of a 10 x 10 x 10 cm CubeSat, or can be doubled up for added thrust. Thanks to their lightweight and compact size, they do not take up much instrument space or add significantly to a CubeSat’s weight.
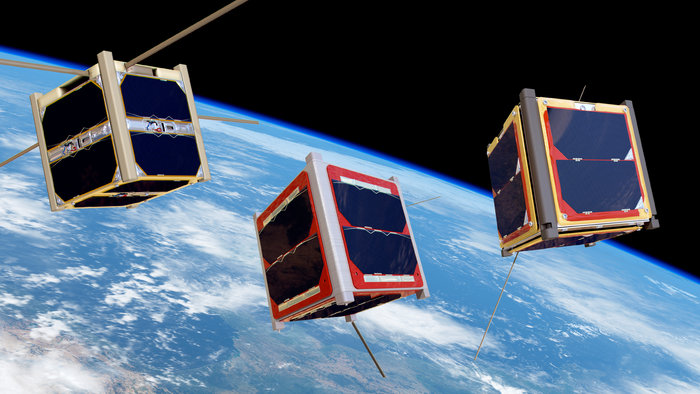
Currently, CubeSats are deployed directly into space, deorbit at the end of their missions, and have no means to change their orbits. But with this simple, chemical-propellant thruster, CubeSats could function for longer periods and would be able to take on more complicated missions. For instance, if they can maneuver in orbit, they will be able to study the Moon and asteroids from different angles.
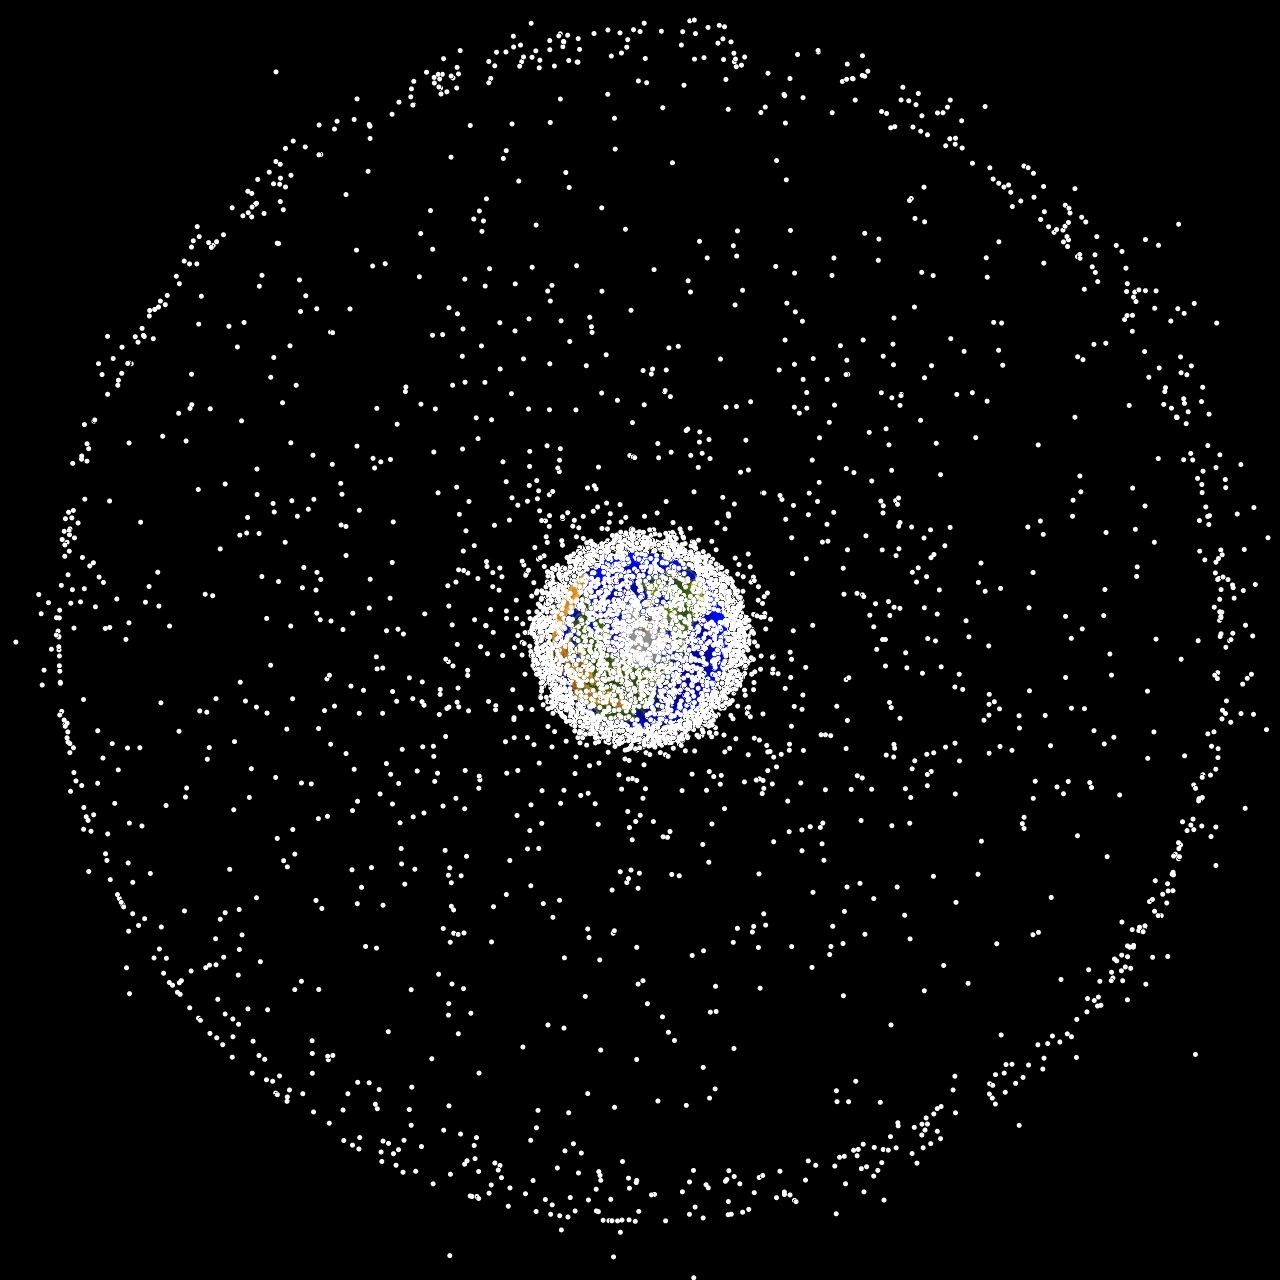
In addition, boosters will allow CubeSats to deorbit themselves once they are finished their missions, thus reducing the threat of space debris. According to the latest report from the Space Debris Office at the European Space Operations Center (ESOC), an estimated 19,894 bits of space junk were circling our planet by the end of 2017, with a combined mass of at least 8135 metric tons (8967 US tons). This problem is only expected to get worse.
In fact, it is estimated that the small satellite market will grow by $5.3 billion in the next decade (according to Space Works and Eurostat) and many private companies are looking to provide regular launch services to accommodate that growth. As such, a propulsion system that not only presents opportunities to do more with CubeSats, but in a way that will not add to problem of space debris, will be highly sought-after.
In addition to the ESA and Space Application Services prize, D-Orbit won a four-month ticket to test their prototype on the newly-installed ICE Cubes facility, which is located in the Columbus module aboard the International Space Station. This facility is the first European commercial research center to operate aboard the ISS, and the D-Orbit team will use to test the booster’s safe ignition mechanism inside an ICE cube experiment.
This experiment, which will not involve firing the actual propulsion system, will help ensure that the booster can operate safe and effectively in space. Sensors and cameras will record the sparks, triggered by an electrical impulse, while the team relies on the ICE Cubes facility’s dedicated control center to provide them with remote viewing opportunities from the ground.
The Fenix boosters are set to launch for the ISS by the end of next year and, if successful, D-Orbit will likely secure permission to test their propulsion system in space. And if all goes well, future generations of CubeSats – which have already made Low Earth Orbit (LEO) accessible to private companies and research institutes – will be capable of performing far more tasks in orbit.
For this year’s Space Exploration Masters, the ESA is partnering with the United Nations World Health Organization (WHO) to address health and food. For the main challenge, participants will be tasked with coming up with applications that promote nutritious food and food security, both on- and 0ff-planet. Among other challenges, this year’s SEM will also be looking for ideas that make missions more sustainable and new ways to use future spacecraft.
For more information on this year’s Space Exploration Masters, check out the ESA website page.
Further Reading: ESA