Best Photos Yet of the Mars Lander’s Demise

Credit: Schiaparelli lander protected by its heat shield as it enters the Martian atmosphere. Credit: ESA
A closeup of the dark, approximately circular crater about 7.9 feet (2.4 meters) in diameter marking the crash of the Schiaparelli test lander on Mars. The photo was taken on October 25 by NASA's Mars Reconnaissance Lander (MRO). Credit:
A closeup of the dark, approximately circular crater about 7.9 feet (2.4 meters) in diameter that marks the crash of the Schiaparelli test lander on Mars. The new, higher-resolution photo was taken on October 25 by NASA’s Mars Reconnaissance Lander (MRO). A hint of an upraised rim is visible along the crater’s lower left side. The tiny white specks may be pieces of the lander that broke away on impact. The odd dark curving line has yet to be explained.  Credit: NASA/JPL-Caltech

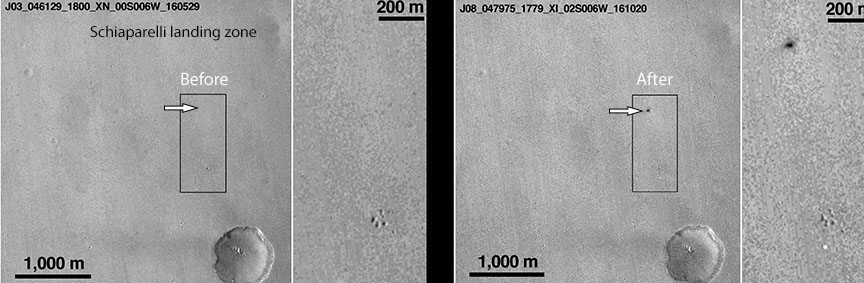
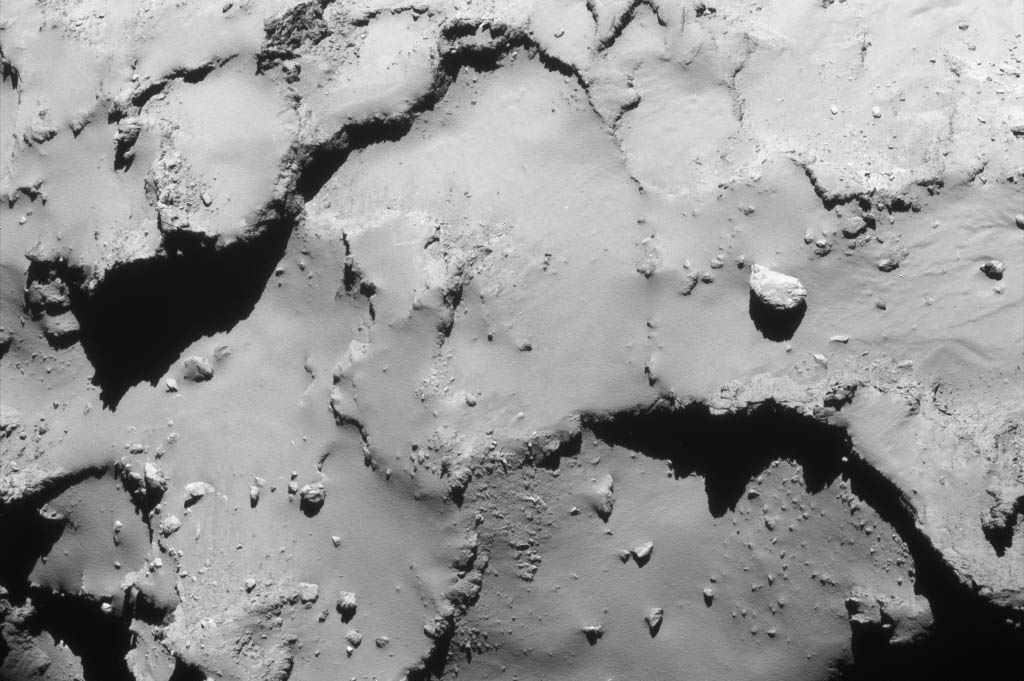
What’s the most powerful telescope for observing Mars? A telephoto lens on the HiRise camera on the Mars Reconnaissance Orbiter that can resolve features as small as 3 feet (1-meter) across. NASA used that camera to provide new details of the scene near the Martian equator where Europe’s Schiaparelli test lander crashed to the surface last week.

The Schiaparelli test lander was protected by its heat shield as it descended through the Martian atmosphere at high speed. Credit: ESA

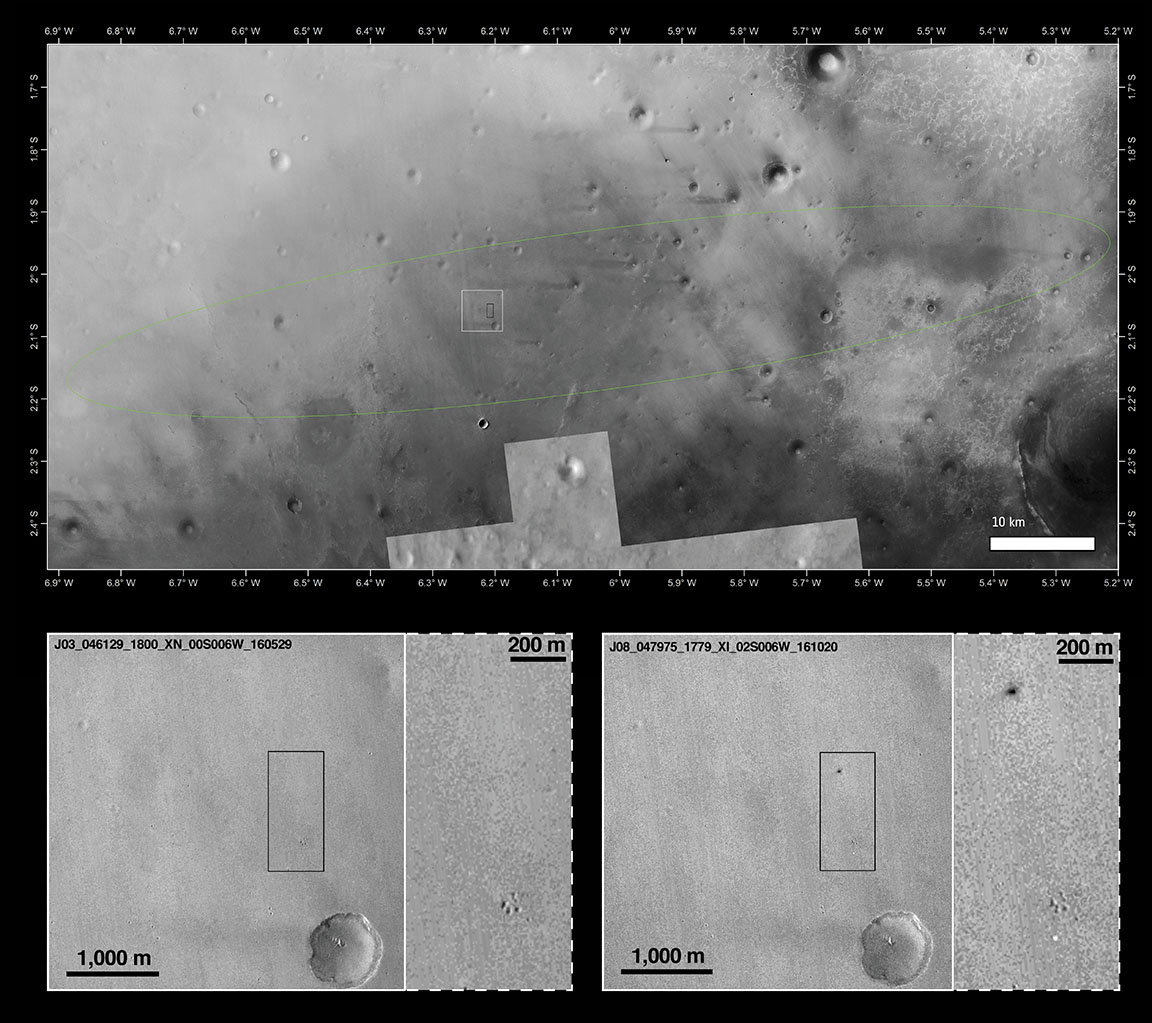
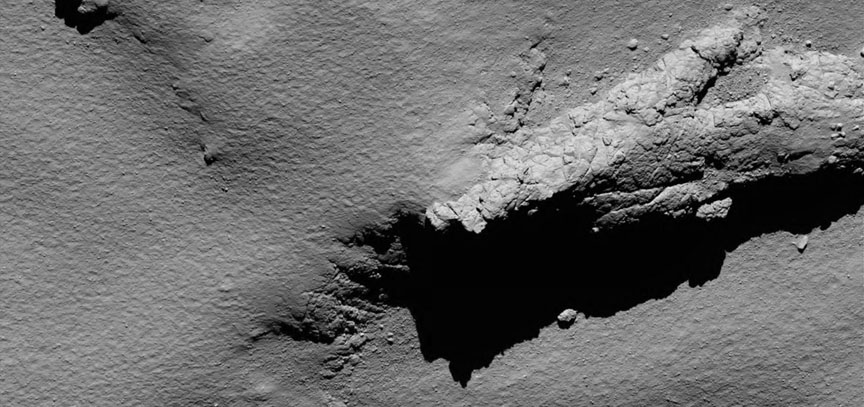
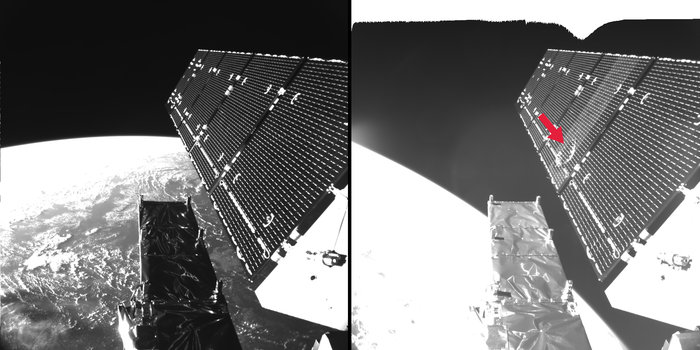
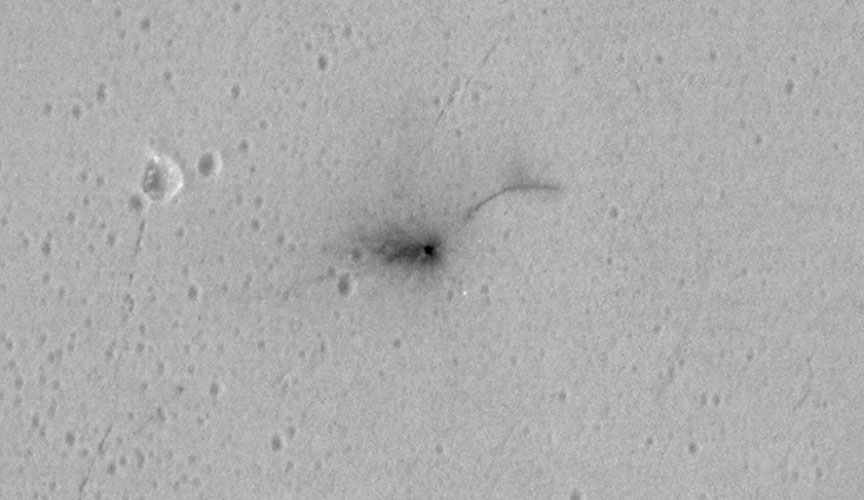
During an October 25 imaging run HiRise photographed three locations where hardware from the lander hit the ground all within about 0.9 mile (1.5 kilometers) of each other. The dark crater in the photo above is what you’d expect if a 660-pound object (lander) slammed into dry soil at more than 180 miles an hour (300 km/h). The crater’s about a foot and a half (half a meter) deep and haloed by dark rays of fresh Martian soil excavated by the impact.

But what about that long dark arc northeast of the crater?  Could it have been created by a piece of hardware jettisoned when Schiaparelli’s propellant tank exploded? The rays are curious too. The European Space Agency says that the lander fell almost vertically when the thrusters cut out, yet the asymmetrical nature of the streaks — much longer to the west than east — would seem to indicate an oblique impact. It’s possible, according to the agency, that the hydrazine propellant tanks in the module exploded preferentially in one direction upon impact, throwing debris from the planet’s surface in the direction of the blast, but more analysis is needed. Additional white pixels in the image could be lander pieces or just noise.

This Oct. 25, 2016, image shows the area where the European Space Agency's Schiaparelli test lander reached the surface of Mars, with magnified insets of three sites where components of the spacecraft hit the ground. It is the first view of the site from the High Resolution Imaging Science Experiment (HiRISE) camera on NASA's Mars Reconnaissance Orbiter taken after the Oct. 19, 2016, landing event and our highest resolution of the scene to date. Annotations by the author. Click for a full-resolution image. Credit: NASA/JPL-Caltech
This Oct. 25, 2016, image shows the area where the European Space Agency’s Schiaparelli test lander reached the surface of Mars, with magnified insets of three sites where components of the spacecraft hit the ground. It is the first view of the site from the High Resolution Imaging Science Experiment (HiRISE) camera on NASA’s Mars Reconnaissance Orbiter taken after the Oct. 19, 2016, landing event and our highest resolution of the scene to date. Click for a full-resolution image. Credit: NASA/JPL-Caltech

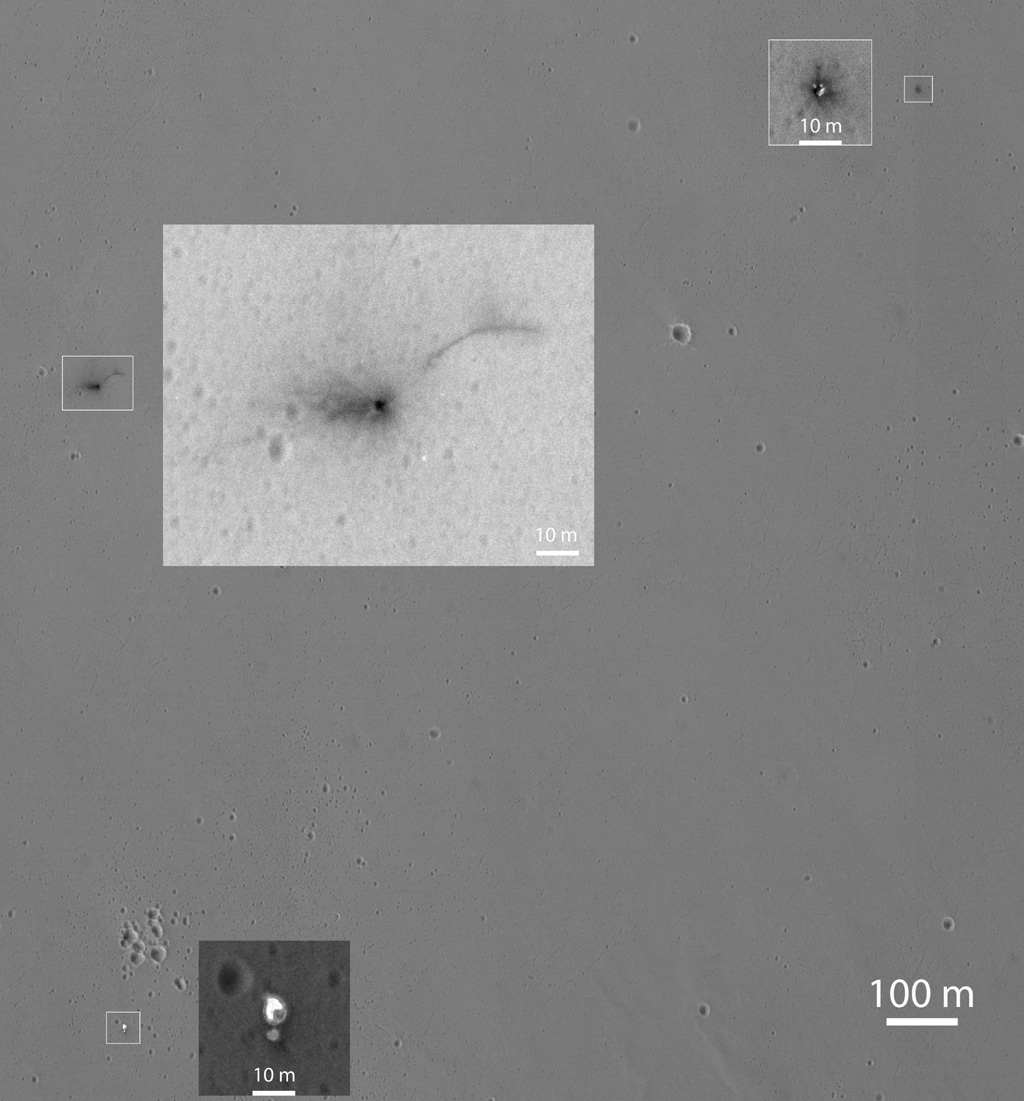
In the wider shot, several other pieces of lander-related flotsam are visible. About 0.8 mile (1.4 km) eastward, you can see the tiny crater dug out when the heat shield smacked the ground. Several bright spots might be pieces of its shiny insulation. About 0.6 mile (0.9 kilometer) south of the lander impact site, two features side-by-side are thought to be the spacecraft’s parachute and the back shell.  NASA plans additional images to be taken from different angle to help better interpret what we see.

The last happy scene for the lander when it still dangled from its chute before dropping and slamming into the surface. Credit: ESA
Schiaparelli dangles from its parachute in this artist’s view. A software error caused the chute to deploy too soon. Credit: ESA

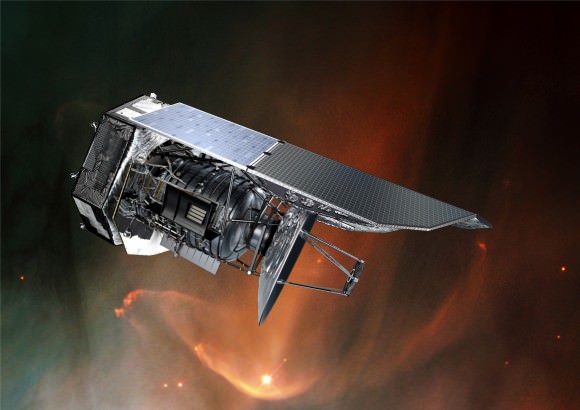
The test lander is part of the European Space Agency’s ExoMars 2016 mission, which placed the Trace Gas Orbiter into orbit around Mars on Oct. 19. The orbiter will investigate the atmosphere and surface of Mars in search of organic molecules and provide relay communications capability for landers and rovers on Mars. Science studies won’t begin until the spacecraft trims its orbit to a 248-mile-high circle through aerobraking, which is expected to take about 13 months.

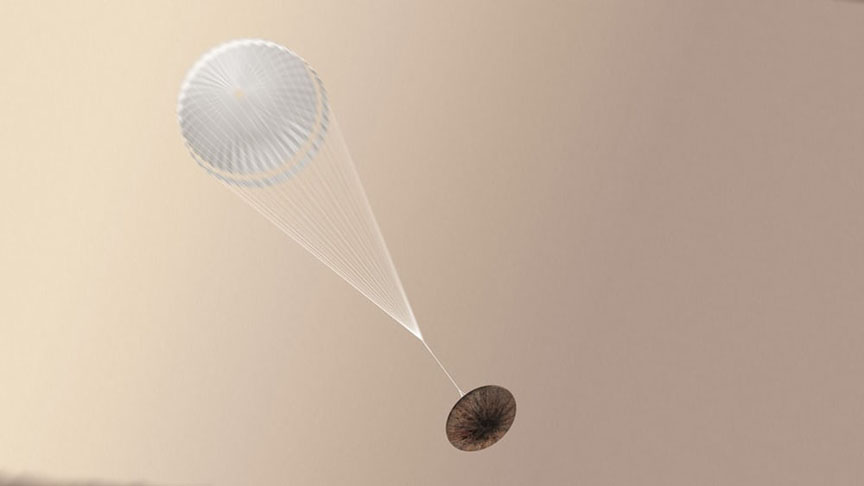
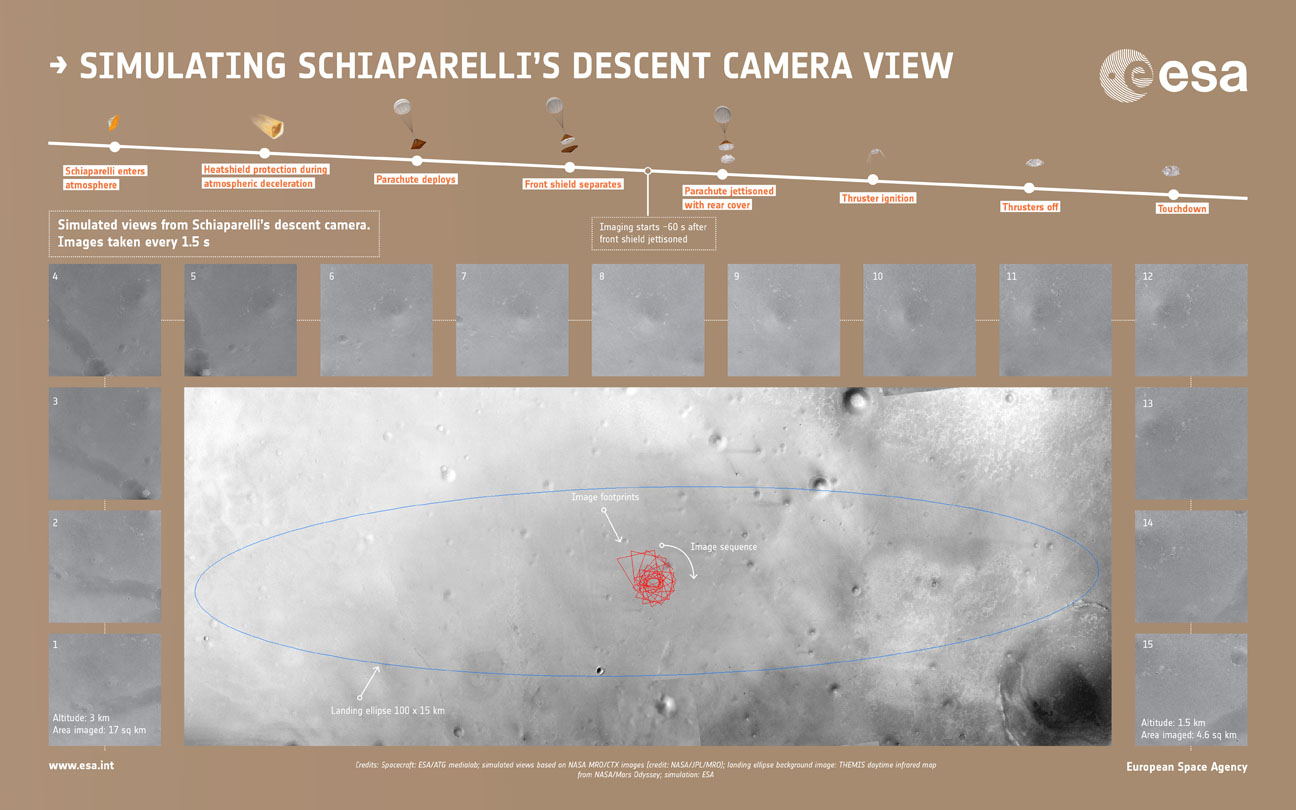
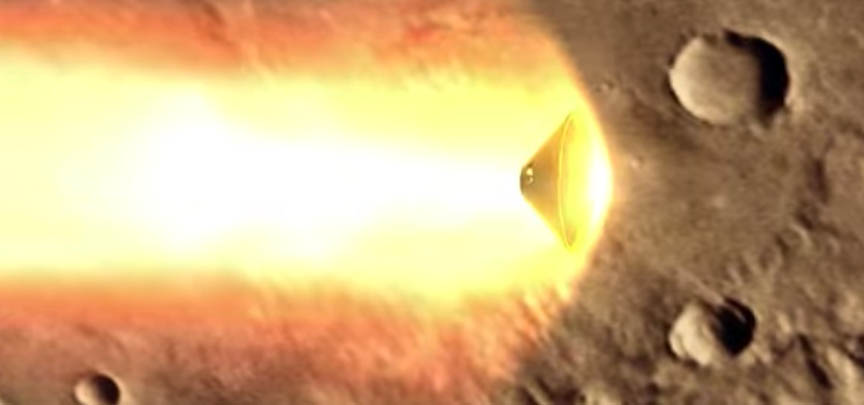
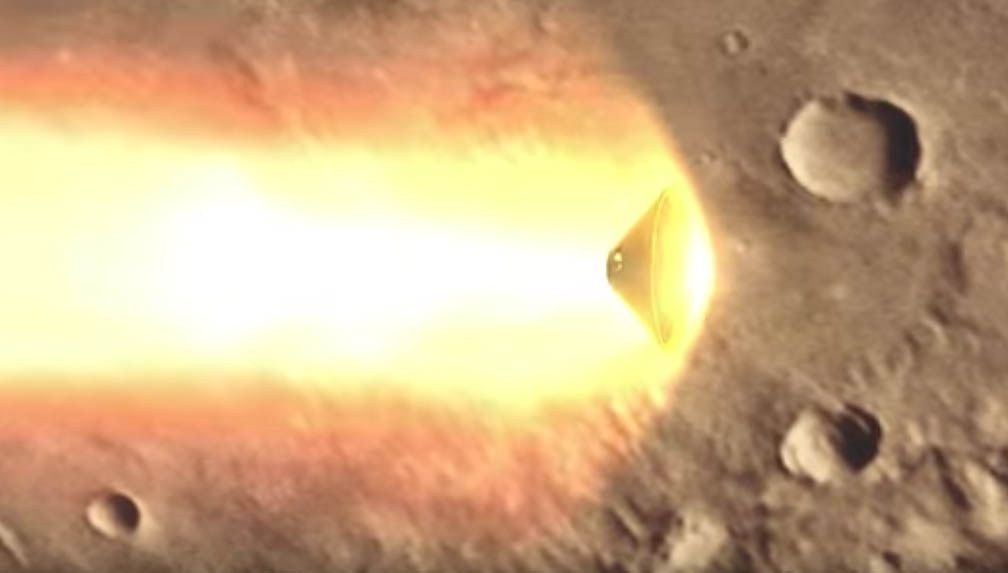
Everything started out well with Schiaparelli, which successfully transmitted data back to Earth during its descent through the atmosphere, the reason we know that the heat shield separated and the parachute deployed as planned. Unfortunately, the chute and its protective back shell ejected ahead of time followed by a premature firing of the thrusters. And instead of burning for the planned 30 seconds, the rockets shut off after only 3. Why? Scientists believe a software error told the lander it was much closer to the ground than it really was, tripping the final landing sequence too early.

Landing on Mars has never been easy. We’ve done flybys, attempted to orbit the planet or land on its surface 44 times. 15 of those have been landing attempts, with 7 successes: Vikings 1 and 2, Mars Pathfinder, the Spirit and Opportunity rovers, the Phoenix Lander and Curiosity rover. We’ll be generous and call it 8 if you count the 1971 landing of Mars 3 by the then-Soviet Union. It reached the surface safely but shut down after just 20 seconds.

Mars can be harsh, but it forces us to get smart.

**** Want to learn more about Mars and how to track it across the sky? My new book, Night Sky with the Naked Eye, which will be published on Nov. 8, covers planets, satellites, the aurora and much more. You can pre-order it right now at these online stores. Just click an icon to go to the site of your choice – Amazon, Barnes & Noble or Indiebound. It’s currently available at the first two outlets for a very nice discount.

Night Sky book cover Amazon anno
Night Sky book cover BN

Night Sky book cover Indie

Schiaparelli is Gone. Smashed on the surface of Mars

Mars Reconnaissance Orbiter view of Schiaparelli landing site before and after the lander arrived. The images have a resolution of 6 meters per pixel and shows two new features on the surface when compared to an image from the same camera taken in May this year. The black dot appears to be the lander impact site and the smaller white dot below the paw-shaped cluster of craters, the parachute. Credit: NASA

Instead of a controlled descent to the surface using its thrusters, ESA’s Schiaparelli lander hit the ground hard and may very well have exploded on impact.  NASA’s Mars Reconnaissance Orbiter then-and-now photos of the landing site have identified new markings on the surface of the Red Planet that are believed connected to the ill-fated lander.

Schiaparelli entered the martian atmosphere at 10:42 a.m. EDT (14:42 GMT) on October 19 and began a 6-minute descent to the surface, but contact was lost shortly before expected touchdown seconds after the parachute and back cover were discarded. One day later, the Mars Reconnaissance Orbiter took photos of the expected touchdown site as part of a planned imaging run.

The landing site is shown within the Schiaparelli landing ellipse (top) along with before and after images below. Copyright Main image: NASA/JPL-Caltech/MSSS, Arizona State University; inserts: NASA/JPL-Caltech/MSSS

One of the features is bright and can be associated with the 39-foot-wide (12-meter) diameter parachute used in the second stage of Schiaparelli’s descent. The parachute and the associated back shield were released from Schiaparelli prior to the final phase, during which its nine thrusters should have slowed it to a standstill just above the surface.

The other new feature is a fuzzy dark patch or crater roughly 50 x 130 feet (15 x 40 meters) across and about 0.6 miles (1 km) north of the parachute. It’s believed to be the impact crater created by the Schiaparelli module following a much longer free fall than planned after the thrusters were switched off prematurely.

Artist's concept of Schiaparelli deploying its parachute. The parachute may also have played a role in the crash. It may have deployed too soon, causing the thrusters to fire up too soon and run out of fuel. Or the thrusters may have simply cut out after firing. Credit: ESA
Artist’s concept of Schiaparelli deploying its parachute. The parachute may also have played a role in the crash. It may have deployed too soon, causing the thrusters to fire too soon. The thrusters may also have simply cut out too soon after firing. Credit: ESA

Mission control estimates that Schiaparelli dropped from between 1.2 and 2.5 miles (2 and 4 km) altitude, striking the Martian surface at more than 186 miles an hour (300 km/h). The dark spot is either disturbed surface material or it could also be due to the lander exploding on impact, since its thruster propellant tanks were likely still full. ESA cautions that these findings are still preliminary.

Something went wrong with Schiaparelli's one or more sets of thrusters during the descent. Credit: ESA
Something went wrong with Schiaparelli’s one or more sets of thrusters during the descent, causing the lander to crash on the surface at high speed. Credit: ESA

Since the module’s descent trajectory was observed from three different locations, the teams are confident that they will be able to reconstruct the chain of events with great accuracy. Exactly what happened to cause the thrusters to shut down prematurely isn’t yet known.

Europe’s Orbiter is Safely at Mars, but No Word from the Lander

This artist's view shows the European Space Agency's Schiaparelli lander on Mars. It's unclear whether the landing was successful. Signals were received during its descent but then suddenly cut off. Mission control is working on the data now and will have an update on the status of the probe tomorrow morning Oct. 20. Credit: ESA/ATG medialab
Schiaparelli on Mars. Credit: ESA/ATG medialab
This artist’s view shows the European Space Agency’s Schiaparelli lander on Mars. It’s unclear whether the landing was successful. Signals were received during its descent but then suddenly cut off. Mission control is working on the data now and will have an update on the status of the probe tomorrow morning Oct. 20. Credit: ESA/ATG medialab

Good news and bad news.  First the good. After a seven-month and 300 million mile (483 million km) journey, the Trace Gas Orbiter (TGO) successfully achieved orbit around Mars today. A signal spike appeared out of the noise about 12:35 p.m. EDT to great applause and high-fives at ESA’s European Space Operations Center in Darmstadt, Germany.

Hugs in the control room when the signal from the Trace Gas Orbiter was received this morning, signaling that the spacecraft had achieved orbit around Mars. Credit: ESA Livestream
Joy in the control room when the signal from the Trace Gas Orbiter was received this morning, signaling that the spacecraft had achieved orbit around Mars. Credit: ESA Livestream

Two hours later, news of the lander arrived. Not so good but to be fair, it’s still too early to tell. Schiaparelli broadcast a signal during its descent to the Red Planet that was received here on Earth and by the orbiting Mars Express. All well and good. But then mid-transmission, the signal cut out.

Paolo Ferri, head of ESA’s mission operations department, called the news “not good signs” but promised that his team would be analyzing the data through the night to determine the status of the lander. Their findings will be shared around mid-morning Friday Central European Time (around 5 a.m. EDT).

Three days ago, Schiaparelli separated from the orbiter and began a three-day coast to Mars. It entered the atmosphere today at an altitude of 76 miles (122 km) and speed of 13,049 mph (21,000 km/hr), protected from the hellish heat of re-entry by an aerodynamic heat shield.

Simulated sequence of the 15 images that the descent camera Schiaparelli module should have taken during its descent to Mars this morning. In the simulated images shown here, the first was made from 3 km up. The camera took images every 1.5 seconds with the final image in this at ~1.5 km. Depending on Schiaparelli’s actual descent speed, the final image may have been snapped closer to the surface. The views were generated from images taken by NASA’s Mars Reconnaissance Orbiter of the center of Schiaparelli's landing ellipse, and represent the views expected at each altitude. Copyright spacecraft: ESA/ATG medialab; simulated views based on NASA MRO/CTX images (credit: NASA/JPL/MRO); landing ellipse background image: Mars Odyssey; simulation: ESA
Simulated sequence of the 15 images that the descent camera Schiaparelli module should have taken during its descent to Mars this morning. In the simulated images shown here, the first was made from 3 km up. The camera had planned to take images every 1.5 seconds with the final image in this at ~1.5 km. Depending on Schiaparelli’s actual descent speed, the final image may have been snapped closer to the surface. The views were generated from images taken by NASA’s Mars Reconnaissance Orbiter of the center of Schiaparelli’s landing ellipse, and represent the views expected at each altitude. Copyright spacecraft: ESA/ATG medialab; simulated views from NASA images (credit: NASA/JPL/MRO); landing ellipse background image: Mars Odyssey; simulation: ESA

If all went well, at 6.8 miles (11 km) altitude, it would have deployed its parachute and moments later, dropped the heat shield. At 0.7 miles (1.2 km) above the surface, the lander would have jettisoned the chute and rear protective cover and fired its nine retrorockets while plummeting to the surface at 155 mph (255 mph). 29 seconds later, the thrusters would have shut off with Schiaparelli dropping the remaining 6.5 feet (2 meters) to the ground. Total elapsed time: just under 6 minutes.

For now, have hope. Given that Schiaparelli was primarily a test of landing technologies for future Mars missions, whatever happened, everything we learn from this unexpected turn of events will be invaluable. You can continue to follow updates on ESA’s Livestream.

** Update Oct. 20: It appears that the thrusters on Schiaparelli may have cut out too soon, causing the lander to drop from a higher altitude. In addition, the ejection of the parachute and back heat shield may have happened earlier than expected.

This from ESA:

“The data have been partially analyzed and confirm that the entry and descent stages occurred as expected, with events diverging from what was expected after the ejection of the back heat shield and parachute. This ejection itself appears to have occurred earlier than expected, but analysis is not yet complete.

The thrusters were confirmed to have been briefly activated although it seems likely that they switched off sooner than expected, at an altitude that is still to be determined.”

Rosetta Wows With Amazing Closeups of Comet 67P Before Final ‘Crunchdown’

ESA/Rosetta/MPS for OSIRIS Team MPS/UPD/LAM/IAA/SSO/INTA/UPM/DASP/IDA
Landscape on Comet 67P taken from just 10 miles (16 km) up late Thursday evening during Rosetta's free fall . The image measures 2,014 feet (614 meters) across or just under a half-mile. At typical walking speed, you could walk from one end to the other in 10 minutes. Credit: ESA/Rosetta
Craggy hills meet dust-covered plains in this landscape on Comet 67P taken from 10 miles (16 km) up late Thursday evening during Rosetta’s free fall . The image measures 2,014 feet (614 meters) across or just under a half-mile. At typical walking speed, you could walk from one side to the other in 10 minutes. This and all the photos below are copyright ESA/Rosetta/MPS for OSIRIS Team MPS/UPD/LAM/IAA/SSO/INTA/UPM/DASP/IDA

Rosetta fell silent moments after 6:19 a.m. Eastern Time (12:19 UT) this morning, when it gently crashed into 67P/C-G 446 million miles (718 million km) from Earth. As the probe descended to the comet’s bouldery surface of the comet in free fall, it snapped a series of ever-more-detailed photographs while gathering the last bits data on the density and composition of cometary gases, surface temperature and gravity field before the final curtain was drawn.

Let’s take the trip down, shall we?

Rosetta's last navigation camera image was taken just after the collision maneuver sequence Thursday evening (CDT) when the probe was 9.56 miles (15.4 km) above the comet's surface. Credit: ESA/Rosetta
Rosetta’s last navigation camera image was taken just after the collision maneuver sequence Thursday evening (CDT) when the probe was 9.56 miles (15.4 km) above the comet’s surface. As in the photo above, much of the landscape is coated in a thick layer of dust that smoothes the comet’s contours.
As Rosetta continues its descent onto the Ma'at region on the small lobe of Comet 67P/Churyumov-Gerasimenko, the OSIRIS narrow-angle camera captured this image at 08:18 GMT from an altitude of about 5.8 km. The image shows dust-covered terrains, exposed walls and a few boulders on Ma'at, not far from the target impact region (not visible in this view - located below the lower edge).Copyright ESA/Rosetta/MPS for OSIRIS Team MPS/UPD/LAM/IAA/SSO/INTA/UPM/DASP/IDA
As Rosetta continued its descent onto the Ma’at region on the small lobe of Comet 67P/Churyumov-Gerasimenko, the OSIRIS narrow-angle camera captured this photo from 3.6 miles (5.8 km) up. We see dust-covered terrains, exposed walls and a few boulders on Ma’at, not far from the target impact region, which is located just below the lower edge. The image measures 738 feet (225 meters) across.
Comet from 5.7 km. Rosetta’s OSIRIS narrow-angle camera captured this image of Comet 67P/Churyumov-Gerasimenko at 08:21 GMT during the spacecraft’s final descent on September 30, 2016. Credits: ESA/Rosetta/MPS for OSIRIS Team MPS/UPD/LAM/IAA/SSO/INTA/UPM/DASP/IDA
Just a little bit lower now. This photo showing dramatic shadows was taken from 3.5 miles (5.7 km) above the surface of the comet at 4:21 a.m. EDT Friday morning September 30.
It looks like the probe's headed for the abyss! This photo was made at 6:14 a.m. just minutes before impact from 3/4 mile (1.2 km) high. The scene measures just 33 meters across.
Headed for the abyss? This photo was made at 6:14 a.m. from 3/4 mile (1.2 km) high just a few minutes before impact. The scene measures just 108 feet (33 meters) wide.
This is Rosetta's last image of Comet 67P/Churyumov-Gerasimenko, taken shortly before impact, an estimated 51 m above the surface.
This is Rosetta’s final image of Comet 67P/Churyumov-Gerasimenko, taken shortly before impact, an estimated 66 feet (~20 meters) above the surface. The view is similar to looking down from atop a three-story building. Side to side, the photo depicts an area only 7.8 feet (2.4 meters) across. The image is soft because Rosetta’s cameras weren’t designed to photograph the comet from this close.
Sad to see its signal fade. Going... going... gone! A sequence of screenshots showing the signal from Rosetta seen at ESA's ESOC mission control centre via NASA's 70m tracking station at Madrid during comet landing on 30 September 2016. The peak of the spectrum analyser is strong at 12:19 CEST, and a few moments later, it's gone. Credit: ESA
Sad to see its signal fade. A sequence of screenshots taken at ESA’s ESOC mission control show the signal from Rosetta fading moments before impact. The peak of the spectrum analyser is strong at 6:19 EDT, and a few moments later, it’s gone. At impact, Rosetta’s was shut down and no further communication will or can be made with the spacecraft. It will continue to rest on the comet for well-nigh eternity until 67P vaporizes and crumbles apart. Credit: ESA

Bye, Bye Rosetta — We’ll Miss You!

Copyright: ESA with changes to annotations by the author
Activity increases substantially at Comet 67P/Churyumov-Gerasimenko between Jan. 31 and March 25, 2015, when this series of pictures was taken by the Rosetta spacecraft. Credit: NAVCAM_CC-BY_SA-IGO-3.0
This montage of photos of Comet 67P/Churyumov-Gerasimenko was taken by ESA’s Rosetta spacecraft between Jan. 31 and March 25, 2015 and shows increasing activity as the comet approached perihelion. Credit: NAVCAM /CC-BY-SA-IGO-3.0

Rosetta awoke from a decade of deep-space hibernation in January 2014 and immediately got to work photographing, measuring and sampling comet 67P/C-G. On September 30 it will sleep again but this time for eternity. Mission controllers will direct the probe to impact the comet’s dusty-icy nucleus within 20 minutes of 10:40 Greenwich Time (6:40 a.m. EDT) that Friday morning. The high-resolution OSIRIS camera will be snapping pictures on the way down, but once impact occurs, it’s game over, lights out. Rosetta will power down and go silent.

A simplified overview of Rosetta’s last week of manoeuvres at Comet 67P/Churyumov–Gerasimenko (comet rotation is not considered). After 24 September the spacecraft will leave the flyover orbits and transfer towards an initial point of a 16 x 23 km orbit that will be used to prepare for the final descent. The collision course manoeuvre will take place in the evening of 29 September, initiating the descent from an altitude of about 20 km. The impact is expected to occur at 10:40 GMT (±20 minutes) at the comet, which taking into account the 40 minute signal travel time between Rosetta and Earth on 30 September, means the confirmation would be expected at mission control at 11:20 GMT / 13:20 CEST (±20 minutes).
A simplified overview of Rosetta’s last week of maneuvers at Comet 67P/Churyumov–Gerasimenko. Starting today (Sept. 24) the spacecraft will leave the flyover orbits and transfer towards a 16 x 23 km orbit that will be used to prepare for the final descent. The collision course maneuver will take place in the evening Sept. 29 with impact expected to occur at 10:40 GMT (6:40 a.m. EDT), which taking into account the 40 minute signal travel time between Rosetta and Earth on Sept. 30, means the confirmation would be expected at mission control at 11:20 GMT (7:20 a.m. EDT). Copyright: ESA

Nearly three years have passed since Rosetta opened its eyes on 67P, this curious, bi-lobed rubber duck of a comet just 2.5 miles (4 km) across with landscapes ranging from dust dunes to craggy peaks to enigmatic ‘goosebumps’. The mission was the first to orbit a comet and dispatch a probe, Philae, to its surface. I think it’s safe to say we learned more about what makes comets tick during Rosetta’s sojourn than in any previous mission.

So why end it? One of the big reasons is power. As Rosetta races farther and farther from the Sun, less sunlight falls on its pair of 16-meter-long solar arrays. At mid-month, the probe was over 348 million miles (560 million km) from the Sun and 433 million miles (697 million km) from Earth or nearly as far as Jupiter. With Sun-to-Rosetta mileage increasing nearly 620,000 miles (1 million km) a day, weakening sunlight can’t provide the power needed to keep the instruments running.


Rosetta’s last orbits around the comet

Rosetta’s also showing signs of age after having been in the harsh environment of interplanetary space for more than 12 years, two of them next door to a dust-spitting comet. Both factors contributed to the decision to end the mission rather than put the probe back into an even longer hibernation until the comet’s next perihelion many years away.

Since August 9, Rosetta has been swinging past the comet in a series of ever-tightening loops, providing excellent opportunities for close-up science observations. On September 5, Rosetta swooped within 1.2 miles (1.9 km) of 67P/C-G’s surface. It was hoped the spacecraft would descend as low as a kilometer during one of the later orbits as scientists worked to glean as much as possible before the show ends.

Rosetta will land somewhere within this planned impact ellipse in the Ma'at region on the comet's smaller lobe. Copyright: ESA
Rosetta is targeted to land at the site within this planned impact ellipse in the Ma’at region on the comet’s smaller lobe. See below for a closer view. Credit: ESA/Rosetta/NAVCAM – CC BY-SA IGO 3.0

The final of 15 close flyovers will be completed today (Sept. 24) after which Rosetta will be maneuvered from its current elliptical orbit onto a trajectory that will eventually take it down to the comet’s surface on Sept. 30.

The beginning of the end unfolds on the evening of the 29th when Rosetta spends 14 hours free-falling slowly towards the comet from an altitude of 12.4 miles (20 km) — about 4 miles higher than a typical commercial jet — all the while collecting measurements and photos that will be returned to Earth before impact. The last eye-popping images will be taken from a distance of just tens to a hundred meters away.

The landing will be a soft one, with the spacecraft touching down at walking speed. Like Philae before it, it will probably bounce around before settling into place. Mission control expects parts of the probe to break upon impact.

Taking into account the additional 40 minute signal travel time between Rosetta and Earth on the 30th, confirmation of impact is expected at ESA’s mission control in Darmstadt, Germany, within 20 minutes of 11:20 GMT (7:20 a.m. EDT). The times will be updated as the trajectory is refined. You can watch live coverage of Rosetta’s final hours on ESA TV .


ESAHangout: Preparing for Rosetta’s grand finale

“It’s hard to believe that Rosetta’s incredible 12.5 year odyssey is almost over, and we’re planning the final set of science operations, but we are certainly looking forward to focusing on analyzing the reams of data for many decades to come,” said Matt Taylor, ESA’s Rosetta project scientist.

The spacecraft will aim at a point just right of the image centre, next to Deir el-Medina, the large pit located slightly below and to the right of centre in this view. Credit: ESA/Rosetta/NAVCAM – CC BY-SA IGO 3.0
The spacecraft landing site is shown in red and located next to Deir el-Medina, a large pit (arrowed). Credit: ESA/Rosetta/NAVCAM – CC BY-SA IGO 3.0

Plans call for the spacecraft to impact the comet somewhere within an ellipse about 1,300 x 2,000 feet (600 x 400 meters) long on 67P’s smaller lobe in the region known as Ma’at. It’s home to several active pits more than 328 feet (100 meters) in diameter and 160-200 feet (50-60 meters) deep, where a number of the comet’s dust jets originate. The walls of the pits are lined with fascinating meter-sized lumpy structures called ‘goosebumps’, which scientists believe could be early ‘cometesimals’, the icy snowballs that stuck together to create the comet in the early days of our Solar System’s formation.

Close-up of a curious surface texture nicknamed ‘goosebumps’. The characteristic scale of all the bumps seen on Comet 67P/Churyumov–Gerasimenko by the OSIRIS narrow-angle camera is approximately 3 m, extending over regions greater than 100 m. They are seen on very steep slopes and on exposed cliff faces, but their formation mechanism is yet to be explained. Credit: ESA/Rosetta/MPS for OSIRIS Team MPS/UPD/LAM/IAA/SSO/INTA/UPM/DASP/IDA
Close-up of a curious surface texture nicknamed ‘goosebumps’. The bumps are about 9 feet (3 meters) across and seen on very steep slopes and exposed cliff faces. They may represent the original balls of icy dust that glommed together to form comets 4.5 billion years ago. Credit: ESA/Rosetta/MPS for OSIRIS Team MPS/UPD/LAM/IAA/SSO/INTA/UPM/DASP/IDA

During free-fall, the spacecraft will target a point adjacent to a 425-foot (130 m) wide, well-defined pit that the mission team has informally named Deir el-Medina, after a structure with a similar appearance in an ancient Egyptian town of the same name. High resolution images should give us a spectacular view of these enigmatic bumps.

While we hate to see Rosetta’s mission end, it’s been a blast going for a 2-year-plus comet ride-along.

Hubble Captures The Sharpest Image Of A Disintegrating Comet Ever

Comet 332P breakup. Credit: NASA, ESA, and D. Jewitt (UCLA)
This NASA Hubble Space Telescope image reveals the ancient Comet 332P/Ikeya-Murakami disintegrating as it approaches the sun. The observations represent one of the sharpest views of an icy comet breaking apart. The comet debris consists of a cluster of building-size chunks near the center of the image. They form a 3,000-mile-long trail, larger than the width of the continental U.S. The fragments are drifting away from the comet at a leisurely pace, roughly the walking speed of an adult. The main nucleus of Comet 332P is the bright object at lower left. It measures 1,600 feet across, about the length of five football fields. Credit: NASA, ESA, and D. Jewitt (UCLA)
This Hubble Space Telescope image reveals the ancient Comet 332P/Ikeya-Murakami disintegrating as it approaches the sun. The comet debris consists of a cluster of building-size chunks near the center of the image. They form a trail larger than the width of the continental U.S. The fragments are drifting away from the comet at a leisurely pace of just a few miles an hour. The main nucleus of Comet 332P is the bright object at lower left. It measures 1,600 feet across, about the length of five football fields. Credit: NASA, ESA, and D. Jewitt (UCLA)

Breaking up isn’t hard to do if you’re a comet. They’re fragile creatures subject to splitting, cracking and vaporizing when heated by the Sun and yanked on by its powerful gravitational pull.

Recently, the Hubble Space Telescope captured one of the sharpest, most detailed observations of a comet breaking apart, which occurred 67 million miles from Earth. In a series of images taken over a three-day span in January 2016, Hubble revealed 25 building-size blocks made of a mixture of ice and dust that are drifting away from the main nucleus of the periodic comet 332P/Ikeya-Murakami at a leisurely pace, about the walking speed of an adult.

332P on UT 2016 January 26, 27 and 28, showing fragments measured in this work. The images are displayed consecutively as an animated gif in order to show the motion of the fragments relative to the parent nucleus (visible as the bright object to the lower left). The actual motions are very slow, of order 1 m/s, and show a fan-like divergence from the parent. Notice that some of the fragments also change in brightness and even shape from day to day. We think this is due to continuing outgassing, rotation and breakup of the fragments.
This animation shows the movement of individual comet fragments relative to the parent nucleus, the bright object at lower left, on January 26, 27 and 28 UT. The true motions are very slow, on the order of several miles an hour, and show a fan-like divergence from the parent. Look closely and you’ll see that some of the fragments change in brightness and even shape from day to day. Researcher David Jewitt thinks this is due to continuing outgassing, rotation and breakup of the fragments. Credit: NASA, ESA, and D. Jewitt (UCLA)

The observations suggest that the comet may be spinning so fast that material is ejected from its surface. The resulting debris is now scattered along a 3,000-mile-long trail, larger than the width of the continental U.S. Much the same happens with small asteroids, when sunlight absorbed unequally across an asteroid’s surface spins up its rotation rate, either causing it to fall apart or fling hunks of itself into space.

Being made of loosely bound frothy ice, comets may be even more volatile compared to the dense rocky composition of many asteroids. The research team suggests that sunlight heated up the comet, causing jets of gas and dust to erupt from its surface. We see this all the time in comets in dramatic images taken by the Rosetta spacecraft of Comet 67P/Churyumov-Gerasimenko. Because the nucleus is so small, these jets act like rocket engines, spinning up the comet’s rotation. The faster spin rate loosened chunks of material, which are drifting off into space.

Comet 168P-Hergenrother was imaged by the Gemini telescope on Nov. 2, 2012 at about 6 a.m. UTC. Image Credit: NASA/JPL-Caltech/Gemini
Comet 168P/Hergenrother was photographed by the Gemini telescope on Nov. 2, 2012 and shows three fragments that broke away from the nucleus streaming from the coma down the tail. Credit: NASA/JPL-Caltech/Gemini

“We know that comets sometimes disintegrate, but we don’t know much about why or how they come apart,” explained lead researcher David Jewitt of the University of California at Los Angeles. “The trouble is that it happens quickly and without warning, and so we don’t have much chance to get useful data. With Hubble’s fantastic resolution, not only do we see really tiny, faint bits of the comet, but we can watch them change from day to day. And that has allowed us to make the best measurements ever obtained on such an object.”

In the animation you can see the comet splinters brighten and fade as icy patches on their surfaces rotate in and out of sunlight. Their shapes even change! Being made of ice and crumbly as a peanut butter cookie, they continue to break apart to spawn a host of smaller cometary bits. The icy relics comprise about 4% of the parent comet and range in size from roughly 65 feet wide to 200 feet wide (20-60 meters). They are moving away from each other at a few miles per hour.

Crack on 67P - a sign of a coming breakup?
The European Space Agency’s Rosetta probe photographed this big crack in the neck region of the double-lobed comer 67P. It’s several feet wide and about 700 feet long. Could it be an indicator that the comet will break into two in the future? Credit: ESA/Rosetta

Comet 332P was slightly beyond the orbit of Mars when Hubble spotted the breakup. The surviving bright nucleus completes a rotation every 2-4 hours, about four times as fast as Comet 67P/Churyumov-Gerasimenko (a.k.a. “Rosetta’s Comet”). Standing on its surface you’d see the sun rise and set in about an hour, akin to how frequently astronauts aboard the International Space Station see sunsets and sunrises orbiting at over 17,000 mph.

Don’t jump for joy though. Since the comet’s just 1,600 feet (488 meters) across, its gravitational powers are too meek to allow visitors the freedom of hopping about lest they find themselves hovering helplessly in space above the icy nucleus.

This illustration shows one possible explanation for the disintegration of asteroid P/2013 R3. It is likely that over the past 4.5 billion years the asteroid was fractured by collisions with other asteroids. The effects of sunlight will have caused the asteroid to slowly increase its rotation rate until the loosely bound fragments drifted apart due to centrifugal forces. Dust drifting off the pieces makes the comet-looking tails. This process may be common for small bodies in the asteroid belt.
This illustration shows one possible explanation for the disintegration of asteroids and comets. The effects of sunlight can cause an asteroid to slowly increase its rotation rate until the loosely bound fragments drift apart due to centrifugal forces. In the case of comets, jets of vaporizing ice have a rocket-like effect that can spin up a nucleus to speeds fast enough for the comet to eject pieces of itself. Credit: NASA, ESA, D. Jewitt (UCLA), and A. Feild (STScI)

Comet 332P was discovered in November 2010, after it surged in brightness and was spotted by two Japanese amateur astronomers, Kaoru Ikeya and Shigeki Murakami. Based on the Hubble data, the team calculated that the comet probably began shedding material between October and December 2015. From the rapid changes seen in the shards over the three days captured in the animation, they probably won’t be around for long.


Spectacular breakup of Comet 73P in 2006

More changes may be in the works. Hubble’s sharp vision also spied a chunk of material close to the comet, which may be the first salvo of another outburst. The remnant from still another flare-up, which may have occurred in 2012, is also visible. The fragment may be as large as Comet 332P, suggesting the comet split in two.

“In the past, astronomers thought that comets die when they are warmed by sunlight, causing their ices to simply vaporize away,” Jewitt said. “Either nothing would be left over or there would be a dead hulk of material where an active comet used to be. But it’s starting to look like fragmentation may be more important. In Comet 332P we may be seeing a comet fragmenting itself into oblivion.”


During its closest approach to the Sun on November 28, 2013, Comet ISON’s nucleus broke apart and soon vaporized away, leaving little more than a ghostly head and fading tail.

Astronomers using the Hubble and other telescopes have seen breakups before, most notably in April 2006 when 73P/Schwassmann-Wachmann 3, which crumbled into more than 60 pieces.  Unlike 332P, the comet wasn’t observed long enough to track the evolution of the fragments, but the images are spectacular!

The researchers estimate that Comet 332P contains enough mass to endure another 25 outbursts. “If the comet has an episode every six years, the equivalent of one orbit around the sun, then it will be gone in 150 years,” Jewitt said. “It’s the blink of an eye, astronomically speaking. The trip to the inner Solar System has doomed it.”

332P on UT 2016 January 26, 27 and 28, showing fragments measured in this work. The images are displayed consecutively as an animated gif in order to show the motion of the fragments relative to the parent nucleus (visible as the bright object to the lower left). The actual motions are very slow, of order 1 m/s, and show a fan-like divergence from the parent. Notice that some of the fragments also change in brightness and even shape from day to day. We think this is due to continuing outgassing, rotation and breakup of the fragments.NASA, ESA, and D. Jewitt (UCLA)
This annotated image shows the fragments measured by Jewitt and team and their direction of movement. Credit: NASA, ESA, and D. Jewitt (UCLA)

332P/Ikeya-Murakami hails from the Kuiper Belt, a vast swarm of icy asteroids and comets beyond Neptune. Leftover building blocks from early Solar System and stuck in a deep freeze in the Kuiper Belt, you’d think they’d be left alone to live their solitary, chilly lives but no. After nearly 4.5 billion years in this icy deep freeze, chaotic gravitational perturbations from Neptune kicked Comet 332P out of the Kuiper Belt.

As the comet traveled across the solar system, it was deflected by the planets, like a ball bouncing around in a pinball machine, until Jupiter’s gravity set its current orbit. Jewitt estimates that a comet from the Kuiper Belt gets tossed into the inner solar system every 40 to 100 years.

I wish I could tell you to grab your scope for a look, but 332P is currently fainter than 15th magnitude and located in Libra low in the southwestern sky at nightfall. Hopefully, we’ll see more images in the coming weeks and months as Jewitt and the team continue to follow the evolution of its icy scraps.

Sentinel-1A Satellite Takes A Direct Hit From Millimetre Size Particle

Sentinel-1 satellite, the first satellite to be launched as part of the ESA/EC's Copernicus program. Credit: ESA/ATG medialab

One of the worst things that can happen during an orbital mission is an impact. Near-Earth orbit is literally filled with debris and particulate matter that moves at very high speeds. At worst, a collision with even the smallest object can have catastrophic consequences. At best, it can delay a mission as technicians on the ground try to determine the damage and correct for it.

This was the case when, on August 23rd, the European Space Agency’s Sentinel-1A satellite was hit by a particle while it orbited the Earth. And after several days of reviewing the data from on-board cameras, ground controllers have determined what the culprit was, identified the affected area, and concluded that it has not interrupted the satellite’s operations.

The Sentinel-1A mission was the first satellite to be launched as part of the ESA’s Copernicus program – which is the worlds largest single earth observation program to date. Since it was deployed in 2014, Sentinel-1A has been monitoring Earth using its C-band Synthetic Aperture Radar, which allows for crystal clear images regardless of weather or light conditions.

The picture shows Sentinel-1A’s solar array before and after the impact of a millimetre-size particle on the second panel. The damaged area has a diameter of about 40 cm, which is consistent on this structure with the impact of a fragment of less than 5 millimetres in size. Credit: ESA
Picturing obtained by one of the Sentinel-1A’s onboard cameras, showing the solar array before and after the impact of a millimeter-size particle on the second panel. Credit: ESA

In addition to tracking oil spills and mapping sea ice, the satellite has also been monitoring the movement of land surfaces. Recently, it provided invaluable insight into the earthquake in Italy that claimed at least 290 lives and caused widespread damage. These images were used by emergency aid organizations to assist in evacuations, and scientists have begun to analyze them for indications of how the quake occurred.

The first indication that something was wrong came on Tuesday, August 23rd, at 17:07 GMT (10:07 PDT, 13:07 EDT), when controllers noted a small power reduction. At the time, the satellite was at an altitude of 700 km, and slight changes in it’s orientation and orbit were also noticed.

After conducting a preliminary investigation, the operations team at the ESA’s control center hypothesized that the satellite’s solar wing had suffered from an impact with a tiny object. After reviewing footage from the on-board cameras, they spotted a 40 cm hole in one of the solar panels, which was consistent with the impact of a fragment measuring less than 5 mm in size.

However, the power loss was not sufficient to interrupt operations, and the ESA was quick to allay fears that this would result in any interruptions of the Sentinel-1A‘s mission. They also indicated that the object’s small size prevented them from advanced warning.

Artist's impression of Sentinel-1A, showing its solar panels fully deployed. Credit and copyright: ESA–P. Carril, 2014
Artist’s impression of Sentinel-1A, showing its solar panels fully deployed. Credit and copyright: ESA–P. Carril, 2014

As Holger Krag – Head of the Space Debris Office at ESA’s establishment in Darmstadt, Germany – said in an agency press release:

“Such hits, caused by particles of millimeter size, are not unexpected. These very small objects are not trackable from the ground, because only objects greater than about 5 cm can usually be tracked and, thus, avoided by maneuvering the satellites. In this case, assuming the change in attitude and the orbit of the satellite at impact, the typical speed of such a fragment, plus additional parameters, our first estimates indicate that the size of the particle was of a few millimeters.

While it is not clear if the object came from a spent rocket or dead satellite, or was merely a tiny clump of rock, Krag indicated that they are determined to find out. “Analysis continues to obtain indications on whether the origin of the object was natural or man-made,” he said. “The pictures of the affected area show a diameter of roughly 40 cm created on the solar array structure, confirming an impact from the back side, as suggested by the satellite’s attitude rate readings.”

In the meantime, the ESA expects that Sentinel-1A will be back online shortly and doing the job for which it was intended. Beyond monitoring land movements, land use, and oil spills, Sentinel-1A also provides up-to-date information in order to help relief workers around the world respond to natural disasters and humanitarian crises.

The Sentinel-1 satellites, part of the European Union’s Copernicus Program, are operated by ESA on behalf of the European Commission.

Further Reading: Sentinel-1

ESA Prepares Revolutionary Air Breathing Rocket Engine

The SABRE (Synergistic Air-Breathing Rocket Engine) could revolutionize access to space. Image: Reaction Engines

If new rocket engines being developed by the European Space Agency (ESA) are successful, they could revolutionize rocket technology and change the way we get to space. The engine, called the Synergistic Air-Breathing Rocket Engine (SABRE), is designed to use atmospheric air in the early flight stages, before switching to conventional rocket mode for the final ascent to space. If all goes well, this new air-breathing rocket could be ready for test firings in about four years.

Conventional rockets have to carry an on-board oxidizer such as liquid oxygen, which is combined with fuel in the rocket’s combustion chamber. This means rockets can require in excess of 250 tons of liquid oxygen in order to function. Once this oxygen is consumed in the first stages, these used up stages are discarded, creating massive waste and expense. (Companies like SpaceX and Blue Origin are developing re-usable rockets to help circumvent this problem, but they’re still conventional rockets.)

Conventional rockets carry their own oxygen because its temperature and pressure can be controlled. This guarantees the performance of the rocket, but requires complicated systems to do so. SABRE will eliminate the need for carrying most on-board oxygen, but this is not easy to do.

SABRE’s challenge is to compress the atmospheric oxygen to about 140 atmospheres before introducing it into the engine’s combustion chambers. But compressing the oxygen to that degree raises its temperature so much that it would melt the engines. The solution to that is to cool the air with a pre-cooling heat exchanger, to the point where it’s almost a liquid. At that point, a turbine based on standard jet engine technology can compress the air to the required operating temperature.

This means that while SABRE is in Earth’s atmosphere, it uses air to burn its hydrogen fuel, rather than liquid oxygen. This gives it an 8 x improvement in propellant consumption. Once SABRE has reached about 25 km in altitude, where the air is thinner, it switches modes and operates as a standard rocket. By the time it switches modes, it’s already about 20% of the way into Earth orbit.

Like a lot of engineering challenges, understanding what needs to be done is not the hard part. Actually developing these technologies is extremely difficult, even though many people just assume engineers will be successful. The key for Reaction Engines Ltd, the company developing SABRE, is to develop the light weight heat exchangers at the heart of the engine.

Heat exchangers are common in industry, but these heat exchangers have to cool incoming air from 1000 Celsius to -150 Celsius in less than 1/100th of a second, and they have to do it while preventing frost from forming. They are extremely light, at about 100 times lighter than current technology, which will allow them to be used in aerospace for the first time. Some of the lightness factor of these new heat exchanges stems from the wall thickness of the tubing, which is less than 30 microns. That’s less than the thickness of a human hair.

Reaction Engines Limited says that these heat exchangers will have the same impact on aerospace propulsion systems that silicone chips had on computing.

A new funding agreement with the ESA will provide Reaction Engines with 10 million Euros for continued development of SABRE. This will add to the 50 million Pounds that the UK Space Agency has already contributed. That 50 million Pound investment was the result of a favorable viability review of SABRE that the ESA performed in 2010.

In 2012 the pre-cooler, a vital component of SABRE, was successfully tested at Reaction Engines facility in Oxfordshire, UK. Image: ESA/Reaction Engines

IN 2012, the pre-cooler and the heat exchangers were tested. After that came more R&D, including the development of altitude-compensating rocket nozzles, thrust chamber cooling, and air intakes.

Now that the feasibility of SABRE has been strengthened, Reaction Engines wants to build a ground demonstrator engine by 2020. If the continued development of SABRE goes well, and if testing by 2020 is successful, then these Air Breathing rocket engines will be in a position to truly revolutionize access to space.

In ESA’s words, “ESA are confident that a ground test of a sub-scale engine can be successfully performed to demonstrate the flight regime and cycle and will be a critical milestone in the development of this program and a major breakthrough in propulsion worldwide.”

Bring it on.

Stars Are The Universe’s Neat Freaks

The Andromeda Galaxy, viewed using conventional optics and IR. Credit: Kitt Peak National Observatory

Imagine, if you will, that the Universe was once a much dirtier place than it is today. Imagine also that what we see around us, a relatively clean and unobscured Universe, is the result of billions of years of stars behaving like giant celestial Roombas, cleaning up the space around them in preparation for our arrival. According to a set of recently published catalogues, which detail the latest findings from the ESA’s Herschel Space Observatory, this description is actually quite fitting.

These catalogues represents the work of an international team of over 100 astronomers who have spent the past seven years analyzing the infrared images taken by the Herschel Astrophysical Terahertz Large Area Survey (Herschel-ATLAS). Presented earlier this week at the National Astronomy Meeting in Nottingham, this catalogue revealed that 1 billion years after the Big Bang, the Universe looked much different than it does today.

In order to put this research into context, it is important to understand the important of infrared astronomy. Prior to the deployment of missions like Herschel (which was launched in 2009), astronomers were unable to see a good portion of the light emitted by stars and galaxies. With roughly half of this light being absorbed by interstellar dust grains, research into the birth and lives of galaxies was difficult.

But thanks to surveys like Herschel ATLAS – as well NASA’s Spitzer Space Telescope and the Wide-field Infrared Survey Explorer (WISE) – astronomers have been able to account for this missing energy. And what they have seen (especially from this latest survey) has been quite remarkable, presenting a Universe that is far denser than previously expected.

Artist's impression of the Herschel Space Telescope. Credit: ESA/AOES Medialab/NASA/ESA/STScI
Artist’s impression of the Herschel Space Telescope. Credit: ESA/AOES Medialab/NASA/ESA/STScI

Professor Haley Gomez of Cardiff University presented this catalogue during the third day of the National Astronomy Meeting (which ran from June 27th to July 1st). As she told Universe Today via email:

“The Herschel survey is the largest one of the sky in these special infrared light. Because of this we see rare objects that we might not see in a smaller patch of sky, but also we now see hundreds of thousands of dusty galaxies, compared to the few hundred we saw in previous telescopes. So this is a massive improvement in terms of knowing what kinds of galaxies there are. Some of these are so covered in dust we might never had seen them using visible light telescopes. Because of the unprecedented large area we have with this Herschel survey, we see a huge variety in the type of objects too, from nearby dusty star forming clouds, to nearby dusty galaxies like Andromeda, to galaxies that shone their infrared light more than 12 billion years ago.  We can also use this survey to understand the structure of galaxies in the universe – the so-called cosmic web in a way we’ve never been able to do in the far infrared.”

The images they showed gave all those present a glimpse of the unseen stars and galaxies that have existed over the last 12 billion years of cosmic history. In sum,  over half-a-million far-infrared sources have been spotted by the Herschel-ATLAS survey. Many of these sources were galaxies that are nearby and similar to our own, and which are detectable using using conventional telescopes.

The others were much more distant, their light taking billions of years to reach us, and were obscured by concentrations of cosmic dust. The most distant of these galaxies were roughly 12 billion light-years away, which means that they appeared as they would have 12 billion years ago.

Herschel fig2smallAn illustration of the time reach of the Herschel ATLAS and the kinds of objects it has discovered. Credit: Herschel-ATLAS/ESA/ALMA/ NRAO

Ergo, astronomers now know that 12 billion years ago (i.e. shortly after the Big Bang)., stars and galaxies were much dustier than they are now. They further concluded that the evolution of our galaxies since shortly after the Big Bang has essentially been a major clean-up effort, as stars gradually absorbed the dust that obscured their light, thus making it the more “visible” place it is today.

The data released by the survey includes several maps and additional files which were described in an article produced by Dr. Elisabetta Valiante and a research team from Cardiff University – titled “The Herschel-ATLAS Data Release 1 Paper I: Maps, Catalogues and Number Counts“. As Dr. Valiante told Universe Today via email:

“Gas and dust are the main components of stars: they collapse to form stars and they are ejected at the end of stars’ life. The interesting thing that has been discovered thanks to the Herschel data is that the two phenomena are not in equilibrium. We knew this was true 10 billion years ago, but we expected, according to the current models, that some equilibrium was reached at more recent times. Instead, the amount of dust in galaxies 5 billion years ago was much larger than the amount we see in galaxies today: this was unexpected.”

Until recently, such a survey would have been impossible due to the fact that many of these infrared sources would have  been invisible to astronomers. The reason for this, which was revealed by the survey, was that these galaxies were so dusty that they would have been virtually impossible to detect with conventional optics. What’s more, their light would have been gravitationally magnified by intervening galaxies.

"This dazzling infrared image from NASA's Spitzer Space Telescope shows hundreds of thousands of stars crowded into the swirling core of our spiral Milky Way galaxy. In visible-light pictures, this region cannot be seen at all because dust lying between Earth and the galactic center blocks our view. Credit: NASA/JPL-Caltech
Infrared images (like the one captured by NASA’s Spitzer Space Telescope here) show countless stars and galaxies that are obscured in visible-light by cosmic dust. Credit: NASA/JPL-Caltech

The huge size of the survey has also meant that changes that have occurred in galaxies – relatively recent in cosmic history – can be studied for the first time. For instance, the survey showed that even only one billion years in the past, a small fraction of the age of the universe, galaxies were forming stars at a faster rate and contained more dust than they do today.

Dr. Nathan Bourne – from the University of Edinburgh – is the lead author of another other paper describing the catalogues. As he told Universe Today via email:

“We can think of galaxies as big recycling machines. When they form, they accrete gas (mostly hydrogen and helium, with traces of lithium and a couple of other elements) from the universe around them, and they turn it into stars. As time goes on, the stars pump this gas back out into the galaxy, into the interstellar medium. Due to the nuclear processes within the stars, the gas is now enriched by heavy elements (what we call metals, though they include both metals and non-metals), and some of these form microscopic solid particles of dust, as a sort of by-product.

“But there are still stars forming, and the next generations of stars recycle this interstellar material, and now that it contains heavy elements and dust, things are a bit different, and planets can also form around the new stars, from accumulations of this heavy material. So, if you look at the big picture, when the first galaxies started forming within the first billion years after the Big Bang, they began using up the gas around them, and then while they are active they fill their interstellar medium up with gas and dust, but by the end of a galaxy’s lifecycle, it has used up all this gas and dust, and you could say that it has cleaned itself.”

The catalogues and maps of the hidden universe are a triumph for the Herschel team. Despite the fact that the last information obtained by the Herschel observatory was back in 2013, the maps and catalogues produced from its years of service have become vital to astronomers. In addition to showing the Universe’s hidden energy, they are also laying the groundwork for future research.

. Credit: NASA/JPL-Caltech/UCLA (top), NASA/DIRBE Team/COBE/ (bottom)
IR images of the entire sky take by the WISE All-Sky Data Release (top), and a projection of the IR sky created by images taken by the COBE spacecraft (bottom). Credit: NASA/JPL-Caltech/UCLA (top), NASA/DIRBE Team/COBE/ (bottom)

“Now we need to explain why there is dust where we did not expect to find it.” said Valiante. “And to explain this, we need to change our theories about how the Universe evolves. Our data poses a challenge we have accepted, but we haven’t overcome it yet!”

“[W]e understand a lot more about how galaxies evolve,” added Bourne, “about when most of the stars formed, what happens to the gas and dust as galaxies evolve, and how rapidly the star-forming activity in the Universe as a whole has faded in the latter half of the Universe’s history. It’s fair to say that this understanding comes from having a whole suite of different types of instruments studying different aspects of galaxies in complementary ways, but Herschel has certainly contributed a major part of that effort and will have a lasting legacy.”

Ensuring Herschel’s lasting legacy is one of the main aims of the Herschel Extragalactic Project (HELP) program, which is overseen by the EU Research Executive Agency. Other projects they oversee include the Herschel Multi-tiered Extragalactic Survey (HerMES), which also released survey data late last month. All of this has left a lasting mark on the field of astronomy, despite the fact that Herschel is no longer in operation. As Professor Gomez said of the Herschel Observatory’s enduring contributions:

“The Herschel Space Observatory stopped taking data in 2013, yet our understanding of the dusty universe is really only just starting with the release of large surveys and galaxy catalogues in recent months. Ultimately, once astronomers have gone through all the valuable data, Herschel will have provided a view of the infrared universe covering 1000 square degrees of the sky.”

The implications of these findings are also likely to have a far-reaching effect, ranging from cosmology and astronomy, to perhaps shedding some light on that tricky Fermi paradox. Could it be intelligent life that emerged billions of years ago didn’t venture to other star systems because they couldn’t see them? Just a thought…

Further Reading: Royal Astronomical Society, ESA

Webb Telescope Gets its Science Instruments Installed

In this rare view, the James Webb Space Telescope team crane lifted the science instrument package for installation into the telescope structure. Credits: NASA/Chris Gunn
In this rare view, the James Webb Space Telescope team crane lifted the science instrument package for installation into the telescope structure.  Credits: NASA/Chris Gunn
In this rare view, the James Webb Space Telescope team crane lifted the science instrument package for installation into the telescope structure. Credits: NASA/Chris Gunn

The package of powerful science instruments at the heart of NASA’s mammoth James Webb Space Telescope (JWST) have been successfully installed into the telescopes structure.

A team of two dozen engineers and technicians working with “surgical precision” inside the world’s largest clean room at NASA’s Goddard Space Flight Center in Greenbelt, Maryland, meticulously guided the instrument package known as the ISIM (Integrated Science Instrument Module) into the telescope truss structure.

ISIM is located right behind the 6.5 meter diameter golden primary mirror – as seen in NASA’s and my photos herein.

The ISIM holds the observatory’s international quartet of state-of-the-art research instruments, funded, built and provided by research teams in the US, Canada and Europe.

“This is a tremendous accomplishment for our worldwide team,” said John Mather, James Webb Space Telescope Project Scientist and Nobel Laureate, in a statement.

“There are vital instruments in this package from Europe and Canada as well as the US and we are so proud that everything is working so beautifully, 20 years after we started designing our observatory.”

This side shot shows a glimpse inside a massive clean room at NASA's Goddard Space Flight Center in Greenbelt, Maryland where the James Webb Space Telescope team worked meticulously to complete the science instrument package installation.  Credits: NASA/Desiree Stover
This side shot shows a glimpse inside a massive clean room at NASA’s Goddard Space Flight Center in Greenbelt, Maryland where the James Webb Space Telescope team worked meticulously to complete the science instrument package installation. Credits: NASA/Desiree Stover

Just as with the mirrors installation and other assembly tasks, the technicians practiced the crucial ISIM installation procedure numerous times via test runs, computer modeling and a mock-up of the instrument package.

To accomplish the ISIM installation, the telescope structure had to be flipped over and placed into the giant work gantry in the clean room to enable access by the technicians.

“The telescope structure has to be turned over and put into the gantry system [in the clean room],” said John Durning, Webb Telescope Deputy Project Manager, in an exclusive interview with Universe Today at NASA’s Goddard Space Flight Center.

“Then we take ISIM and install in the back of the telescope.”

The team used an overhead crane to lift and maneuver the heavy ISIM science instrument package in the clean room. Then they lowered it into the enclosure behind the mirrors on the telescopes backside and secured it to the structure.

“Our personnel were navigating a very tight space with very valuable hardware,” said Jamie Dunn, ISIM Manager.

“We needed the room to be quiet so if someone said something we would be able to hear them. You listen not only for what other people say, but to hear if something doesn’t sound right.”

Up close view shows cone shaped Aft Optics Subsystem (AOS) standing at center of Webb telescopes 18 segment primary mirror at NASA's Goddard Space Flight Center in Greenbelt, Maryland on May 3, 2016.  ISIM science instrument module will be installed inside truss structure below.  Credit: Ken Kremer/kenkremer.com
Up close view shows cone shaped Aft Optics Subsystem (AOS) standing at center of Webb telescopes 18 segment primary mirror at NASA’s Goddard Space Flight Center in Greenbelt, Maryland on May 3, 2016. ISIM science instrument module will be installed inside truss structure below. Credit: Ken Kremer/kenkremer.com

The ISIM installation continues the excellently executed final assembly phase of Webb at Goddard this year. And comes just weeks after workers finished installing the entire mirror system.

This author has witnessed and reported on the assembly progress at Goddard on numerous occasions, including after the mirrors were recently uncovered and unveiled in all their golden glory.

“The entire mirror system is checked out. The system has been integrated and the alignment has been checked,” said John Durning, Webb Telescope Deputy Project Manager, in an exclusive interview with Universe Today at NASA’s Goddard Space Flight Center.

Up close side-view of newly exposed gold coated primary mirrors installed onto mirror backplane holding structure of  NASA’s James Webb Space Telescope inside the massive clean room at NASA's Goddard Space Flight Center in Greenbelt, Maryland on May 3, 2016.   Aft optics subsystem stands upright at center of 18 mirror segments between stowed secondary mirror mount booms.  Credit: Ken Kremer/kenkremer.com
Up close side-view of newly exposed gold coated primary mirrors installed onto mirror backplane holding structure of NASA’s James Webb Space Telescope inside the massive clean room at NASA’s Goddard Space Flight Center in Greenbelt, Maryland on May 3, 2016. Aft optics subsystem stands upright at center of 18 mirror segments between stowed secondary mirror mount booms. Credit: Ken Kremer/kenkremer.com

ISIM is a collection of cameras and spectrographs that will record the light collected by Webb’s giant golden primary mirror.

“It will take us a few months to install ISIM and align it and make sure everything is where it needs to be,” Durning told me.

The primary mirror is comprised of 18 hexagonal segments.

Each of the 18 hexagonal-shaped primary mirror segments measures just over 4.2 feet (1.3 meters) across and weighs approximately 88 pounds (40 kilograms). They are made of beryllium, gold coated and about the size of a coffee table.

Webb’s golden mirror structure was tilted up for a very brief period on May 4 as seen in this NASA time-lapse video:

The 18-segment primary mirror of NASA’s James Webb Space Telescope was raised into vertical alignment in the largest clean room at the agency’s Goddard Space Flight Center in Greenbelt, Maryland, on May 4, 2016. Credit: NASA

The gargantuan observatory will significantly exceed the light gathering power of NASA’s Hubble Space Telescope (HST) – currently the most powerful space telescope ever sent to space.

With the mirror structure complete, the next step was the ISIM science module installation.

To accomplish that installation, technicians carefully moved the Webb mirror structure into the clean room gantry structure.

As shown in this time-lapse video we created from Webbcam images, they tilted the structure vertically, flipped it around, lowered it back down horizontally and then transported it via an overhead crane into the work platform.

Time-lapse showing the uncovered 18-segment primary mirror of NASA’s James Webb Space Telescope being raised into vertical position, flipped and lowered upside down to horizontal position and then moved to processing gantry in the largest clean room at the agency’s Goddard Space Flight Center in Greenbelt, Maryland, on May 4/5, 2016. Images: NASA Webbcam. Time-lapse by Ken Kremer/kenkremer.com/Alex Polimeni

The telescope will launch on an Ariane V booster from the Guiana Space Center in Kourou, French Guiana in 2018.

The Webb Telescope is a joint international collaborative project between NASA, the European Space Agency (ESA) and the Canadian Space Agency (CSA).

Webb is designed to look at the first light of the Universe and will be able to peer back in time to when the first stars and first galaxies were forming. It will also study the history of our universe and the formation of our solar system as well as other solar systems and exoplanets, some of which may be capable of supporting life on planets similar to Earth.

All 18 gold coated primary mirrors of NASA’s James Webb Space Telescope are seen fully unveiled after removal of protective covers installed onto the backplane structure, as technicians work inside the massive clean room at NASA's Goddard Space Flight Center in Greenbelt, Maryland on May 3, 2016.  The secondary mirror mount booms are folded down into stowed for launch configuration. Credit: Ken Kremer/kenkremer.com
All 18 gold coated primary mirrors of NASA’s James Webb Space Telescope are seen fully unveiled after removal of protective covers installed onto the backplane structure, as technicians work inside the massive clean room at NASA’s Goddard Space Flight Center in Greenbelt, Maryland on May 3, 2016. The secondary mirror mount booms are folded down into stowed for launch configuration. Credit: Ken Kremer/kenkremer.com

More about ISIM and upcoming testing in the next story.

Watch this space for my ongoing reports on JWST mirrors, science, construction and testing.

Stay tuned here for Ken’s continuing Earth and Planetary science and human spaceflight news.

Ken Kremer