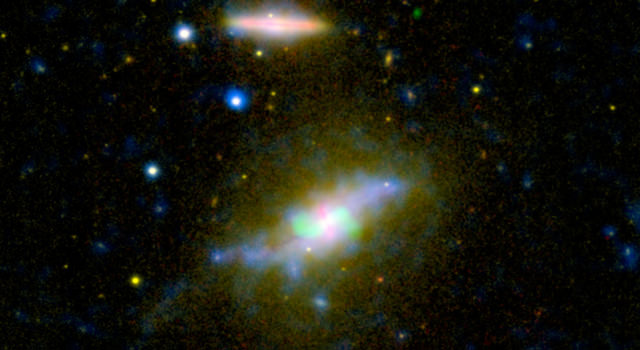
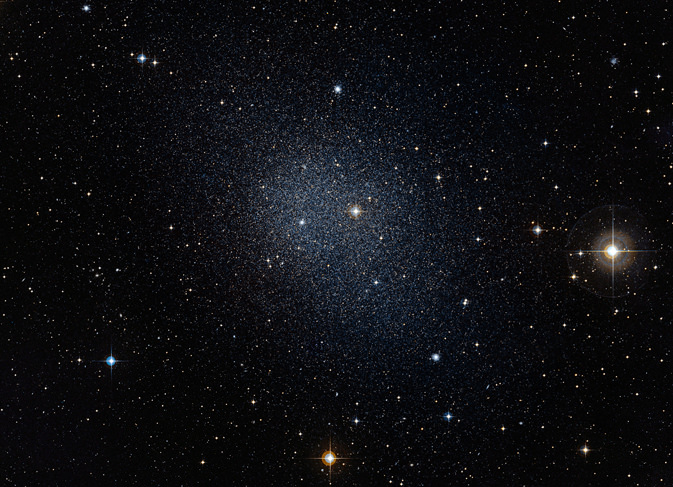
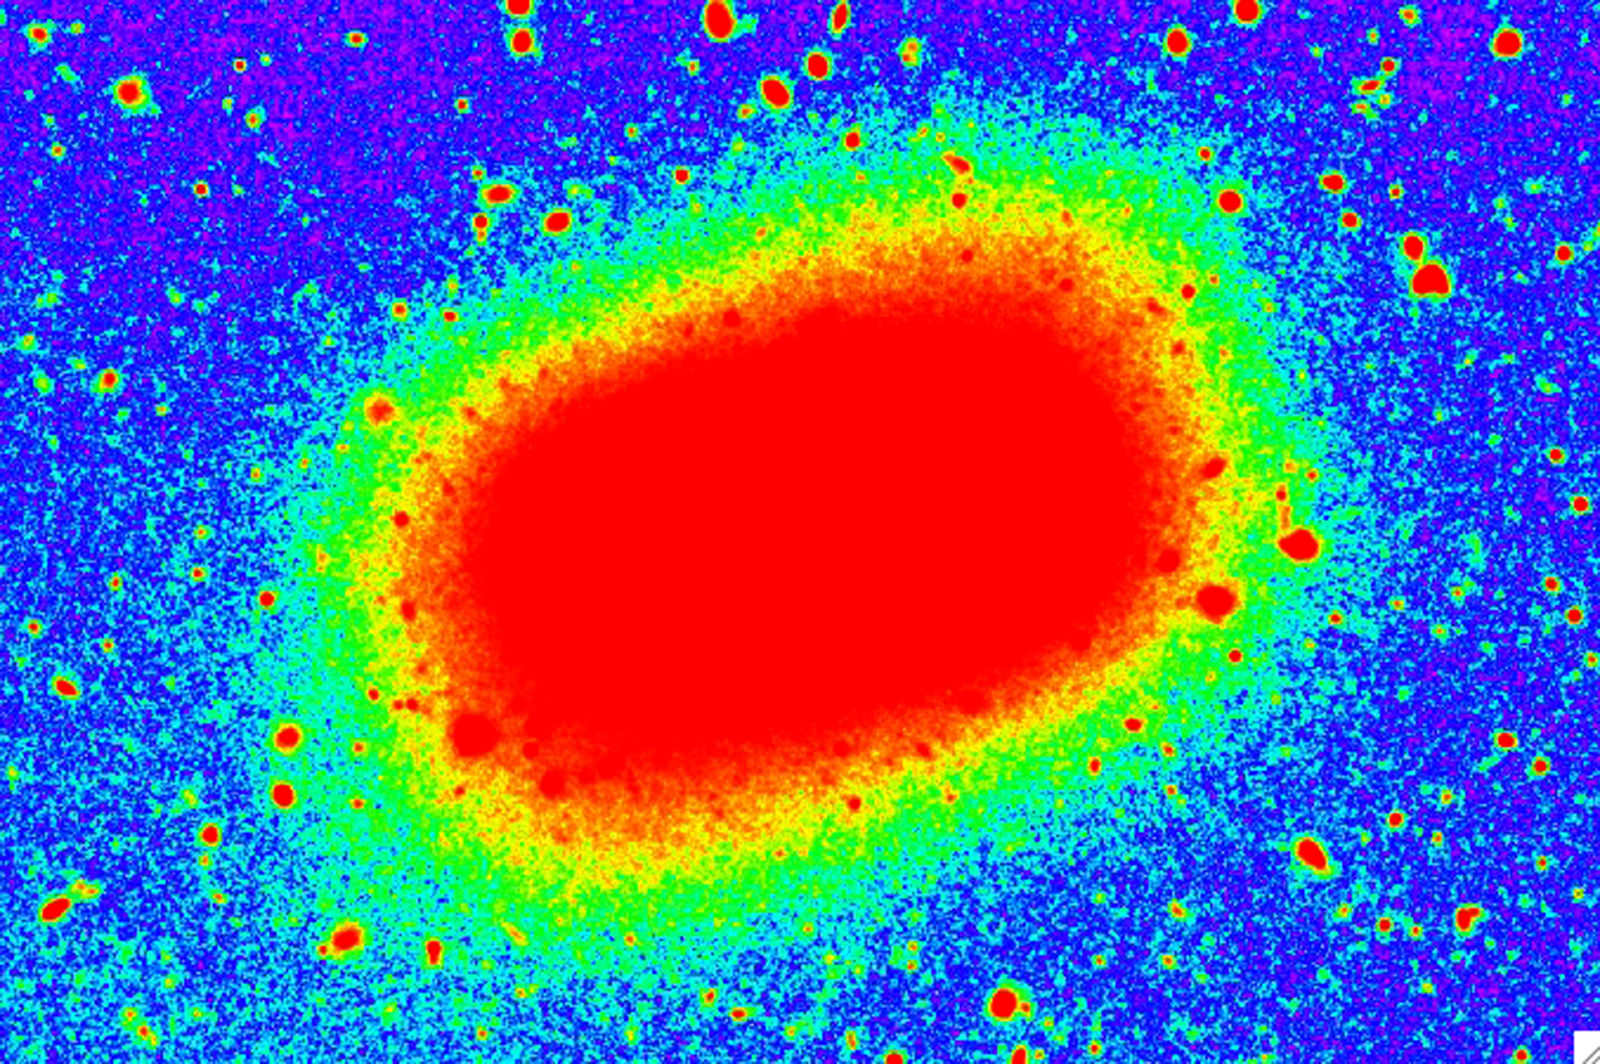
Space may be vast, but accidents can still happen, like when galaxies “collide,” usually resulting in the smaller one having its stars scattered by the larger one. New high-resolution images of two dwarf galaxies merging together have now been obtained by astronomers, providing a more detailed look at something which could only barely be seen before. While the larger galaxy of the two, NGC 4449, is easily visible, its smaller companion was little more than just a faint smudge until now.
The new study comes from an international team of astronomers led by David Martínez-Delgado of the Max Planck Institute for Astronomy in Heidelberg. Their paper will be published in an upcoming issue of Astrophysical Journal Letters.
When the galaxies collide, the smaller one essentially gets torn apart by the larger one. As explained by Aaron Romanowsky, an astronomer at the University of California, Santa Cruz (UCSC), “This is how galaxies grow. You can see the smaller galaxy coming in and getting shredded, eventually leaving its stars scattered through the halo of the host galaxy.”
The remains of the smaller galaxy appear as a dense stream of stars in the outer regions of the larger one. It was initially seen as just a faint smudge in digitized photographic plates from the Digitized Sky Survey project. Because this smaller galaxy, or what’s left of it, is so difficult to see, the merging process has been referred to as a “stealth merger.”
The new images, taken by the Black Bird Observatory and Subaru Telescope, show the merger in such detail that individual stars can be seen. “I don’t think I’d ever seen a picture of a galaxy merger where you can see the individual stars. It’s really an impressive image,” said Romanowsky.
NGC 4449 is about 12.5 million light-years from Earth and is part of a group of galaxies found in the constellation Canes Venatici. It is similar to one of our own Milky Way’s satellite galaxies, the Large Magellanic Cloud.
While larger galaxies merging with other large galaxies are commonly seen, it has been more difficult to find examples of smaller galaxies doing the same thing. Romanowsky continues: “We should see the same things at smaller scales, with small galaxies eating smaller ones and so on. Now we have this beautiful image of a dwarf galaxy consuming a smaller dwarf.”
In addition, the companion galaxy was also independently discovered by astronomers at the University of California, Los Angeles (UCLA). Their own paper will be published in the February 9, 2012 issue of Nature.
The paper is available here. See also the Subaru Telescope press release here.
Score another one for citizen science! In a study released just days ago, a new catalog containing over five thousand infrared bubble entries was added through the “Milky Way Project” website. The work was done independently by at least five participants who measured parameters for position, radius, thickness, eccentricity and position angle. Not only did their work focus on these areas, but the non-professionals were responsible for recovering the locations of at least 86% of additional bubble and HII catalogs. Cool stuff? You bet. Almost one third of the Milky Way Project’s studied bubbles are located at the edge of an even larger bubble – or have more lodged inside. This opens the door to further understanding the dynamics of triggered star formation!
Just what is the Milky Way Project? Thanks to the Galaxy Zoo and Zooniverse, scientists have been able to enlist the help of an extensive community of volunteers able to tackle and analyze huge amounts of data – data that contains information which computer algorithms might miss. In this case it’s visually searching through the Galactic plane for whole or broken ring-shaped structures in images done by Spitzer’s Galactic Legacy Infrared Survey Extraordinaire (GLIMPSE) project. Here the bubbles overlap and the structures are so complex that only humans can sort them out for now.
“The MWP is the ninth online citizen science project created using the Zooniverse Application Programming Interface
(API) tool set. The Zooniverse API is the core software supporting the activities of all Zooniverse citizen science projects.” says R. J. Simpson (et al). “Built originally for Galaxy Zoo 2, the software is now being used by 11 different projects. The Zooniverse API is designed primarily as a tool for serving up a large collection of `assets’ (for example, images or video) to an interface, and collecting back user-generated interactions with these assets.”
Through the interface, users mark the location of bubbles and other areas of significance such as small bubbles, green knots, dark nebulae, star clusters, galaxies, fuzzy red objects or simply unknowns. During this phase, the citizen scientist can make as many annotations as he or she wants before they submit their findings and receive a new assignment. Each annotated image is then stored in a database as a classification and the user can access their image again in an area of the website known as “My Galaxy”. However, images may only be classified once.
When identifying galactic bubbles, the user creates a circle around the area which can be scaled to size and stretched into an elliptical configuration. Initially as the object is identified and marked, the user can control the position and size of the bubble. Once annotated the parameters can be edited, such as the ellipticity, annular thickness and rotation. The program even allows for regions where no obvious emission is present, such as a broken or partial bubble. This allows the user to match the bubbles they find in individual images to achieve an accurate representation You can even mark a favorite or interesting configuration as well!
“In order to assist in the data-reduction process, users are given scores according to how experienced they are at drawing bubbles. We treat the first 10 bubbles a user draws as practice drawings and these are not included in the final reduction. Users begin with a score of 0 and are given scores according to the number of precision bubbles they have drawn.” explains the team. “Precision bubbles are those drawn using the full tool set, meaning they have to have adjusted the ellipticity, the thickness and the rotation. This is done to ensure that users’ scores reflect their ability to draw bubbles well. While only precision bubbles are used to score volunteers, all bubbles drawn as included in the data reduction. The scores are used as weights when averaging the bubble drawings to produce the catalogue.”
Now it’s time to combine all that data. As of October of last year, the program has created a database of 520,120 user-drawn bubbles. The information is then sorted out and processed – with many inclusions left for further investigation. However, not all bubbles make the cut. When it comes to this project, only bubbles that have been identified fifty times or more are included into the catalog. What remains is a “clean bubble” – one that has been verified by at least five users and picked out at least 10% of the time by the volunteers when displayed.
“It is not known how many bubbles exist in the Galaxy, hence it is impossible to quantify the completeness of the MWP catalogue. There will be bubbles that are either not visible in the data used on the MWP, or that are not seen as bubbles.” says the team. “Distant bubbles may be obscured by foreground extinction. Faint bubbles may be masked by bright Galactic background emission or confused with brighter nebular structures. Fragmented or highly distorted bubbles present at high inclination angles may not appear as bubbles to the observer.”
But don’t let it burst your bubble. This citizen science approach is an excellent idea from the the standpoint of observer objectivity and the final, reduced catalogue contains 5,106 visually identified bubbles. Of these, they are divided into a catalogue of 3,744 large bubbles identified by users as ellipses, and a catalogue of 1,362 small bubbles annotated by users at the highest zoom level images in the MWP.
And that’s not all… “In addition to the reduced bubble catalogue, a crowd sourced `heat map’ of bubble drawings has also been produced. The MWP `heat maps’ allow the bubble drawings to be explored without them needing to be reduced to elliptical annuli. Rather, the `heat maps’ allow contours of overlapping classifications to be drawn over regions of the Galactic plane reflecting levels of agreement between independent classifiers. In most cases the structures outlined in these maps are photo-dissociation regions traced by 8 um emission, but more fundamentally they are regions that multiple volunteers agree reflect the rims of bubbles.”
Yep. They are bubbles alright. Bubble produced around huge stars when an HII region is hollowed out by thermal overpressure, stellar winds, radiation pressure or a combination of them all. This impacts the surrounding, cold interstellar medium and creates a visible shell – or bubble. These regions serve as perfect observation points “to test theories of sequential, massive star formation triggered by massive star winds and radiation pressure” and to keep us forever fascinated…
Recently we took a look at a very unusual type of map – the Faraday Sky. Now an international team of scientists, including those at the Naval Research Laboratory, have pooled their information and created one of the most high precision maps to date of the Milky Way’s magnetic fields. Like all galaxies, ours has a magnetic “personality”, but just where these fields come from and how they are created is a genuine mystery. Researchers have always simply assumed they were created by mechanical processes like those which occur in Earth’s interior and the Sun. Now a new study will give scientists an even better understanding about the structure of galactic magnetic fields as seen throughout our galaxy.
The team, led by the Max Planck Institute for Astrophysics (MPA), gathered their information and compiled it with theoretical simulations to create yet another detailed map of the magnetic sky. As NRL’s Dr. Tracy Clarke, a member of the research team explains, “The key to applying these new techniques is that this project brings together over 30 researchers with 26 different projects and more than 41,000 measurements across the sky. The resulting database is equivalent to peppering the entire sky with sources separated by an angular distance of two full moons.” This huge amount of data provides a new “all-sky” look which will enable scientists to measure the magnetic structure of the Milky Way in minute detail.
Just what’s so “new” about this map? This time we’re looking at a quantity called Faraday depth – an idea dependent on a line-of-sight information set on the magnetic fields. It was created by combining more than 41,000 singular measurements which were then combined using a new image reconstruction method. In this case, all the researchers at MPA are specialists in the new discipline of information field theory. Dr. Tracy Clarke, working in NRL’s Remote Sensing Division, is part of the team of international radio astronomers who provided the radio observations for the database. It’s magnetism on a grand scale… and imparts even the smallest of magnetic features which will enable scientists to further understand the nature of galactic gas turbulence.
The concept of the Faraday effect isn’t new. Scientists have been observing and measuring these fields for the last century and a half. Just how is it done? When polarized light passes through a magnetized medium, the plane of the polarization flips… a process known as Faraday rotation. The amount of rotation shows the direction and strength of the field and thereby its properties. Polarized light is also generated from radio sources. By using different frequencies, the Faraday rotation can also be measured in this alternative way. By combining all of these unique measurements, researchers can acquire information about a single path through the Milky Way. To further enhance the “big picture”, information must be gathered from a variety of sources – a need filled by 26 different observing projects that netted a total of 41,330 individual measurements. To give you a clue of the size, that ends up being about one radio source per square degree of sky!
Even with depth like this, there are still areas in the southern sky where only a few measurements have been cataloged. To fill in the gaps and give a more realistic view, researchers “have to interpolate between the existing data points that they have recorded.” However, this type of data causes some problems with accuracy. While you might think the more exact measurements would have the greatest impact on the map, scientists aren’t quite sure how reliable any single measurement could be – especially when they could be influenced by the environment around them. In this case, the most accurate measurements don’t always rank the highest in mapping points. Like Heisenberg, there’s an uncertainty associated with the process of obtaining measurements because the process is so complex. Just one small mistake could lead to a huge distortion in the map’s contents.
Thanks to an algorithm crafted by the MPA, scientists are able to face these types of difficulties with confidence as they put together the images. The algorithm, called the “extended critical filter,” employs tools from new disciplines known as information field theory – a logical and statistical method applied to fields. So far it has proven to be an effective method of weeding out errors and has even proven itself to be an asset to other scientific fields such as medicine or geography for a range of image and signal-processing applications.
Even though this new map is a great assistant for studying our own galaxy, it will help pave the way for researchers studying extragalactic magnetic fields as well. As the future provides new types of radio telescopes such as LOFAR, eVLA, ASKAP, MeerKAT and the SKA , the map will be a major resource of measurements of the Faraday effect – allowing scientists to update the image and further our understanding of the origin of galactic magnetic fields.
Is this what we look like? Astronomers don’t know for sure exactly what the Milky Way looks like, but searching out other barred spiral galaxies like this one is helping scientists to learn more about our home. Galaxy NGC 1073 is located in the constellation of Cetus (The Sea Monster).Most of the known spiral galaxies have a bar structure in their center, and this new image offer a stunning, if not clear view of one of these types of galaxies.
One piece of information that might be available from a central bar is the galaxy’s age. Some astronomers have suggested that the formation of a this structure might signal a spiral galaxy’s passage from intense star-formation into adulthood. Two-thirds of nearby, younger galaxies have the bar, while only a fifth of older, more distant spirals have one.
While Hubble’s image of NGC 1073 is in some respects an archetypal portrait of a barred spiral, the Hubble team have pointed out a couple of quirks.
One, ironically, is almost — but not quite — invisible to optical telescopes like Hubble. In the upper left part of the image, a rough ring-like structure of recent star formation hides a bright source of X-rays. Called IXO 5, this X-ray source is likely to be a binary system featuring a black hole and a star orbiting each other. Comparing X-ray observations from the Chandra spacecraft with this Hubble image, astronomers have narrowed the position of IXO 5 down to one of two faint stars visible here. However, X-ray observations with current instruments are not precise enough to conclusively determine which of the two it is.
Hubble’s image does not only tell us about a galaxy in our own cosmic neighborhood, however. We can also discern glimpses of objects much further away, whose light tells us about earlier eras in cosmic history.
Right across Hubble’s field of view, more distant galaxies are peering through NGC 1073, with several reddish examples appearing clearly in the top left part of the frame.
More intriguing still, three of the bright points of light in this image are neither foreground stars from the Milky Way, nor even distant stars in NGC 1073. In fact they are not stars at all. They are quasars, incredibly bright sources of light caused by matter heating up and falling into supermassive black holes in galaxies literally billions of light-years from us. The chance alignment through NGC 1073, and their incredible brightness, might make them look like they are part of the galaxy, but they are in fact some of the most distant objects observable in the Universe.
Less than a year ago, the Hubble Space Telescope’s Wide Field Camera 3 captured an amazing image – a giant lensed galaxy arc. Gravitational lensing produces a natural “zoom” to observations and this is a look at one of the brightest distant galaxies so far known. Located some 10 billion light years away, the galaxy has been magnified as a nearly 90-degree arc of light against the galaxy cluster RCS2 032727-132623 – which is only half the distance. In this unusual case, the background galaxy is over three times brighter than typically lensed galaxies… and a unique look back in time as to what a powerful star-forming galaxy looked like when the Universe was only about one third its present age.
A team of astronomers led by Jane Rigby of NASA’s Goddard Space Flight Center in Greenbelt, Maryland are the parties responsible for this incredible look back into time. It is one of the most detailed looks at an incredibly distant object to date and their results have been accepted for publication in The Astrophysical Journal, in a paper led by Keren Sharon of the Kavli Institute for Cosmological Physics at the University of Chicago. Professor Michael Gladders and graduate student Eva Wuyts of the University of Chicago were also key team members.
“The presence of the lens helps show how galaxies evolved from 10 billion years ago to today. While nearby galaxies are fully mature and are at the tail end of their star-formation histories, distant galaxies tell us about the universe’s formative years. The light from those early events is just now arriving at Earth.” says the team. “Very distant galaxies are not only faint but also appear small on the sky. Astronomers would like to see how star formation progressed deep within these galaxies. Such details would be beyond the reach of Hubble’s vision were it not for the magnification made possible by gravity in the intervening lens region.”
But the Hubble isn’t the only eye on the sky examining this phenomenon. A little over 10 years ago a team of astronomers using the Very Large Telescope in Chile also measured and examined the arc and reported the distant galaxy seems to be more than three times brighter than those previously discovered. However, there’s more to the picture than meets the eye. Original images show the magnified galaxy as hugely distorted and it shows itself more than once in the foreground lensing cluster. The challenge was to create a image that was “true to life” and thanks to Hubble’s resolution capabilities, the team was able to remove the distortions from the equation. In this image they found several incredibly bright star-forming regions and through the use of spectroscopy, they hope to better understand them.
Located on the Chajnantor plateau in the foothills of the Chilean Andes, ESO’s APEX telescope has been busy looking into deep, deep space. Recently a group of astronomers released their findings regarding massive galaxies in connection with extreme times of star formation in the early Universe. What they found was a sharp cut-off point in stellar creation, leaving “massive – but passive – galaxies” filled with mature stars. What could cause such a scenario? Try the materialization of a supermassive black hole…
By integrating data taken with the LABOCA camera on the ESO-operated 12-metre Atacama Pathfinder Experiment (APEX) telescope with measurements made with ESO’s Very Large Telescope, NASA’s Spitzer Space Telescope and other facilities, astronomers were able to observe the relationship of bright, distant galaxies where they form into clusters. They found that the density of the population plays a major role – the tighter the grouping, the more massive the dark matter halo. These findings are the considered the most accurate made so far for this galaxy type.
Located about 10 billion light years away, these submillimetre galaxies were once home to starburst events – a time of intense formation. By obtaining estimations of dark matter halos and combining that information with computer modeling, scientists are able to hypothesize how the halos expanding with time. Eventually these once active galaxies settled down to form giant ellipticals – the most massive type known.
“This is the first time that we’ve been able to show this clear link between the most energetic starbursting galaxies in the early Universe, and the most massive galaxies in the present day,” says team leader Ryan Hickox of Dartmouth College, USA and Durham University, UK.
However, that’s not all the new observations have uncovered. Right now there’s speculation the starburst activity may have only lasted around 100 million years. While this is a very short period of cosmological time, this massive galactic function was once capable of producing double the amount of stars. Why it should end so suddenly is a puzzle that astronomers are eager to understand.
“We know that massive elliptical galaxies stopped producing stars rather suddenly a long time ago, and are now passive. And scientists are wondering what could possibly be powerful enough to shut down an entire galaxy’s starburst,” says team member Julie Wardlow of the University of California at Irvine, USA and Durham University, UK.
Right now the team’s findings are offering up a new solution. Perhaps at one point in cosmic history, starburst galaxies may have clustered together similar to quasars… locating themselves in the same dark matter halos. As one of the most kinetic forces in our Universe, quasars release intense radiation which is reasoned to be fostered by central black holes. This new evidence suggests intense starburst activity also empowers the quasar by supplying copious amounts of material to the black hole. In response, the quasar then releases a surge of energy which could eradicate the galaxy’s leftover gases. Without this elemental fuel, stars can no longer form and the galaxy growth comes to a halt.
“In short, the galaxies’ glory days of intense star formation also doom them by feeding the giant black hole at their centre, which then rapidly blows away or destroys the star-forming clouds,” explains team member David Alexander from Durham University, UK.
Astronomers can’t see it but they know it’s out there from the distortions caused by its gravity. That statement describes dark matter, the elusive substance which scientists have estimated makes up about 25% of our universe and doesn’t emit or absorb light. But it also describes a distant, tiny galaxy located about 10 billion light years from Earth. This galaxy can’t be seen in telescopes, but astronomers were able to detect its presence through the small distortions made in light that passes by it. This dark galaxy is the most distant and lowest-mass object ever detected, and astronomers say it could help them find similar objects and confirm or reject current cosmological theories about the structure of the Universe.
“Now we have one dark satellite [galaxy],” said Simona Vegetti, a postdoctoral researcher at the Massachusetts Institute of Technology, who led the discovery. “But suppose that we don’t find enough of them — then we will have to change the properties of dark matter. Or, we might find as many satellites as we see in the simulations, and that will tell us that dark matter has the properties we think it has.”
This dwarf galaxy is a satellite of a distant elliptical galaxy, called JVAS B1938 + 666. The team was looking for faint or dark satellites of distant galaxies using gravitational lensing, and made their observations with the Keck II telescope on Mauna Kea in Hawaii, along with the telescope’s adaptive optics to limit the distortions from our own atmosphere.
They found two galaxies aligned with each other, as viewed from Earth, and the nearer object’s gravitational field deflected the light from the more distant object (JVAS B1938 + 666) as the light passed through the dark galaxy’s gravitational field, creating a distorted image called an “Einstein Ring.”
Using data from this effect, the mass of the dark galaxy was found to be 200 million times the mass of the Sun, which is similar to the masses of the satellite galaxies found around our own Milky Way. The size, shape and brightness of the Einstein ring depends on the distribution of mass throughout the foreground lensing galaxy.
Current models suggest that the Milky Way should have about 10,000 satellite galaxies, but only 30 have been observed. “It could be that many of the satellite galaxies are made of dark matter, making them elusive to detect, or there may be a problem with the way we think galaxies form,” Vegetti said.
The dwarf galaxy is a satellite, meaning that it clings to the edges of a larger galaxy. Because it is small and most of the mass of galaxies is not made up of stars but of dark matter, distant objects such as this galaxy may be very faint or even completely dark.
“For several reasons, it didn’t manage to form many or any stars, and therefore it stayed dark,” said Vegetti.
Vegetti and her team plan to use the same method to look for more satellite galaxies in other regions of the Universe, which they hope will help them discover more information on how dark matter behaves.
Their research was published in this week’s edition of Nature.
“Sgr A* is the right object, VLBI is the right technique, and this decade is the right time.”
So states the mission page of the Event Horizon Telescope, an international endeavor that will combine the capabilities of over 50 radio telescopes across the globe to create a single Earth-sized telescope to image the enormous black hole at the center of our galaxy. For the first time, astronomers will “see” one of the most enigmatic objects in the Universe.
And tomorrow, January 18, researchers from around the world will convene in Tucson, AZ to discuss how to make this long-standing astronomical dream a reality.
During a conference organized by Dimitrios Psaltis, associate professor of astrophysics at the University of Arizona’s Steward Observatory, and Dan Marrone, an assistant professor of astronomy at the Steward Observatory, astrophysicists, scientists and researchers will gather to coordinate the ultimate goal of the Event Horizon Telescope; that is, an image of Sgr A*’s accretion disk and the “shadow” of its event horizon.
“Nobody has ever taken a picture of a black hole. We are going to do just that.”
– Dimitrios Psaltis, associate professor of astrophysics at the University of Arizona’s Steward Observatory
Sgr A* (pronounced as “Sagittarius A-star”) is a supermassive black hole residing at the center of the Milky Way. It is estimated to contain the equivalent mass of 4 million Suns, packed into an area smaller than the diameter of Mercury’s orbit.
Because of its proximity and estimated mass, Sgr A* presents the largest apparent event horizon size of any black hole candidate in the Universe. Still, its size in the sky is about the same as viewing “a grapefruit on the Moon.”
So what are astronomers expecting to actually “see”?
(Read more: What does a black hole look like?)
Because black holes by definition are black – that is, invisible in all wavelengths of radiation due to the incredibly powerful gravitational effect on space-time around them – an image of the black hole itself will be impossible. But Sgr A*’s accretion disk should be visible to radio telescopes due to its billion-degree temperatures and powerful radio (as well as submillimeter, near infrared and X-ray) emissions… especially in the area leading up to and just at its event horizon. By imaging the glow of this super-hot disk astronomers hope to define Sgr A*’s Schwarzschild radius – its gravitational “point of no return”.
This is also commonly referred to as its shadow.
The position and existence of Sgr A* has been predicted by physics and inferred by the motions of stars around the galactic nucleus. And just last month a giant gas cloud was identified by researchers with the European Southern Observatory, traveling directly toward Sgr A*’s accretion disk. But, if the EHT project is successful, it will be the first time a black hole will be directly imaged in any shape or form.
“So far, we have indirect evidence that there is a black hole at the center of the Milky Way,” said Dimitrios Psaltis. “But once we see its shadow, there will be no doubt.”
The ambitious Event Horizon Telescope project will use not just one telescope but rather a combination of over 50 radio telescopes around the world, including the Submillimeter Telescope on Mt. Graham in Arizona, telescopes on Mauna Kea in Hawaii and the Combined Array for Research in Millimeter-wave Astronomy in California, as well as several radio telescopes in Europe, a 10-meter dish at the South Pole and, if all goes well, the 50-radio-antenna capabilities of the new Atacama Large Millimeter Array in Chile. This coordinated group effort will, in effect, turn our entire planet into one enormous dish for collecting radio emissions.
By using long-term observations with Very Long Baseline Interferometry (VLBI) at short (230-450 GHz) wavelengths, the EHT team predicts that the goal of imaging a black hole will be achieved within the next decade.
“What is great about the one in the center of the Milky Way is that is big enough and close enough,” said assistant professor Dan Marrone. “There are bigger ones in other galaxies, and there are closer ones, but they’re smaller. Ours is just the right combination of size and distance.”
[/caption]Like a worldly backpacker, many stars in the Milky Way Galaxy have made interesting journeys, and have interesting stories to tell about their past. For over a decade, the Sloan Digital Sky Survey (SDSS) has been mapping stars in our Galaxy.
This week at the American Astronomical Society meeting in Austin, Texas, astronomers from University of California – Santa Cruz presented new evidence that claims to answer many questions about stars located in the disk of our galaxy. The team’s results are based on data from the Sloan Extension for Galactic Understanding and Exploration 2 (SEGUE-2).
The SEGUE-2 data is comprised of the motions and chemical compositions of over 118,000 stars, most of which are in the disk of our galaxy, but a few stars in the survey take the “scenic” route in their orbit.
“Some disk stars have orbits that take them far above and below the plane of the Milky Way,” said Connie Rockosi (University of California – Santa Cruz), “We want to understand what kinds of stars those are, where they came from, and how they got there.”
Aside from the orbital paths of these “wandering” stars being different from most other Milky Way stars, their chemical composition also makes them unique. A team led by Judy Cheng (University of California – Santa Cruz) studied the metallicity of stars at different locations in the galaxy. By studying the metallicity, Cheng and her team were able to examine how the disk of the Milky Way disk grew over time. Cheng’s study also showed that stars closer to the center of the galaxy have higher metallicity than those farther from the galactic center. “That tells us that the outer disk of our Galaxy has formed fewer generations of stars than the inner disk, meaning that the Milky Way disk grew from the inside out,” added Cheng.
When Cheng studied the “wandering” stars, she found their metallicity doesn’t follow the same trend – no matter where she looked in the target area of the Galaxy, stars had low metal content. “The fact that the metal content of those stars is the same everywhere is a new piece of evidence that can help us figure out how they got to be so far away from the plane,” Rockosi mentioned.
What the team has yet to determine is if the stars formed with their “wandering” orbits, or if something in the past caused them to migrate to their unique paths. “If these stars were born with these orbits, they were born at the same rate all over the galaxy,” Cheng said. “If they were born with regular orbits, then whatever happened to them must have been very efficient at mixing them up and erasing any patterns in the metal content, such as the inside-out trend we see in the plane.”
Some possible reasons for this mixing include past mergers of our Galaxy and others, or possibly spiral arms sweeping through the disk. Cheng’s observations will help determine what causes stars to wander far from their birthplace. Other galaxies have shown stars in their disks as well, so solving the puzzle presented by these stars will help researchers better understand how spiral galaxies like the Milky Way form.
If you’d like to read Cheng and Rockosi’s paper “Metallicity Gradients In The Milky Way Disk As Observed By The SEGUE Survey”, you can download a copy at: http://www.ucolick.org/~jyc/gradient/cheng_apj_fullres.pdf
What color would the Milky Way appear to alien civilizations looking at our galaxy through their telescopes? It turns out the Milky Way has approximately the right name – but for all the wrong reasons. “The true color of the Milky Way is as white as fine-grained new spring snow seen in early morning light,” said Dr. Jeffrey Newman, from the University of Pittsburgh, speaking at a press conference from the American Astronomical Society (AAS) Meeting.
Our ancestors gave our galaxy the name “Milky Way” because when they looked up and saw the band of the stars that stretches from one horizon to the other, it appears white to our human eyes. “But that’s only because our low-light vision isn’t sensitive to color,” said Newman. “There are portions of the Milky Way that are more yellow or red versus more blue, but our eyes can’t pick that up. But a sensitive instrument or photograph can.”
When we look at other galaxies, we can see them in their entirety, and can examine them for color and luminosity. Color and luminosity have been great tool for astronomy, helping us to understand stars and galaxies.
“Unfortunately we can’t get a complete picture of the Milky Way from outside, so we have had to resort to other methods,” said Newman. “Not only are we looking at Milky Way from the inside, but it’s even worse than that — our view is blocked by dust, both in clouds and diffuse dust. We can only see about 1,000 -2,000 light years in any direction, even though our galaxy is a 100,000 light years across.”
So if you ask, ‘what is the integrated color of the Milky Way,’ we can can’t tell from a picture like the one above, we can only tell what color the local neighborhood is.
“We have had to resort to different techniques, and rather than looking at the Milky Way directly, we look at other galaxies that should be like the Milky Way and we can determine what their color and luminosity are,” Newman said.
Newman, along with Timothy Licquia, a PhD student in physics at Pitt, used images from the Sloan Digital Sky Survey — which contains detailed properties of nearly a million galaxies — and looked for galaxies with similar properties to the Milky Way in regards to total mass and star formation rates. The Milky Way Galaxy should then fall on a plot somewhere within the range of colors of these matching objects.
While the composite color of the Milky Way is snowy-white, our galaxy appears more yellow towards the center and more blue out in the spiral arms.
Newman and Licquia determined the light color temperature of the Milky Way is 4,840 K, which closely matches the light from a standard light bulb with a color temperature of 4,700-5,000K. “It is well within the range our eye can perceive as white—roughly halfway between the light from old-style incandescent light bulbs and the standard spectrum of white on a television,” said Newman. “Our eyes treat both as white.”
The color of new snow is the whitest natural color on Earth. While milk has a more bluish color than snow, the association of our Milky Way to milk has proven to be very appropriate, given the Milky Way’s true color.
Newman even wrote a Haiku about the color:
Look at new spring snow
See the River of Heaven
An hour after dawn
The Milky Way’s color could be on either side of a standard dividing line between red and blue galaxies: relatively red galaxies rarely form new stars and blue galaxies have stars still being born. This adds to the evidence that although the Milky Way is still producing stars, it is “on its way out,” according to Newman. “A few billion years from now, our Galaxy will be a much more boring place, full of middle-aged stars slowly using up their fuel and dying off, but without any new ones to take their place. It will be less interesting for astronomers in other galaxies to look at, too: The Milky Way’s spiral arms will fade into obscurity when there are no more blue stars left.”