Hail to His Spiralness, M83

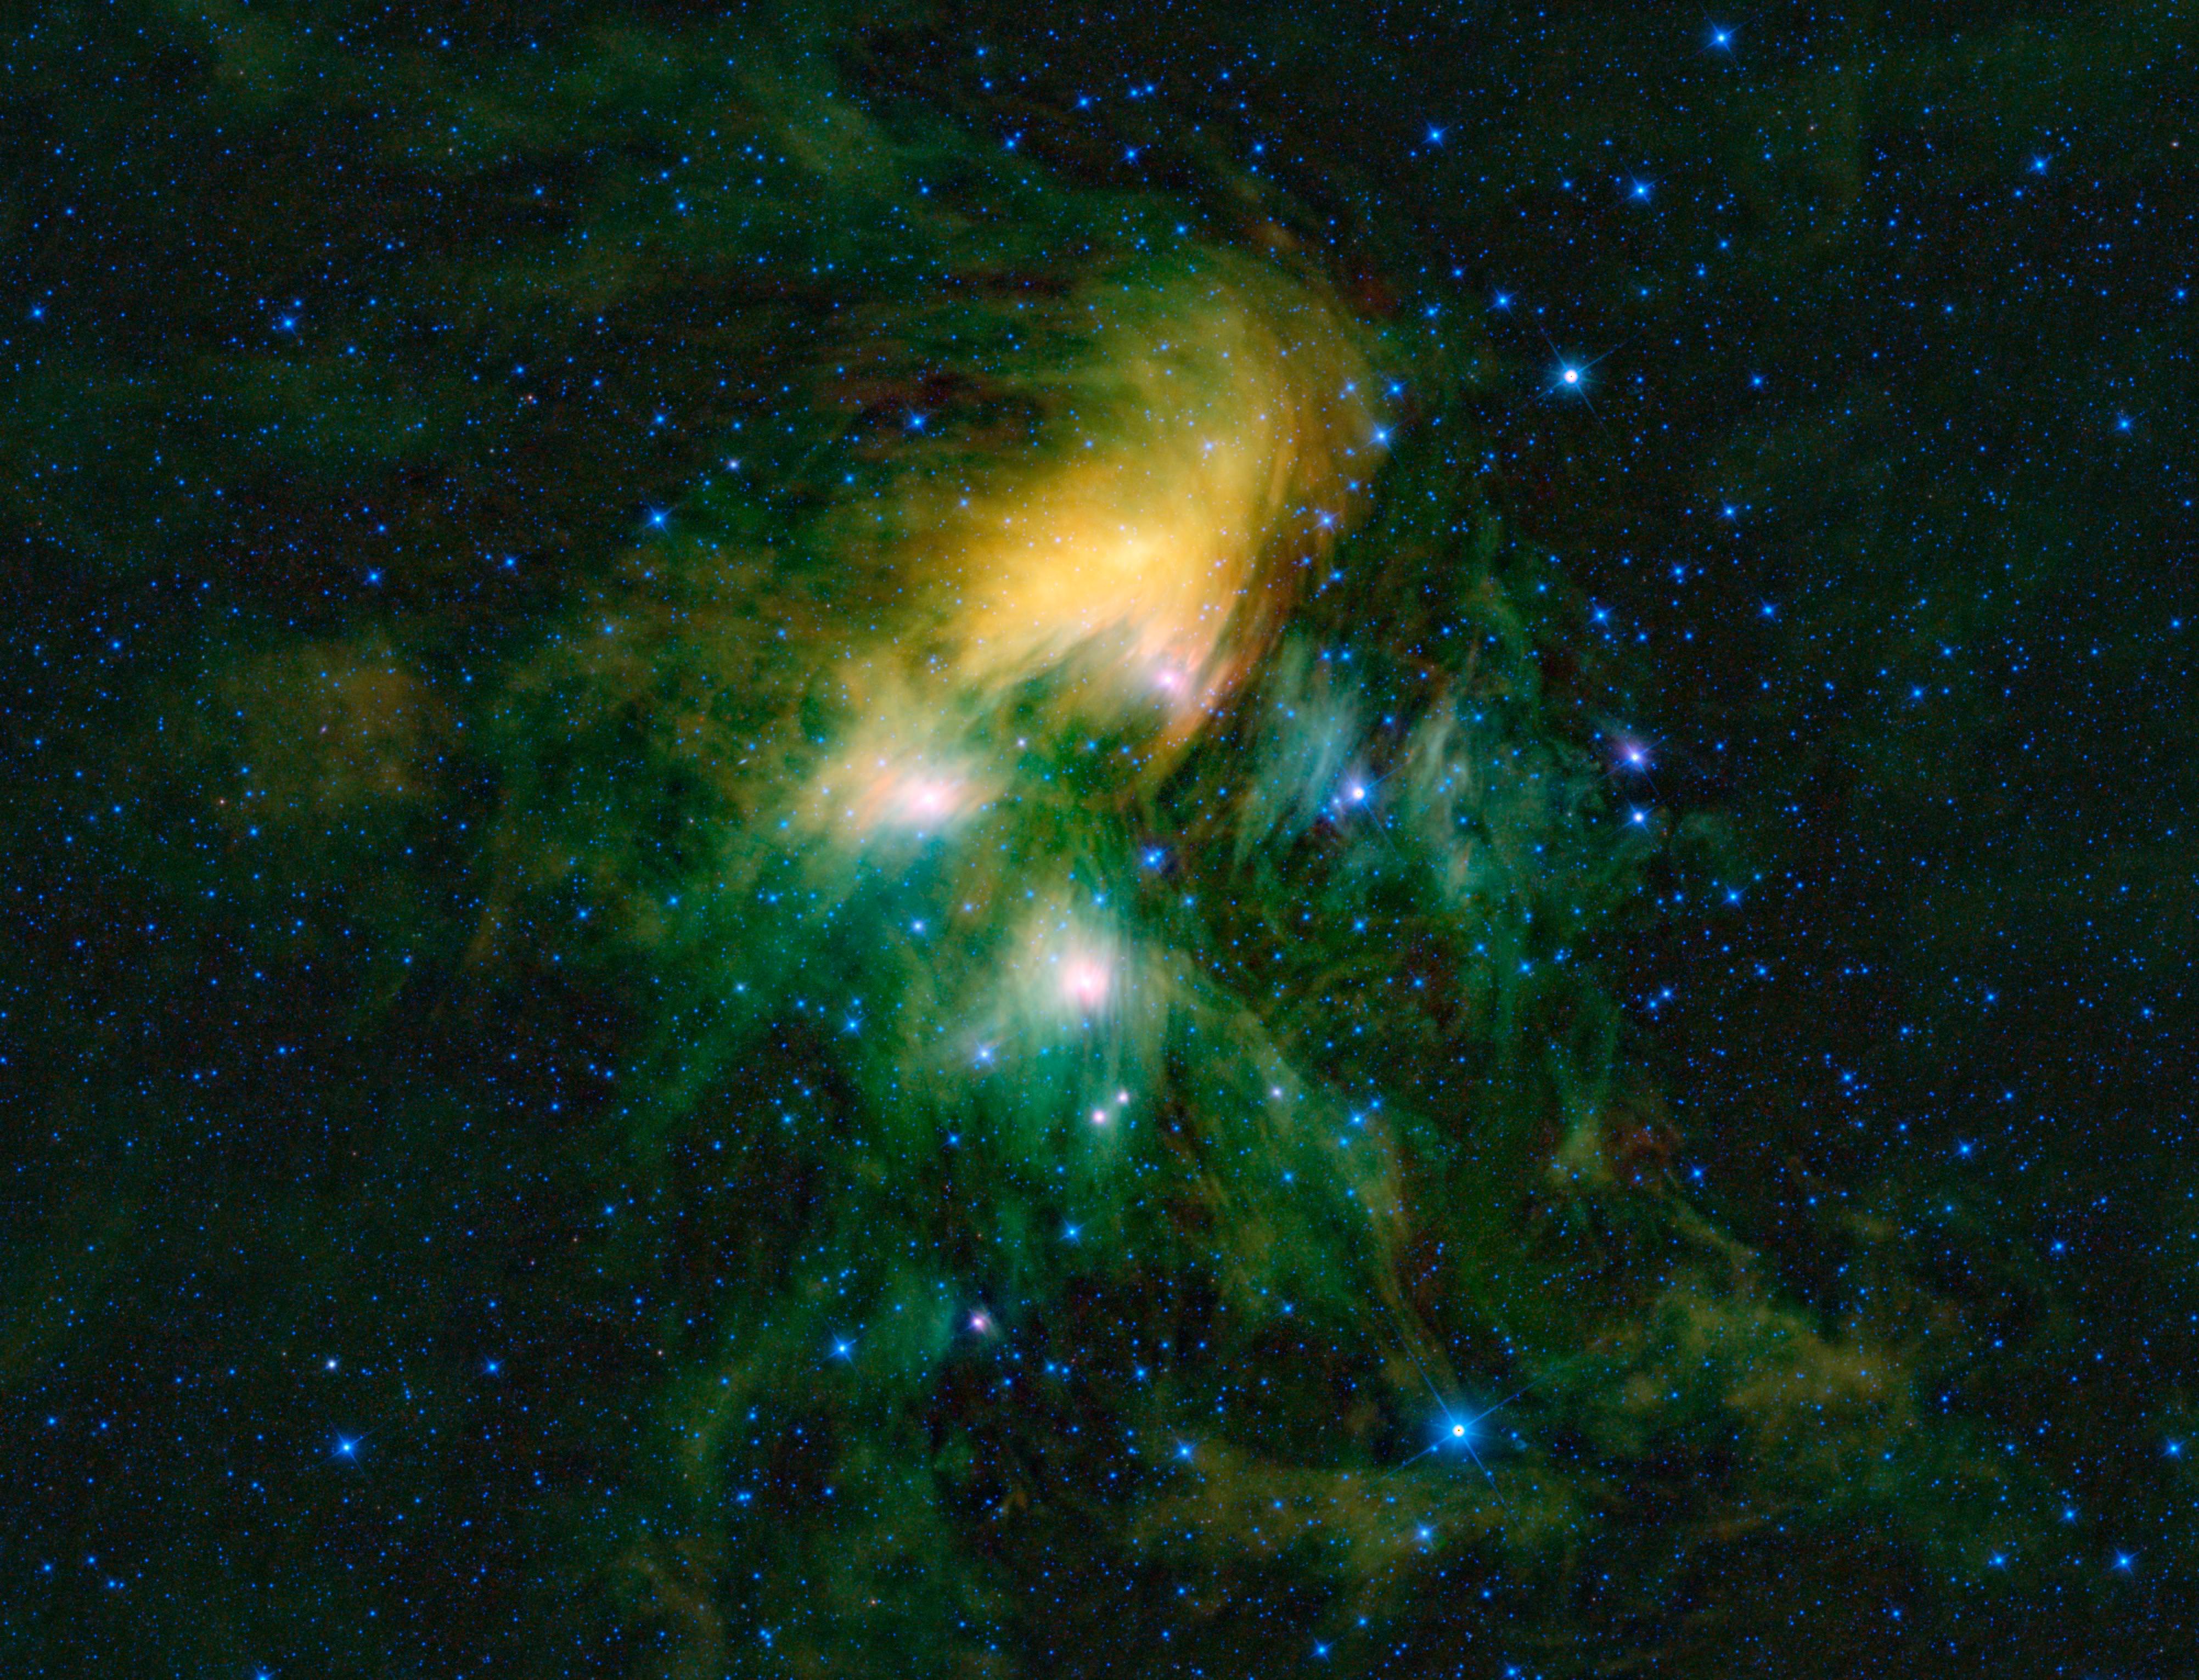
M83. Credit: ESO/M. Gieles. Acknowledgement: Mischa Schirmer

[/caption]

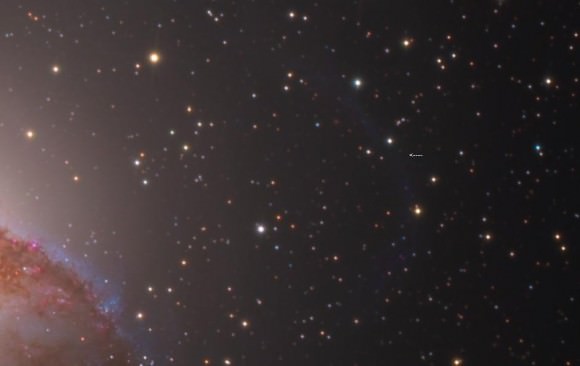
ESO released a beautiful image today of M83, a classic spiral galaxy. The image was taken by the HAWK-I instrument on ESO’s Very Large Telescope (VLT) at the Paranal Observatory in Chile. The picture shows the galaxy in infrared light and the combination of the huge mirror of the VLT, the large field of view and great sensitivity of the HAWK –I and the superb observing conditions at ESO’s Paranal Observatory makes this one of the sharpest and most detailed pictures of Messier 83 ever taken from the ground. M83 is perhaps a mirror to how our own Milky Way galaxy looks, could we step outside and take a look.

Messier 83 is located about 15 million light-years away in the constellation of Hydra. It is famous for its many supernovae: over the last century, six supernovae have been observed in Messier 83 — a record number that is matched by only one other galaxy. Even without supernovae, Messier 83 is one of the brightest nearby galaxies, visible using just binoculars.

Check out this article by our resident astronomer Tammy Plotner to find out how you can spot M83 in the night sky.

Source: ESO

Team Finds Most-Distant Galaxy Cluster Ever Seen

SXDF-XCLJ0218-0510. Max-Planck-Institut für extraterrestrische Physik

[/caption]

Like a location from Star Wars, this galaxy cluster is far, far away and with origins a long, long time ago. With the ungainly name of SXDF-XCLJ0218-0510, this cluster is actually the most distant cluster of galaxies ever seen. It is a whopping 9.6 billion light years away, and X-ray and infrared observations show that the cluster hosts predominantly old, massive galaxies. This means the galaxies formed when the universe was still very young, so finding this cluster and being able to see it is providing new information not only about early galaxy evolution but also about history of the universe as a whole.

An international team of astronomers from the Max Planck Institute for Extraterrestrial Physics, the University of Tokyo and the Kyoto University discovered this cluster using the Subaru telescope along with the XMM-Newton space observatory to look in different wavelengths.

Using the Multi-Object Infrared Camera and Spectrometer (MOIRCS) on the Subaru telescope, the team was able to look in near-infrared wavelengths, where the galaxies are most luminous.

“The MOIRCS instrument has an extremely powerful capability of measuring distances to galaxies. This is what made our challenging observation possible,” said Masayuki Tanaka from the University of Tokyo. “Although we confirmed only several massive galaxies at that distance, there is convincing evidence that the cluster is a real, gravitationally bound cluster.”

Like a contour map, the arrows in the image above indicate galaxies that are likely located at the same distance, clustered around the center of the image. The contours indicate the X-ray emission of the cluster. Galaxies with confirmed distance measurements of 9.6 billion light years are circled. The combination of the X-ray detection and the collection of massive galaxies unequivocally proves a real, gravitationally bound cluster.

That the individual galaxies are indeed held together by gravity is confirmed by observations in a very different wavelength regime: The matter between the galaxies in clusters is heated to extreme temperatures and emits light at much shorter wavelengths than visible to the human eye. The team therefore used the XMM-Newton space observatory to look for this radiation in X-rays.

“Despite the difficulties in collecting X-ray photons with a small effective telescope size similar to the size of a backyard telescope, we detected a clear signature of hot gas in the cluster,” said Alexis Finoguenov from the Max Planck Institute for Extraterrestrial Physics.

The combination of these different observations in what are invisible wavelengths to the human eye led to the pioneering discovery of the galaxy cluster at a distance of 9.6 billion light years – some 400 million light years further into the past than the previously most distant cluster known.

An analysis of the data collected about the individual galaxies shows that the cluster contains already an abundance of evolved, massive galaxies that formed some two billion years earlier. As the dynamical processes for galaxy aging are slow, presence of these galaxies requires the cluster assembly through merger of massive galaxy groups, each nourishing its dominant galaxy. The cluster is therefore an ideal laboratory for studying the evolution of galaxies, when the universe was only about a third of its present age.

As distant galaxy clusters are also important tracers of the large scale structure and primordial density fluctuations in the universe, similar observations in the future will lead to important information for cosmologists. The results obtained so far demonstrate that current near infrared facilities are capable of providing a detailed analysis of distant galaxy populations and that the combination with X-ray data is a powerful new tool. The team therefore is continuing the search for more distant clusters.

Source: Max Planck Institute for Extraterrestrial Physics

New Image Reveals Thousands of Galaxies in Abell 315

Galaxy Cluster Abell 315 as seen by ESO's 2.2 meter telescope at La Silla. Credit: ESO/J. Dietrich

[/caption]

In an image akin to the Hubble Deep Field, ESO’s La Silla Observatory in Chile stared at a patch of sky about as big as a full Moon and observed thousands of distant galaxies. The Wide Field Imager on ESO’s 2.2 meter telescope zeroed in on a large group of galaxies that are part of the massive galaxy cluster known as Abell 315. But there’s more in this image—including relatively close asteroids that show up as blue, green or red trails, which lie in the main asteroid belt, located between the orbits of Mars and Jupiter. Also, invisible dark matter is revealed in this image through its gravitational effects, noticeably visible on this galaxy cluster.

Of course, not all the galaxies seen here are the same distance from us. Some are relatively close, as it is possible to distinguish their spiral arms or elliptical halos if you zoom in on this larger image, especially in the upper part of the image. The more distant galaxies appear just like faint of blobs — their light has traveled through the Universe for eight billion years or more before reaching Earth.

The concentration of about a hundred yellowish galaxies is the Abell 315 galaxy cluster. The cluster is located in the constellation of Cetus (the Whale).

The galaxies in these clusters contribute to only ten percent of the mass, with hot gas in between galaxies accounting for another ten percent. The remaining 80 percent is made of dark matter that lies in between the galaxies.

We know the dark matter is there because of its effects: the enormous mass of a galaxy cluster acts on the light from galaxies behind the cluster like a cosmic magnifying glass, bending the trajectory of the light and thus making the galaxies appear slightly distorted. By observing and analyzing the twisted shapes of these background galaxies, astronomers can infer the total mass of the cluster responsible for the distortion, even when this mass is mostly invisible. However, this effect is usually tiny, and it is necessary to measure it over a huge number of galaxies to obtain significant results. In the case of Abell 315, the shapes of almost 10,000 faint galaxies in this image were studied in order to estimate the total mass of the cluster, which amounts to over a hundred thousand billion times the mass of our Sun.

For more information see the ESO release and additional images.

GOODS, Under Astronomers’ AEGIS, Produce GEMS

No, not really (but I got all three key words into the title in a way that sorta makes sense).

Astronomers, like most scientists, just love acronyms; unfortunately, like most acronyms, on their own the ones astronomers use make no sense to non-astronomers.

And sometimes not even when written in full:
GOODS = Great Observatories Origins Deep Survey; OK that’s vaguely comprehensible (but what ‘origins’ is it about?)
AEGIS = All-wavelength Extended Groth strip International Survey; hmm, what’s a ‘Groth’?
GEMS = Galaxy Evolution from Morphology and SEDs; is Morphology the study of Morpheus’ behavior? And did you guess that the ‘S’ stood for ‘SEDs’ (not ‘Survey’)?

But, given that these all involve a ginormous amount of the ‘telescope time’ of the world’s truly great observatories, to produce such visually stunning images as the one below (NOT!), why do astronomers do it?

GEMS tile#58 (MPIfA)


Astronomy has made tremendous progress in the last century, when it comes to understanding the nature of the universe in which we live.

As late as the 1920s there was still debate about the (mostly faint) fuzzy patches that seemed to be everywhere in the sky; were the spiral-shaped ones separate ‘island universes’, or just funny blobs of gas and dust like the Orion nebula (‘galaxy’ hadn’t been invented then)?

Today we have a powerful, coherent account of everything we see in the night sky, no matter whether we use x-ray eyes, night vision (infrared), or radio telescopes, an account that incorporates the two fundamental theories of modern physics, general relativity and quantum theory. We say that all the stars, emission and absorption nebulae, planets, galaxies, supermassive black holes (SMBHs), gas and plasma clouds, etc formed, directly or indirectly, from a nearly uniform, tenuous sea of hydrogen and helium gas about 13.4 billion years ago (well, maybe the SMBHs didn’t). This is the ‘concordance LCDM cosmological model’, known popularly as ‘the Big Bang Theory’.

But how? How did the first stars form? How did they come together to form galaxies? Why did some galaxies’ nuclei ‘light up’ to form quasars (and others didn’t)? How did the galaxies come to have the shapes we see? … and a thousand other questions, questions which astronomers hope to answer, with projects like GOODS, AEGIS, and GEMS.

The basic idea is simple: pick a random, representative patch of sky and stare at it, for a very, very long time. And do so with every kind of eye you have (but most especially the very sharp ones).

By staring across as much of the electromagnetic spectrum as possible, you can make a chart (or graph) of the amount of energy is coming to us from each part of that spectrum, for each of the separate objects you see; this is called the spectral energy distribution, or SED for short.

By breaking the light of each object into its rainbow of colors – taking a spectrum, using a spectrograph – you can find the tell-tale lines of various elements (and from this work out a great deal about the physical conditions of the material which emitted, or absorbed, the light); “light” here is shorthand for electromagnetic radiation, though mostly ultraviolet, visible light (which astronomers call ‘optical’), and infrared (near, mid, and far).

By taking really, really sharp images of the objects you can classify, categorize, and count them by their shape, morphology in astronomer-speak.

And because the Hubble relationship gives you an object’s distance once you know its redshift, and as distance = time, sorting everything by redshift gives you a picture of how things have changed over time, ‘evolution’ as astronomers say (not to be confused with the evolution Darwin made famous, which is a very different thing).

GOODS

The great observatories are Chandra, XMM-Newton, Hubble, Spitzer, and Herschel (space-based), ESO-VLT (European Southern Observatory Very Large Telescope), Keck, Gemini, Subaru, APEX (Atacama Pathfinder Experiment), JCMT (James Clerk Maxwell Telescope), and the VLA. Some of the observing commitments are impressive, for example over 2 million seconds using the ISAAC instrument (doubly impressive considering that ground-based facilities, unlike space-based ones, can only observe the sky at night, and only when there is no Moon).

There are two GOODS fields, called GOODS-North and GOODS-South. Each is a mere 150 square arcminutes in size, which is tiny, tiny, tiny (you need five fields this size to completely cover the Moon)! Of course, some of the observations extend beyond the two core 150 square arcminutes fields, but every observatory covered every square arcsecond of either field (or, for space-based observatories, both).

GOODS-N ACS fields (GOODS/STScI)

GOODS-N is centered on the Hubble Deep Field (North is understood; this is the first HDF), at 12h 36m 49.4000s +62d 12′ 58.000″ J2000.
GOODS-S ACS fields (GOODS/STScI)

GOODS-S is centered on the Chandra Deep Field-South (CDFS), at 3h 32m 28.0s -27d 48′ 30″ J2000.

The Hubble observations were taken using the ACS (Advanced Camera for Surveys), in four wavebands (bandpasses, filters), which are approximately the astronomers’ B, V, i, and z.

Extended Groth Strip fields (AEGIS)

AEGIS

The ‘Groth’ refers to Edward J. Groth who is currently at the Physics Department of Princeton University. In 1995 he presented a ‘poster paper’ at the 185th meeting of the American Astronomical Society entitled “A Survey with the HST“. The Groth strip is the 28 pointings of the Hubble’s WFPC2 camera in 1994, centered on 14h 17m +52d 30′. The Extended Groth Strip (EGS) is considerably bigger than the GOODS fields, combined. The observatories which have covered the EGS include Chandra, GALEX, the Hubble (both NICMOS and ACS, in addition to WFPC2), CFHT, MMT, Subaru, Palomar, Spitzer, JCMT, and the VLA. The total area covered is 0.5 to 1 square degree, though the Hubble observations cover only ~0.2 square degrees (and only 0.0128 for the NICMOS ones). Only two filters were used for the ACS observations (approximately V and I).

I guess you, dear reader, can work out why this is called an ‘All wavelength’ and ‘International Survey’, can’t you?

GEMS' ACS fields (MPIfA)

GEMS

GEMS is centered on the CDFS (Chandra Deep Field-South, remember?), but covers a much bigger area than GOODS-S, 900 square arcminutes (the largest contiguous field so far imaged by the Hubble at the time, circa 2004; the COSMOS field is certainly larger, but most of it is monochromatic – I band only – so the GEMS field is the largest contiguous color one, to date). It is a mosaic of 81 ACS pointings, using two filters (approximately V and z).

Its SEDs component comes largely from the results of a previous large project covering the same area, called COMBO-17 (Classifying Objects by Medium-Band Observations – a spectrophotometric 17-band survey).

Sources: GOODS (STScI), GOODS (ESO), AEGIS, GEMS, ADS
Special thanks to reader nedwright for catching the error re GEMS (and thanks to to readers who have emailed me with your comments and suggestions; much appreciated)

Click on Hubble: Galaxy Zoo Now Includes HST Images

The Hubble Space Telescope is 20 years old on Saturday and, to mark this anniversary, all the world’s space and astronomy fans have a chance to become part of the Hubble team.

As part of the birthday celebrations NASA’s Space Telescope Science Institute and the online astronomy project Galaxy Zoo are making some 200,000 Hubble images of galaxies available to the public at Galaxy Zoo (www.galaxyzoo.org). They hope that volunteers looking for their own favorite galaxies will join forces to give the venerable telescope a present – classifications of each galaxy which will help astronomers understand how the Universe we see around us formed.

But there’s more to it than that; remember Hanny and the Voorwerp? The Green Peas? Mitch’s mysterious star? For every unexpected Galaxy Zoo discovery there are likely a dozen Hubble Zoo ones.

“The large surveys that Hubble has completed allow us to trace the Universe’s evolution better than ever before,” said University of Nottingham astronomer and Galaxy Zoo team member Dr. Steven Bamford. “The vast majority of these galaxies will never have been viewed by anyone, and yet we need human intuition to make the most of what they are telling us”.

More than 250,000 people have already contributed to Galaxy Zoo since its launch in 2007, but so far they have been looking only at the ‘local’ Universe, up to a hundred million or so light-years away. The galaxies in HubbleZoo are from some of the big surveys, such as GOODS, and the images were processed by the Galaxy Zoo team alongside Roger Griffith at JPL and the Space Telescope Science Institute (see this article, from my Universe Today series on the Hubble, for more details on GOODS).

“Hubble will enable us to look back in time, to the era when many of the galaxies we see today were forming,” said Dr. Chris Lintott of Oxford University, Galaxy Zoo principal investigator. “As a kid I always wanted a time machine for my birthday, but this is the next best thing!”

“We never dreamt that people would find so many fascinating objects in the original Galaxy Zoo,” said Yale University astronomer Dr. Kevin Schawinski. “Who knows what’s hiding in the Hubble images?” Lintott added: “As we recovered from the launch of the original Galaxy Zoo, we knew we’d want to have a look at Hubble. Now we realize the images are better and the galaxies weirder than we ever thought they would be.”

And how will you, dear zooite-to-be, contribute, and find a hidden gem among the Hubble galaxies? Once you log in, you will asked to answer simple questions about what you are seeing, for example, identifying the number of spiral arms visible, or spotting galaxies in the process of merging. And if you spot something odd, you can bring it to the attention of other zooites, and the Zoo astronomers.

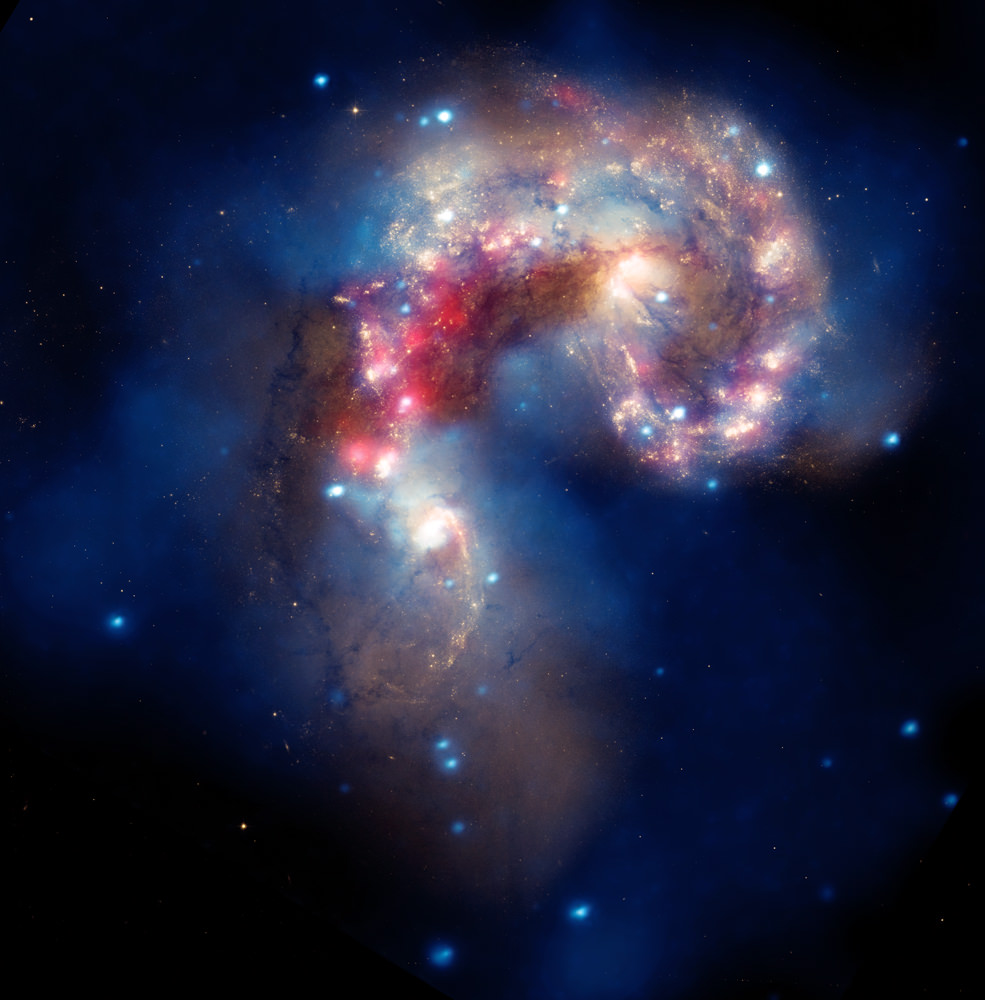
Arp147 (Credit: NASA, ESA, and M. Livio (STScI))

“Every galaxy is special in its own way,” said Stuart Lynn of Oxford University, Galaxy Zoo team member, “but some are worthy of individual attention. Anyone combing through the data using our site could make a spectacular discovery, and that would be the best birthday present of all.”

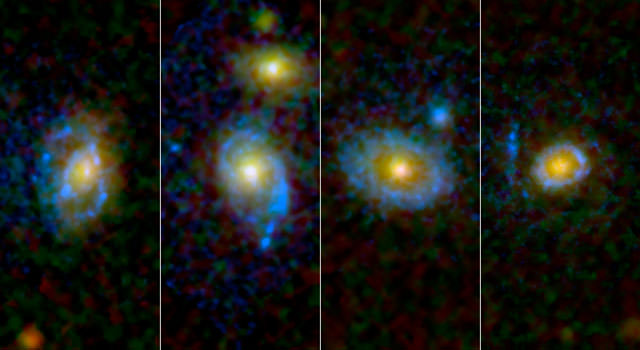
Galaxy SDSS J100213.52+020645.9 (SDSS)

Galaxy SDSS J100213.52+020645.9 (Hubble)

Sources: NASA, HubbleSite, Oxford University, Galaxy Zoo Forum The two images above, of a galaxy called SDSS J100213.52+020645.9, highlight the sharpness and depth of the Hubble’s images (the SDSS telescope and the Hubble have primary mirrors of approximately the same diameter).

Hubble Captures Distorted Beauty of M66

M 66. Image credit: NASA, ESA and the Hubble Heritage (STScI/AURA)-ESA/Hubble Collaboration. Acknowledgement: Davide De Martin and Robert Gendler

[/caption]
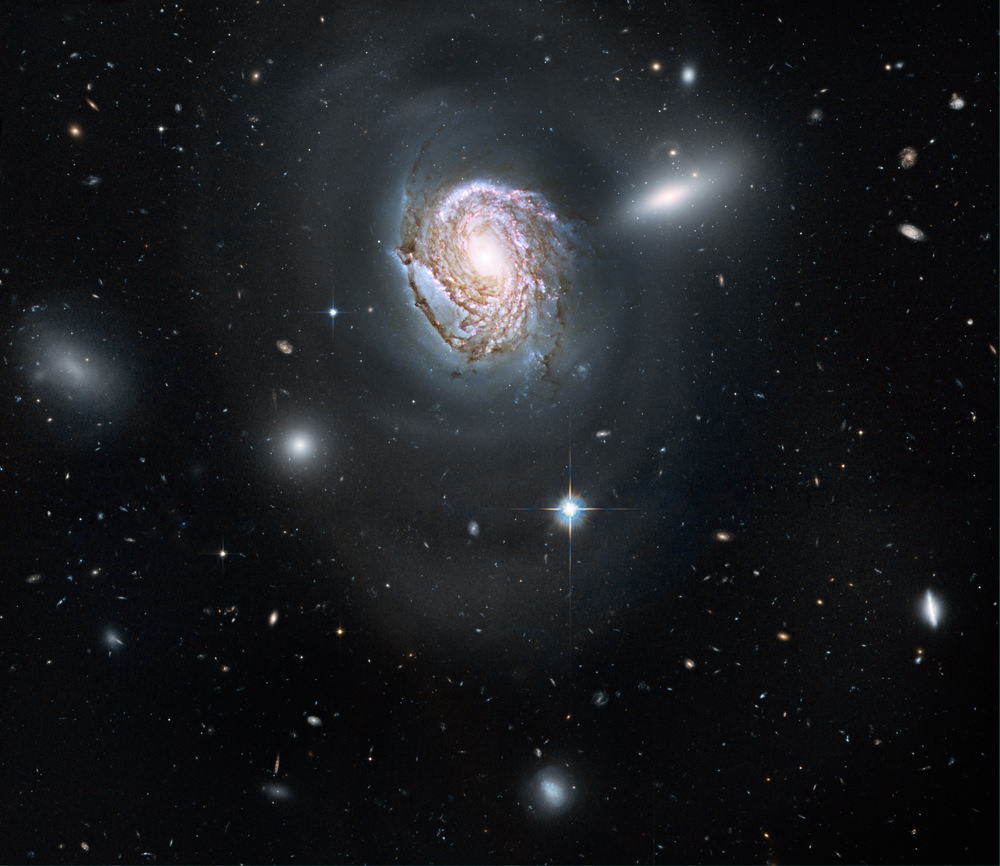
This isn’t your basic spiral galaxy, but perhaps it used to be! Hubble’s Advanced Camera for Surveys has captured this beautiful view of the biggest child of the Leo Triplet, M66. Its asymmetric spiral arms and an apparently displaced core was mostly likely caused by the gravitational pull of the other two members of the trio. Talk about sibling rivalry!

M66, is located at a distance of about 35 million light-years in the constellation of Leo. Together with Messier 65 and NGC 3628, Messier 66 is one third of the Leo Triplet, a trio of interacting spiral galaxies, part of the larger Messier 66 group. While M66 is the biggest — it is about 100,000 light-years across — the gravitational influence from the two neighboring galaxies have distorted the one orderly spiral arms, making them appear to rise above the central core.

The striking dust lanes and bright star clusters along the spiral arm — pictured in the blue and pinkish regions of the image — are key tools for astronomers since they are used as indicators of how the parent galaxies assembled over time.

Messier 66 boasts a remarkable record of supernovae explosions. The spiral galaxy has hosted three supernovae since 1989, the latest one occurring in 2009. A supernova is a stellar explosion that may momentarily outshine its entire host galaxy. It then fades away over a period lasting several weeks or months. During its very short life the supernova radiates as much energy as the Sun would radiate over a period of about 10 billion years.

Source: European Hubble Space Telescope webpage

Stunning Science Using Nature’s Telescope

3Star-birth in SMM J2135-0102 (Credit: M. Swinbank et al./Nature, ESO, APEX; NASA, ESA, SMA)

[/caption]
Einstein started it all, back in 1915.

Eddington picked up the ball and ran with it, in 1919.

And in the last decade or so astronomers have used a MACHO to OLGE CASTLES … yes, I’m talking about gravitational lensing.

Now LABOCA and SABOCA are getting into the act, using Einstein’s theory of general relativity to cast a beady eye upon star birth most fecund, in a galaxy far, far away (and long, long ago).

APEX at Chajnantor (Andreas Lundgren)

How galaxies evolved is one of the most perplexing, challenging, and fascinating topics in astrophysics today. And among the central questions – as yet unanswered – are how quickly stars formed in galaxies far, far away (and so long, long ago), and how such star formation differed from that which we can study, up close and personal, in our own galaxy (and our neighbors). There are lots of clues to suggest that star formation happened very much faster long ago, but because far-away galaxies are both dim and small, and because Nature drapes veils of opaque dust over star birth, there’s not much hard data to put the numerous hypotheses to the test.

Until last year that is.

“One of the brightest sub-mm galaxies discovered so far,” say a multi-national, multi-institution team of astronomers, was “first identified with the LABOCA instrument on APEX in May 2009” (you’d think they’d give it a name like, I don’t know, “LABOCA’s Stunner” or “APEX 1”, but no, dubbed “the Cosmic Eyelash”; formally it’s called SMMJ2135-0102). “This galaxy lies at [a redshift of] 2.32 and its brightness of 106 mJy at 870 μm is due to the gravitational magnification caused by a massive intervening galaxy cluster,” and “high resolution follow-up with the sub-mm array resolves the star-forming regions on scales of just 100 parsecs. These results allow study of galaxy formation and evolution at a level of detail never before possible and provide a glimpse of the exciting possibilities for future studies of galaxies at these early times, particularly with ALMA.” Nature’s telescope giving astronomers ALMA-like abilities, for free.

OK, so what did Mark Swinbank and his colleagues find? “The star-forming regions within SMMJ2135-0102 are ~100 parsecs across, which is 100 times larger than dense giant molecular cloud (GMC) cores, but their luminosities are approximately 100 times higher than expected for typical star-forming regions. Indeed, the luminosity densities of the star-forming regions within SMMJ2135-0102 are comparable to dense GMC cores, but with luminosities ten million times larger. Thus, it is likely that each of the star-forming regions in SMMJ2135-0102 comprises ~ten million dense GMC cores.” That’s pretty mind-blowing; imagine the Orion Nebula (M42, approximately 400 parsecs distant) as one of these star-forming regions!

James Dunlop of the University of Edinburgh suggests that such galaxies as SMMJ2135-0102 formed stars so abundantly because the galaxies still had plenty of gas – the raw material for making stars – and the gravity of the galaxies had had enough time to pull the gas together into cold, compact regions. Before about 10 billion years ago, gravity hadn’t yet drawn enough clumps of gas together, while at later times most galaxies had already run out of gas, he suggests.

But I’m saving the best for last: “the energetics of the star-forming regions within SMMJ2135-0102 are unlike anything found in the present day Universe,” Swinbank et al. write (now there’s an understatement if ever I’ve heard one!), “yet the relations between size and luminosity are similar to local, dense GMC cores, suggesting that the underlying physics of the star-forming processes is similar. Overall, these results suggest that the recipes developed to understand star-forming processes in the Milky Way and local galaxies can be used to model the star formation processes in these high-redshift galaxies.” It’s always good to get confirmation that our understanding of the physics at work so long ago is consistent and sound.

Einstein would have been delighted, and Eddington too.

Sources: “Intense star formation within resolved compact regions in a galaxy at z = 2.3” (Nature), “The Properties of Star-forming Regions within a Galaxy at Redshift 2” (ESO Messenger No. 139), Science News, SciTech, ESO. My thanks to debreuck (ESO’s Carlos De Breuck?) for setting the record straight re the name.

Andromeda’s Double Nucleus – Explained at Last?

M31's nucleus (Credit: WF/PC, Hubble Space Telescope)


In 1993, the Hubble Space Telescope snapped a close-up of the nucleus of the Andromeda galaxy, M31, and found that it is double.

In the 15+ years since, dozens of papers have been written about it, with titles like The stellar population of the decoupled nucleus in M 31, Accretion Processes in the Nucleus of M31, and The Origin of the Young Stars in the Nucleus of M31.

And now there’s a paper which seems, at last, to explain the observations; the cause is, apparently, a complex interplay of gravity, angular motion, and star formation.

[/caption]
It is now reasonably well-understood how supermassive black holes (SMBHs), found in the nuclei of all normal galaxies, can snack on stars, gas, and dust which comes within about a third of a light-year (magnetic fields do a great job of shedding the angular momentum of this ordinary, baryonic matter).

Also, disturbances from collisions with other galaxies and the gravitational interactions of matter within the galaxy can easily bring gas to distances of about 10 to 100 parsecs (30 to 300 light years) from a SMBH.

However, how does the SMBH snare baryonic matter that’s between a tenth of a parsec and ~10 parsecs away? Why doesn’t matter just form more-or-less stable orbits at these distances? After all, the local magnetic fields are too weak to make changes (except over very long timescales), and collisions and close encounters too rare (these certainly work over timescales of ~billions of years, as evidenced by the distributions of stars in globular clusters).

That’s where new simulations by Philip Hopkins and Eliot Quataert, both of the University of California, Berkeley, come into play. Their computer models show that at these intermediate distances, gas and stars form separate, lopsided disks that are off-center with respect to the black hole. The two disks are tilted with respect to one another, allowing the stars to exert a drag on the gas that slows its swirling motion and brings it closer to the black hole.

The new work is theoretical; however, Hopkins and Quataert note that several galaxies seem to have lopsided disks of elderly stars, lopsided with respect to the SMBH. And the best-studied of these is in M31.

Hopkins and Quataert now suggest that these old, off-center disks are the fossils of the stellar disks generated by their models. In their youth, such disks helped drive gas into black holes, they say.

The new study “is interesting in that it may explain such oddball [stellar disks] by a common mechanism which has larger implications, such as fueling supermassive black holes,” says Tod Lauer of the National Optical Astronomy Observatory in Tucson. “The fun part of their work,” he adds, is that it unifies “the very large-scale black hole energetics and fueling with the small scale.” Off-center stellar disks are difficult to observe because they lie relatively close to the brilliant fireworks generated by supermassive black holes. But searching for such disks could become a new strategy for hunting supermassive black holes in galaxies not known to house them, Hopkins says.

Sources: ScienceNews, “The Nuclear Stellar Disk in Andromeda: A Fossil from the Era of Black Hole Growth”, Hopkins, Quataert, to be published in MNRAS (arXiv preprint), AGN Fueling: Movies.

Magnetic Fields in Spiral Galaxies – Explained at Last?

M51 (Hubble) overlaid by 6cm radio intensity contours and polarization vectors (Effelsberg and VLA) Credit: MPIfR Bonn

[/caption]
That spiral galaxies have magnetic fields has been known for well over half a century (and predictions that they should exist preceded discovery by several years), and some galaxies’ magnetic fields have been mapped in great detail.

But how did these magnetic fields come to have the characteristics we observe them to have? And how do they persist?

A recent paper by UK astronomers Stas Shabala, James Mead, and Paul Alexander may contain answers to these questions, with four physical processes playing a key role: infall of cool gas onto the disk, supernova feedback (these two increase the magnetohydrodynamical turbulence), star formation (this removes gas and hence turbulent energy from the cold gas), and differential galactic rotation (this continuously transfers field energy from the incoherent random field into an ordered field). However, at least one other key process is needed, because the astronomers’ models are inconsistent with the observed fields of massive spiral galaxies.

“Radio synchrotron emission of high energy electrons in the interstellar medium (ISM) indicates the presence of magnetic fields in galaxies. Rotation measures (RM) of background polarized sources indicate two varieties of field: a random field, which is not coherent on scales larger than the turbulence of the ISM; and a spiral ordered field which exhibits large-scale coherence,” the authors write. “For a typical galaxy these fields have strengths of a few μG. In a galaxy such as M51, the coherent magnetic field is observed to be associated with the optical spiral arms. Such fields are important in star formation and the physics of cosmic rays, and could also have an effect on galaxy evolution, yet, despite their importance, questions about their origin, evolution and structure remain largely unsolved.”

This field in astrophysics is making rapid progress, with understanding of how the random field is generated having become reasonably well-established only in the last decade or so (it’s generated by turbulence in the ISM, modeled as a single-phase magnetohydrodynamic (MHD) fluid, within which magnetic field lines are frozen). On the other hand, the production of the large-scale field by the winding of the random fields into a spiral, by differential rotation (a dynamo), has been known for much longer.

The details of how the ordered field in spirals formed as those galaxies themselves formed – within a few hundred million years of the decoupling of baryonic matter and radiation (that gave rise to the cosmic microwave background we see today) – are becoming clear, though testing these hypotheses is not yet possible, observationally (very few high-redshift galaxies have been studied in the optical and NIR, period, let alone have had their magnetic fields mapped in detail).

“We present the first (to our knowledge) attempt to include magnetic fields in a self-consistent galaxy formation and evolution model. A number of galaxy properties are predicted, and we compare these with available data,” Shabala, Mead, and Alexander say. They begin with an analytical galaxy formation and evolution model, which “traces gas cooling, star formation, and various feedback processes in a cosmological context. The model simultaneously reproduces the local galaxy properties, star formation history of the Universe, the evolution of the stellar mass function to z ~1.5, and the early build-up of massive galaxies.” Central to the model is the ISM’s turbulent kinetic energy and the random magnetic field energy: the two become equal on timescales that are instantaneous on cosmological timescales.

The drivers are thus the physical processes which inject energy into the ISM, and which remove energy from it.

“One of the most important sources of energy injection into the ISM are supernovae,” the authors write. “Star formation removes turbulent energy,” as you’d expect, and gas “accreting from the dark matter halo deposits its potential energy in turbulence.” In their model there are only four free parameters – three describe the efficiency of the processes which add or remove turbulence from the ISM, and one how fast ordered magnetic fields arise from random ones.

Are Shabala, Mead, and Alexander excited about their results? You be the judge: “Two local samples are used to test the models. The model reproduces magnetic field strengths and radio luminosities well across a wide range of low and intermediate-mass galaxies.”

And what do they think is needed to account for the detailed astronomical observations of high-mass spiral galaxies? “Inclusion of gas ejection by powerful AGNs is necessary in order to quench gas cooling.”

SKA central region with separate core stations for the two aperture arrays for low and mid frequencies and for the dish array. Graphics: Xilostudios and SKA Project Development Office

It goes without saying that the next generation of radio telescopes – EVLA, SKA, and LOFAR – will subject all models of magnetic fields in galaxies (not just spirals) to much more stringent tests (and even enable hypotheses on the formation of those fields, over 10 billion years ago, to be tested).

Source: Magnetic fields in galaxies: I. Radio disks in local late-type galaxies

Astronomers Find 90% More Universe!

The GOODS South Field. ESO/M. Hayes

[/caption]

Astronomers have long known that many surveys of distant galaxies miss 90% of their targets, but they didn’t know why. Now, astronomers have determined that a large fraction of galaxies whose light took 10 billion years to reach us have gone undiscovered. This was found with an extremely deep survey using two of the four giant 8.2-meter telescopes that make up ESO’s Very Large Telescope (VLT) and a unique custom-built filter. The survey also helped uncover some of the faintest galaxies ever found at this early stage of the Universe.

Astronomers frequently use the strong, characteristic “fingerprint” of light emitted by hydrogen known as the Lyman-alpha line, to probe the amount of stars formed in the very distant Universe Yet there have long been suspicions that many distant galaxies go unnoticed in these surveys. A new VLT survey demonstrates for the first time that this is exactly what is happening. Most of the Lyman-alpha light is trapped within the galaxy that emits it, and 90% of galaxies do not show up in Lyman-alpha surveys.

“Astronomers always knew they were missing some fraction of the galaxies in Lyman-alpha surveys,” explains Matthew Hayes, the lead author of the paper, published this week in Nature, “but for the first time we now have a measurement. The number of missed galaxies is substantial.”

To figure out how much of the total luminosity was missed, Hayes and his team used the FORS camera at the VLT and a custom-built narrowband filter to measure this Lyman-alpha light, following the methodology of standard Lyman-alpha surveys. Then, using the new HAWK-I camera, attached to another VLT Unit Telescope, they surveyed the same area of space for light emitted at a different wavelength, also by glowing hydrogen, and known as the H-alpha line. They specifically looked at galaxies whose light has been traveling for 10 billion years (redshift 2.2), in a well-studied area of the sky, known as the GOODS-South field.

“This is the first time we have observed a patch of the sky so deeply in light coming from hydrogen at these two very specific wavelengths, and this proved crucial,” said team member Goran Ostlin. The survey was extremely deep, and uncovered some of the faintest galaxies known at this early epoch in the life of the Universe. The astronomers could thereby conclude that traditional surveys done using Lyman-alpha only see a tiny part of the total light that is produced, since most of the Lyman-alpha photons are destroyed by interaction with the interstellar clouds of gas and dust. This effect is dramatically more significant for Lyman-alpha than for H-alpha light. As a result, many galaxies, a proportion as high as 90%, go unseen by these surveys. “If there are ten galaxies seen, there could be a hundred there,” Hayes said.

Different observational methods, targeting the light emitted at different wavelengths, will always lead to a view of the Universe that is only partially complete. The results of this survey issue a stark warning for cosmologists, as the strong Lyman-alpha signature becomes increasingly relied upon in examining the very first galaxies to form in the history of the Universe. “Now that we know how much light we’ve been missing, we can start to create far more accurate representations of the cosmos, understanding better how quickly stars have formed at different times in the life of the Universe,” said co-author Miguel Mas-Hesse.

The breakthrough was made possible thanks to the unique camera used. HAWK-I, which saw first light in 2007, is a state-of-the-art instrument. “There are only a few other cameras with a wider field of view than HAWK-I, and they are on telescopes less than half the size of the VLT. So only VLT/HAWK-I, really, is capable of efficiently finding galaxies this faint at these distances,” said team member Daniel Schaerer.

Read the team’s paper.

Source: ESO