The Orbit of the Moon

Earth as seen from lunar orbit. Credit: NASA

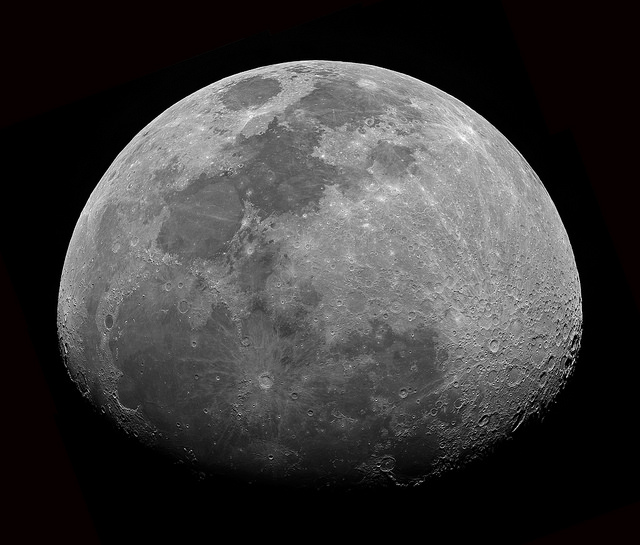
Since time immemorial, people have been staring up at the Moon with awe and wonder. For as long as there has been life on this planet, the Moon has been orbiting it. And as time went on, scholars and astronomers began to observe it regularly and calculate its orbit. In so doing, they learned some rather interesting things about its behavior.

For example, the Moon has an orbital period that is the same as its rotational period. In essence, it is tidally locked to the Earth, which means that it always presents the same face to us as it orbits around our planet. And during the course of its orbit, it also appears larger and smaller in the sky, which is due to the fact it is sometimes closer than at other times.

Orbital Parameters:

For starters, the Moon follows an elliptical path around the Earth – with an average eccentricity of 0.0549 – which means that its orbit is not perfectly circular. Its average orbital distance is 384,748 km, which ranges from 364,397 km at its closest, to 406,731 km at its most distant.

Comparison of the Moon's apparent size at lunar perigee–apogee. Credit: Wikipedia Commons/Tomruen
Comparison of the Moon’s apparent size at lunar perigee–apogee. Credit: Wikipedia Commons/Tomruen

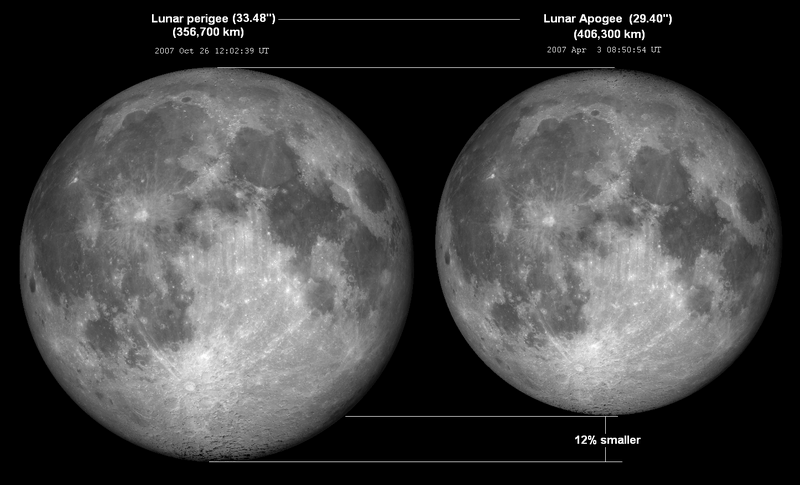
This non-circular orbit causes variations in the Moon’s angular speed and apparent size as it moves towards and away from an observer on Earth. When it’s full and at its closest point to Earth (perigee), the Moon can look over 10% bigger, and 30% brighter than when it’s at a more distant point in its orbit (apogee).

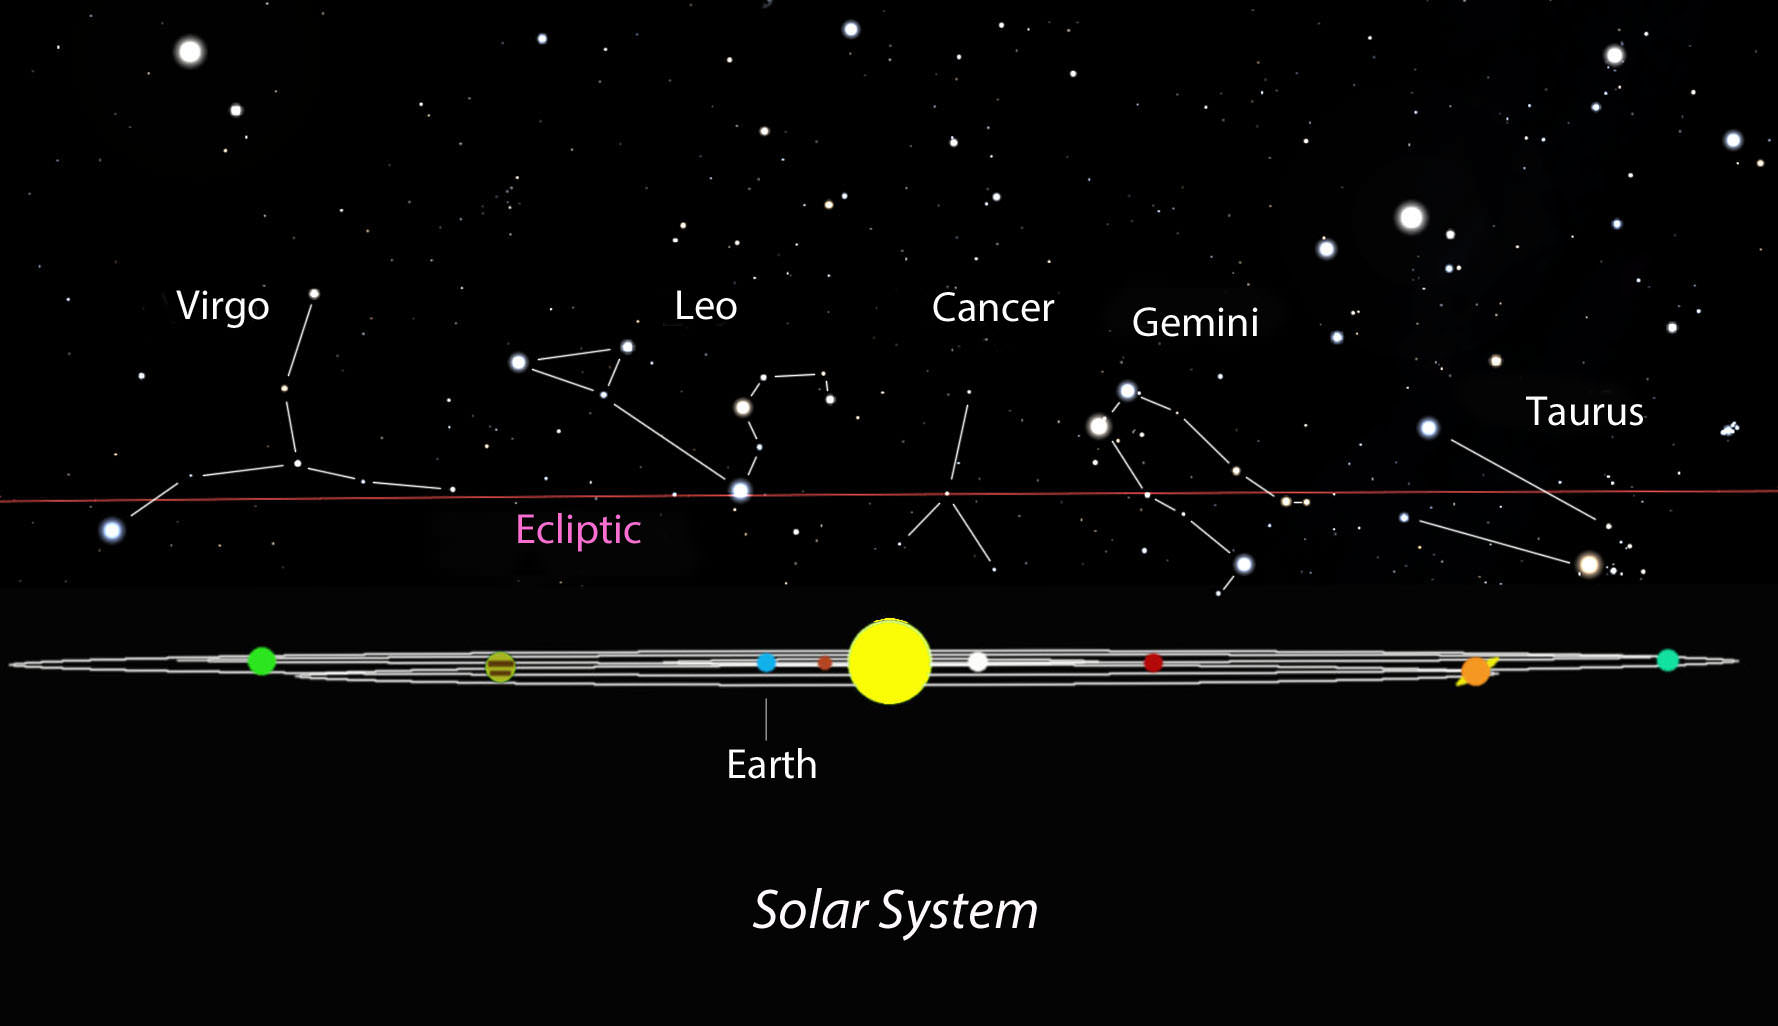
The mean inclination of the Moon’s orbit to the ecliptic plane (i.e. the apparent path of the Sun through the sky) is 5.145°. Because of this inclination, the moon is above the horizon at the North and South Pole for almost two weeks every month, even though the Sun is below the horizon for six months out of the year.

The Moon’s sidereal orbital period and rotational period are the same – 27.3 days. This phenomena, known as synchronous rotation, is what allows for the same hemisphere to be facing Earth all the time. Hence why the far side is colloquially referred to as the “Dark Side”, but this name is misleading. As the Moon orbits Earth, different parts are in sunlight or darkness at different times and neither side is permanently dark or illuminated.

Because Earth is moving as well – rotating on its axis as it orbits the Sun – the Moon appears to orbit us every 29.53 days. This is known as its synodic period, which is the amount of time it takes for the Moon to reappear in the same place in the sky. During a synodic period, the Moon will go through changes in its appearance, which are known as “phases“.

Lunar Cycle:

These changes in appearance are due to the Moon receiving more or less illumination (from our perspective). A full cycle of these phases is known as a Lunar Cycle, which comes down to the Moon’s orbit around the Earth, and our mutual orbit around the Sun. When the Sun, the Moon and Earth are perfectly lined up, the angle between the Sun and the Moon is 0-degrees.

At this point, the side of the Moon facing the Sun is fully illuminated, and the side facing the Earth is enshrouded in darkness. We call this a New Moon. After this, the phase of the Moon changes, because the angle between the Moon and the Sun is increasing from our perspective. A week after a New Moon, and the Moon and Sun are separated by 90-degrees, which effects what we will see.

And then, when the Moon and Sun are on opposite sides of the Earth, they’re at 180-degrees – which corresponds to a Full Moon. The period in which a Moon will go from a New Moon to a Full Moon and back again is also known as “Lunar Month”. One of these lasts 28 days, and encompasses what are known as “waxing” and “waning” Moons. During the former period, the Moon brightens and its angle relative to the Sun and Earth increases.

When the Moon is in between the Earth and the Sun, the side of the Moon facing away from the Earth is fully illuminated, and the side we can see is shrouded in darkness. As the Moon orbits the Earth, the angle between the Moon and the Sun increases. At this point, the angle between the Moon and Sun is 0 degrees, which gradually increases over the next two weeks. This is what astronomers call a waxing moon.

After the first week, the angle between the Moon and the Sun is 90-degrees and continues to increase to 180-degrees, when the Sun and Moon are on opposite sides of the Earth. When the Moon starts to decrease its angle again, going from 180-degrees back down to 0-degrees, astronomers say that it’s a waning moon. In other words, when the Moon is waning, it will have less and less illumination every night until it’s a New Moon.

When the Moon is no longer full, but it hasn’t reached a quarter moon – i.e. when it’s half illuminated from our perspective – we say that it’s a Waning Gibbous Moon. This is the exact reverse of a Waxing Gibbous Moon, when the Moon is increasing in brightness from a New Moon to a Full Moon.

This is followed by a Third Quarter (or last quarter) Moon. During this period, 50% of the Moon’s disc will be illuminated (left side in the northern hemisphere, and the right in the southern), which is the opposite of how it would appear during a First Quarter. These phases are often referred to as a “Half Moon”, since half the disc is illuminated at the time.

Finally, a Waning Crescent is when the Moon appears as a sliver in the night sky, where between 49–1% of one side is illuminated after a Full Moon (again, left in the northern hemisphere, right in the southern). This is the opposite of a Waxing Crescent, when 1-49% of the other wide is illuminated before it reaches a Full Moon.

Future of the Moon’s Orbit:

Currently, the Moon’s is slowly drifting away from the Earth, at a rate of about 1 to 2 cm per year. This is directly related to the fact that here on Earth, the day’s are getting longer – by a rate of 1/500th of a second every century. In fact, astronomers have estimated that roughly 620 million years ago, a day was only 21 hours long, and the Moon was between 6,200 – 12,400 km closer.

Now, the days are 24 hours long and getting longer, and the Moon is already at a average distance of 384,400 km. Eventually, the Earth and the Moon will be tidally locked to each other, so the same side of the Earth will always face the Moon, just like the same side of the Moon always presents the same face to the Earth. But this won’t happen for billions of years from now.

For as long as human beings have been staring up at the night sky, the Moon has been a part of our world. And over the course of the roughly 4.5 billion years that it has been our only natural satellite, the relationship between it and our planet has changed. As time goes on, it will continue to change; but to us, it will still be the Moon.

We’ve written many articles about the Moon for Universe Today. Here’s Interesting Facts About the Moon, What is a Moon?, Is the Moon a Planet?, What is the Diameter of the Moon?, What is the Distance to the Moon?, and Does the Moon Orbit the Sun?.

If you’d like more info on the Moon, check out NASA’s Solar System Exploration Guide on the Moon, and here’s a link to NASA’s Lunar and Planetary Science page.

We’ve also recorded an episode of Astronomy Cast all about the Moon. Listen here, Episode 113: The Moon, Part 1.

Sources:


When Was the First Light in the Universe?

When Was the First Light in the Universe?


The speed of light gives us an amazing tool for studying the Universe. Because light only travels a mere 300,000 kilometers per second, when we see distant objects, we’re looking back in time.

You’re not seeing the Sun as it is today, you’re seeing an 8 minute old Sun. You’re seeing 642 year-old Betelgeuse. 2.5 million year-old Andromeda. In fact, you can keep doing this, looking further out, and deeper into time. Since the Universe is expanding today, it was closer in the past.

Run the Universe clock backwards, right to the beginning, and you get to a place that was hotter and denser than it is today.  So dense that the entire Universe shortly after the Big Bang was just a soup of protons, neutrons and electrons, with nothing holding them together.

Illustration of the Big Bang Theory
The Big Bang Theory: A history of the Universe starting from a singularity and expanding ever since. Credit: grandunificationtheory.com

In fact, once it expanded and cooled down a bit, the entire Universe was merely as hot and as dense as the core of a star like our Sun. It was cool enough for ionized atoms of hydrogen to form.

Because the Universe has the conditions of the core of a star, it had the temperature and pressure to actually fuse hydrogen into helium and other heavier elements. Based on the ratio of those elements we see in the Universe today: 74% hydrogen, 25% helium and 1% miscellaneous, we know how long the Universe was in this “whole Universe is a star” condition.

It lasted about 17 minutes. From 3 minutes after the Big Bang until about 20 minutes after the Big Bang.  In those few, short moments, clowns gathered all the helium they would ever need to haunt us with a lifetime of balloon animals.

The fusion process generates photons of gamma radiation. In the core of our Sun, these photons bounce from atom to atom, eventually making their way out of the core, through the Sun’s radiative zone, and eventually out into space. This process can take tens of thousands of years. But in the early Universe, there was nowhere for these primordial photons of gamma radiation to go. Everywhere was more hot, dense Universe.

The Universe was continuing to expand, and finally, just a few hundred thousand years after the Big Bang, the Universe was finally cool enough for these atoms of hydrogen and helium to attract free electrons, turning them into neutral atoms.

Artist's impression of how huge cosmic structures deflect photons in the cosmic microwave background (CMB). Credit: ESA and the Planck Collaboration
Artist’s impression of how huge cosmic structures deflect photons in the cosmic microwave background (CMB). Credit: ESA and the Planck Collaboration

This was the moment of first light in the Universe, between 240,000 and 300,000 years after the Big Bang, known as the Era of Recombination. The first time that photons could rest for a second, attached as electrons to atoms. It was at this point that the Universe went from being totally opaque, to transparent.

And this is the earliest possible light that astronomers can see. Go ahead, say it with me: the Cosmic Microwave Background Radiation. Because the Universe has been expanding over the 13.8 billion years from then until now, the those earliest photons were stretched out, or red-shifted, from ultraviolet and visible light into the microwave end of the spectrum.

If you could see the Universe with microwave eyes, you’d see that first blast of radiation in all directions. The Universe celebrating its existence.

After that first blast of light, everything was dark, there were no stars or galaxies, just enormous amounts of these primordial elements. At the beginning of these dark ages, the temperature of the entire Universe was about 4000 kelvin. Compare that with the 2.7 kelvin we see today. By the end of the dark ages, 150 million years later, the temperature was a more reasonable 60 kelvin.

Artist's concept of the first stars in the Universe turning on some 200 million years after the Big Bang. These first suns were made of almost pure hydrogen and helium. They and later generations of stars cooked up the heavier elements from these simple ones. Credit: NASA/WMAP Science Team
Artist’s concept of the first stars in the Universe turning on some 200 million years after the Big Bang. These first suns were made of almost pure hydrogen and helium. They and later generations of stars cooked up the heavier elements from these simple ones. Credit: NASA/WMAP Science Team

For the next 850 million years or so, these elements came together into monster stars of pure hydrogen and helium. Without heavier elements, they were free to form stars with dozens or even hundreds of times the mass of our own Sun. These are the Population III stars, or the first stars, and we don’t have telescopes powerful enough to see them yet. Astronomers indirectly estimate that those first stars formed about 560 million years after the Big Bang.

Then, those first stars exploded as supernovae, more massive stars formed and they detonated as well. It’s seriously difficult to imagine what that time must have looked like, with stars going off like fireworks. But we know it was so common and so violent that it lit up the whole Universe in an era called reionization. Most of the Universe was hot plasma.

Scientists have used ESO’s Very Large Telescope to probe the early Universe at several different times as it was becoming transparent to ultraviolet light. This brief but dramatic phase in cosmic history — known as reionisation — occurred around 13 billion years ago. By carefully studying some of the most distant galaxies ever detected, the team has been able to establish a timeline for reionisation for the first time. They have also demonstrated that this phase must have happened quicker than astronomers previously thought.
Scientists have used ESO’s Very Large Telescope to probe the early Universe at several different times as it was becoming transparent to ultraviolet light. This brief but dramatic phase in cosmic history — known as reionisation — occurred around 13 billion years ago.

The early Universe was hot and awful, and there weren’t a lot of the heavier elements that life as we know it depends on. Just think about it. You can’t get oxygen without fusion in a star, even multiple generations. Our own Solar System is the result of several generations of supernovae that exploded, seeding our region with heavier and heavier elements.

As I mentioned earlier in the article, the Universe cooled from 4000 kelvin down to 60 kelvin. About 10 million years after the Big Bang, the temperature of the Universe was 100 C, the boiling point of water. And then 7 million years later, it was down to 0 C, the freezing point of water.

This has led astronomers to theorize that for about 7 million years, liquid water was present across the Universe… everywhere. And wherever we find liquid water on Earth, we find life.

An artists illustration of the early Universe. Image Credit: NASA

So it’s possible, possible that primitive life could have formed with the Universe was just 10 million years old. The physicist Avi Loeb calls this the habitable Epoch of the Universe. No evidence, but it’s a pretty cool idea to think about.

I always find it absolutely mind bending to think that all around us in every direction is the first light from the Universe. It’s taken 13.8 billion years to reach us, and although we need microwave eyes to actually see it, it’s there, everywhere.

The Cancer Constellation

The constellation Cancer as it can be seen by the naked eye. Credit: AlltheSky/Till Credner

Welcome back to Constellation Friday! Today, we will be dealing with one of the best-known constellations, that crabby asterism known as “Cancer”!

In the 2nd century CE, Greek-Egyptian astronomer Claudius Ptolemaeus (aka. Ptolemy) compiled a list of the then-known 48 constellations. His treatise, known as the Almagest, would be used by medieval European and Islamic scholars for over a thousand years to come. One of these constellations is Cancer, which is represented by “the Crab”.

As one of the twelve constellations of the zodiac, this medium-sized constellation is located on the ecliptic plane, where it is bordered by Gemini to the west, Lynx to the north, Leo Minor to the northeast, Leo to the east, Hydra to the south, and Canis Minor to the southwest. Today, it is one of the 88 constellation that are recognized by the International Astronomical Union (IAU) today.

Name and Meaning:

In mythology, Cancer was part of the Twelve Labors of Hercules. While Hercules was busy fighting the multi-headed monster (Hydra), the goddess Hera – who did not like Hercules – sent the Crab to distract him. Cancer grabbed onto the hero’s toe with its claws, but was crushed by Hercule’s mighty foot. Hera, grateful for the little crustacean’s heroic sacrifice, gave it a place in the sky. Given that the crab did not win, the gods didn’t give it any bright stars.

The planets, including Earth, orbit within a relatively flat plane. As we watch them cycle through their orbits, two or more occasionally bunch close together in a conjunction. We see them projected against the
Illustration of the ecliptic of the Solar System, showing the position of the twelve constellations of the zodiac. Credit: Bob King

History of Observation:

The first recorded examples of the Cancer constellation come from the 2nd millennium BCE, where it was known to Akkadian astronomers as the “Sun of the South”. This was most likely due to its position at the summer solstice during ancient antiquity. By classical antiquity, Cancer came to be called the “Gate of Men”, based on the beleif that it was the portal through which souls came and went from the heavens.

Given its relative faintness in the night sky, Cancer was often described as the “Dark Sign” throughout history. For instance, the medieval Italian poet Dante alluded to its faintness and position of Cancer in heavens as follows (in the Paradiso section of The Divine Comedy):

“Then a light among them brightened,
So that, if Cancer one such crystal had,
Winter would have a month of one sole day.”

Cancer’s stature as a constellation of the Zodiac has remained steadfast over the millennia, thought its position has changed. Over two thousand years ago, the sun shone in front of the constellation during the Northern Hemisphere’s summer solstice. Today, the Sun resides in front of the constellation Taurus when the summer solstice sun reaches its northernmost point.

ancer’s stature as a constellation of the Zodiac has remained steadfast over the millennia. Over two thousand years ago, the sun shone in front of the constellation Cancer during the Northern Hemisphere’s summer solstice. That’s not the case today, however. Today, the sun resides in front of the constellation Taurus when the summer solstice sun reaches its northernmost point for the year on or near June 21. Nonetheless, Cancer still seems to symbolize the height and glory of the summer sun. To this day, we say the sun shines over the Tropic of Cancer – not the “tropic of Taurus” – on the June solstice. That’s in spite of the fact that the sun in our time passes in front of the constellation Cancer from about July 21 until August 10. Dates of sun’s entry into each constellation of the Zodiac Nowadays, the sun doesn’t enter the constellation Cancer until about a month after the Northern Hemisphere’s summer solstice. Credit: US Library of Congress
Cancer as depicted in Urania’s Mirror, a set of constellation cards published in London c.1825. Credit: US Library of Congress

Notable Features:

Though comparatively faint, the Cancer constellation contains several notable stars. For starters, there is Beta Cancri, which is also known by the Arabic name of Al Tarf (“the eye” or “the glance”). Beta Cancri is the brightest star in Cancer and is about 660 times brighter than our Sun.

This K-class orange giant star is about 290 light years away from Earth, and is part of a binary system that includes a 14th magnitude star. This second star is so far away – about 65 times the distance of Pluto from the Sun – that their orbital period is at least 76,000 years!

Then there is Delta Cancri – an orange giant star approximately 180 light-years away. This is the second-brightest star in the Cancer constellation, and also where the famous Beehive Cluster (Messier 44) can be found (see below). It is also known by its Latin name of Asellus Australis, which means “southern donkey colt” (or “southern ass” if you’re feeling comedic!).

A bit further north is Gamma Cancri, an A-type white subgiant located 158 light years from Earth. Its Latin name is Asellus Borealis, which means (you guessed it!) “northern ass”. Both this star and Delta Cancri are significant because of their mythological connection and proximity to Messier 44.

Next up is Alpha Cancri, the fourth brightest star in the constellation, which is also known as Acubens. The star also goes by the names of Al Zubanah or Sertans, which are derived from the Arabic az-zub?nah (which means “claws”), while Sertan is derived from sara??n, which means “the crab.” Located approximately 174 light years from Earth, Alpha Cancris is actually a multiple star system – Alpha Cancri A and B (a white A-type dwarf and an 11th magnitude star, respectively.

Messier 44, otherwise known as the Beehive Cluster. Credit & Copyright: Bob Franke

Cancer is also home to many Deep Sky Objects. For instance, there is the aforementioned Beehive Cluster (Messier 44). This open cluster is the nearest of its type relative to our Solar System, and contains a larger star population than most other nearby clusters. Under dark skies the Beehive Cluster looks like a nebulous object to the unaided eye; thus it has been known since ancient times.

The classical astronomer Ptolemy called it “the nebulous mass in the heart of Cancer,” and it was among the first objects that Galileo studied with his telescope. The cluster’s age and proper motion coincide with those of the Hyades stellar association, suggesting that both share a similar origin. Both clusters also contain red giants and white dwarfs, which represent later stages of stellar evolution, along with main sequence stars of spectral classes A, F, G, K, and M.

So far, eleven white dwarfs have been identified, representing the final evolutionary phase of the cluster’s most massive stars, which originally belonged to spectral type B. Brown dwarfs, however, are extremely rare in this cluster, probably because they have been lost by tidal stripping from the halo.

Then there’s M67, which can be viewed due west of Alpha Cancri. M67 is not the oldest known galactic cluster, but there are very few in the Milky Way known to be older. M67 is an important laboratory for studying stellar evolution, since all its stars are at the same distance and age, except for approximately 30 anomalous blue stragglers, whose origins are not fully understood.

The Messier 67 star cluster, one of the oldest known open star clusters. located in the constellation Cancer. Credit & Copyright: Noel Carboni/Greg Parker

M67 has more than 100 stars similar to the Sun and many red giants, though the total star count has been estimated at over 500. The cluster contains no main sequence stars bluer than spectral type F, since the brighter stars of that age have already left the main sequence. In fact, when the stars of the cluster are plotted on the Hertzsprung-Russell diagram, there is a distinct “turn-off” representing the stars which are just about to leave the main sequence and become red giants.

It appears that M67 does not contain an unbiased sample of stars. One cause of this is mass segregation, the process by which lighter stars (actually, systems) gain speed at the expense of more massive stars during close encounters, which causes the lighter stars to be at a greater average distance from the center of the cluster or to escape altogether.

Then there’s NGC 2775, which is positioned some 60 million light years away. NGC 2775 is a peculiar blend of spiral galaxy with a smooth bulge in the center. The star formation is confined to this ring of tightly wound arms, and the galaxy has been the location of 5 supernovae explosions in the past 30 years!

Next up is DX Cancri, a faint, magnitude 14, cool red dwarf star that has less than 9% the mass of our Sun. It is a flare star that has intermittent changes in brightness by up to a five-fold increase. This star is far too faint to be seen with the naked eye, even though it is the 18th closest star system to the Sun at a distance of 11.82 light years, and is the closest star in the constellation Cancer.

Artist’s impression of the super-Earth 55 Cancri e in front of its parent star. Credit: ESA/NASA

Now set your mark on 55 Cancri (located at RA 8 52 35 Dec +28 19 59). Also known as Rho1 Cancri, this binary star system is located approximately 41 light-years away from Earth and has a whole solar system of its own! The system consists of a yellow dwarf star and a smaller red dwarf star, separated by over 1,000 times the distance from the Earth to the Sun.

As of 2007, five extrasolar planets have been confirmed to be orbiting the primary – 55 Cancri A (the yellow dwarf). The innermost planet is thought to be a terrestrial “super-Earth” planet, with a mass similar to Neptune, while the outermost planets are thought to be Jovian planets with masses similar to Jupiter.

Finding Cancer:

As one of the 12 constellations along the ecliptic, Cancer is relatively easy to find with small telescopes and even binoculars. It lies in the second quadrant of the northern hemisphere (NQ2) and can be seen at latitudes between +90° and -60°. It occupies an area of 506 square degrees, making it the 31st largest constellation in the night sky.

There is only one meteor shower associated with the constellation of Cancer. The peak date for the Delta Cancrids is on or about January 16th. The radiant, or point of origin is just west of Beehive. It is a minor shower and the fall rate averages only about 4 per hour and the meteors are very swift.

The location of the Caner constellation. Credit: IAU

Like all of the traditional constellations that belong to the Zodiac family, the significance of Cancer has not waned, despite the passage of several thousand years. Best of luck finding it, though you won’t need much!

We have written many interesting articles about the constellation here at Universe Today. Here is What Are The Constellations?What Is The Zodiac?, and Zodiac Signs And Their Dates.

Be sure to check out The Messier Catalog while you’re at it!

For more information, check out the IAUs list of Constellations, and the Students for the Exploration and Development of Space page on Cancer and Constellation Families.

Sources:

What is the World’s Deepest Ocean?

Earth, seen from space, above the Pacific Ocean. Credit: NASA

One look at planet Earth on a map, or based on an image taken from space, ought to convey just how immense and important our oceans are. After all, they cover 72% of the planet’s surface, occupy a total volume of around 1.35 billion cubic kilometers (320 million cu mi), and are essential to life as we know it. And in their great depths, many mysteries still wait to be discovered.

Thanks to modern science and improvement exploration vehicles, one of the most obvious has been tackled – which is the mystery of where the deepest ocean in the world lies. This is none other than the Pacific Ocean, which  averages approximately 4,280 meters (14,042 ft) in depth and contains the deepest known part of any ocean – the Mariana Trench.

Methodology:

Of course, determining the depth of an ocean is tricky business, and for obvious reasons. Ocean floors are extremely extensive, and vary widely in terms of elevation. Much like continental land masses, they have mountain ranges and trenches that throw off the curve. And in some cases, the trenches are much deeper than the average depth.

Oceans
The view of the Pacific Ocean from the ISS. Credit: NASA

However, in terms of average depth, the Pacific Ocean is the deepest. Though calculations vary, it is estimated that the entire ocean floor averages about 4,280 meters (14,042 ft), which is over 500 m (1640 ft) deeper than the global average of 3,700 meters (12,100 ft). Part of the reason for this is due to the Marian Trench, which is significantly deeper!

Characteristics:

The Marian Trench is located in the western Pacific Ocean near the Mariana Islands, almost equally distant from both the Philippines and Japan. The trench is crescent shaped, and measures roughly 2,550 kilometers (1,580 mi) long with an average width of 69 kilometers (43 mi).

It reaches a maximum-known depth of 10,994 meters (36,070 ft) – with a margin of error of 40 metes (130 ft) – at a small slot-shaped valley in its floor known as the Challenger Deep, located at its southern end. Countries near the trench include Japan, Papua New Guinea, Indonesia and the Philippines.

The geological feature is the result of subduction that occurs at the boundary between two tectonic plates – the Filipino and the Pacific Plate. This results in what is known as the Izu-Bonin-Mariana subduction system, where the western edge of the Pacific Plate is subducted (pushed under) the smaller Mariana plate (part of the Filipino Plate).

Location of the Mariana Trench. Credit: Wikipedia Commons/Kmusser

The movement of the Pacific and Mariana Plates also led to the formation of the Mariana Islands, which are volcanic in nature. They formed as a result of flux melting – i.e. where water cools hot lava – due to the release of water that was trapped in the subducted portion of the Pacific Plate.

To put just how deep the Mariana Trench is into perspective, let’s consider comparing it to Mount Everest. If you placed Mt. Everest inside the Mariana Trench, there would still be over 2,000 meters (6562 ft) of water covering the mountain.

The water pressure in the Mariana Trench is also 15,750 psi, which is more than 1000 times greater than the standard atmospheric pressure at sea level. This means that if you could stand at the bottom of the Mariana Trench, the pressure could literally crush you!

Measurement:

Numerous measurements of the trench have been taken over the years using different methods. The first mission was the Challenger expedition, which took place between 1872 and 1876. Using the sounding technique, they measured the deepest point of Mariana Trench to 9,636 meters (31,614 ft).

The HMS Challenger, which made the first measurements of the Mariana Trench. Credit: Imperial War Museums.
The HMS Challenger, which conducted the Challenger II measurements of the Mariana Trench. Credit: Imperial War Museums.

This was followed by the HMS Challenger, which conducted the Challenger II survey in 1931. Here, surveyors relied on the more accurate technique of echo-sounding, and retrieved a deepest measurement of 10,900 meters (35,760 ft). This area came to be known as the Challenger Deep.

During the latter half of the 20th century, multiple missions would be conducted. In 1957, the Soviet vessel Vityaz obtained depth readings of 11,034 meters (36,201 ft) at a location named “the Mariana Hollow”. This was followed in 1962 by the US merchant vessel Spencer F. Baird, which recorded a maximum depth of 10,915 meters (35,810 ft) using precision depth gauges.

In 1984, the Japanese survey vessel Takuyo used a narrow, multi-beam echo sounder and reported a maximum depth of 10,924 meters (35,840 ft). In 1995, another Japanese vessel – the remotely operated vehicle KAIKO – reached the deepest area of the Mariana trench, thus establishing the deepest diving record of 10,911 meters (35,797 ft).

In 2009, the US research vessel Kilo Moana conducted the most accurate measurements of the Mariana Trench to date. This involved using sonar to map the Challenger Deep, which located a spot with a maximum depth of 10,971 meters (35,994 ft).

Rear view of the research vessel Kilo Moana. NOAA

Exploration:

Four missions have been made into the Mariana Trench. The first was the Trieste, a Swiss-designed, Italian-built, and US Navy-owned self-propelled submersible craft. On January 23rd, 1960, the craft and its two-man crew reached the bottom of the Trench, having reached a depth of 10,916 m (35,814 ft). This was followed by the unmanned Kaiko craft in 1996 and the autonomous craft Nereus in 2009.

The first three expeditions directly measured very similar depths of 10,902 to 10,916 m (35,768 to 35,814 ft). The fourth mission took place in 2012, where Canadian film director James Cameron mounted a mission using the submersible Deepsea Challenger. On March 26th, he reached the bottom of the Mariana Trench.

Several more missions have been planned as of February of 2012. These include Triton Submarines, a Florida-based company that designs and manufactures private submarines; and DOER Marine, a marine technology company based near San Francisco that plans to send a two or three-person sub to the seabed.

Beyond the coastlines, the world’s oceans are deep and unfathomable. Much of it remains unexplored and the life that scientists have found there is quite exotic (and may even provide insight into life on other worlds). Somehow, it seems appropriate that life in “inner space” would help us to understand life in “outer space”.

We have written many interesting articles about the Pacific Ocean here at Universe Today. Here’s How Many Oceans are there in the World?, What Causes Tides?, Did Comets Create the Earth’s Oceans?, and What Percentage of Earth is Water?

If you are looking for more information, you should try this article from National Geographic on life in the Mariana Trench  and this website on the Mariana Trench.

Astronomy Cast has an episode on the subject – Episode 51: Earth.

Sources:

How Many Galaxies Are There in the Universe?

How Many Galaxies Are There in the Universe?


The wonderful thing about science is that it’s constantly searching for new evidence, revising estimates, throwing out theories, and sometimes discovering aspects of the Universe that we never realized existed.

The best science is skeptical of itself, always examining its own theories to find out where they could be wrong, and seriously considering new ideas to see if they better explain the observations and data.

What this means is that whenever I state some conclusion that science has reached, you can’t come back a few years later and throw that answer in my face. Science changes, it’s not my fault.

I get it, VY Canis Majoris isn’t the biggest star any more, it’s whatever the biggest star is right now. UY Scuti? That what it is today, but I’m sure it’ll be a totally different star when you watch this in a few years.

What I’m saying is, the science changes, numbers update, and we don’t need to get concerned when it happens. Change is a good thing. And so, it’s with no big surprise that I need to update the estimate for the number of galaxies in the observable Universe. Until a couple of weeks ago, the established count for galaxies was about 200 billion galaxies.

Jacinta studies distant galaxies like those shown in this image from the Hubble Space Telescope, using the new 'stacking' technique to gather information only available through radio telescope observations. Credit: NASA, STScI, and ESA.
Jacinta studies distant galaxies like those shown in this image from the Hubble Space Telescope, using the new ‘stacking’ technique to gather information only available through radio telescope observations. Credit: NASA, STScI, and ESA.

But a new paper published in the Astrophysics Journal revised the estimate for the number of galaxies, by a factor of 10, from 200 billion to 2 trillion. 200 billion, I could wrap my head around, I say billion all the time. But 2 trillion? That’s just an incomprehensible number.

Does that throw all the previous estimates for the number of stars up as well? Actually, it doesn’t.

The observable Universe measures 13.8 billion light-years in all directions. What this means is that at the very edge of what we can see, is the light left that region 13.8 billion years ago. Furthermore, the expansion of the Universe has carried to those regions 46 billion light-years away.

Does that make sense? The light you’re seeing is 13.8 billion light-years old, but now it’s 46 billion light-years away. What this means is that the expansion of space has stretched out the light from all the photons trying to reach us.

What might have been visible or ultraviolet radiation in the past, has shifted into infrared, and even microwaves at the very edge of the observable Universe.

Since astronomers know the volume of the observable Universe, and they can calculate the density of the Universe, they know the mass of the entire Universe. 3.4 x 10^54 kilograms including regular matter and dark matter.  They also know the ratio of regular matter to dark matter, so they can calculate the total amount of regular mass in the Universe.

In the past, astronomers divided that total mass by the number of galaxies they could see in the original Hubble data and determined there were about 200 billion galaxies.

Now, astronomers used a new technique to estimate the galaxies and it’s pretty cool. Astronomers used the Hubble Space Telescope to peer into a seemingly empty part of the sky and identified all the galaxies in it. This is the Hubble Ultra Deep Field, and it’s one of the most amazing pictures Hubble has ever captured.

The Hubble Ultra Deep Field seen in ultraviolet, visible, and infrared light. Image Credit: NASA, ESA, H. Teplitz and M. Rafelski (IPAC/Caltech), A. Koekemoer (STScI), R. Windhorst (Arizona State University), and Z. Levay (STScI)

Astronomers painstakingly converted this image of galaxies into a 3-dimensional map of galaxy size and locations. Then, they used their knowledge of galaxy structure closer to home to provide a more accurate estimate of what the galaxies must look like, out there, at the very edge of our observational ability.

For example, the Milky Way is surrounded by about 50 satellite dwarf galaxies, each of which has a fraction of the mass of the Milky Way.

By recognizing which were the larger main galaxies, they could calculate the distribution of smaller, dimmer dwarf galaxies that weren’t visible in the Hubble images.

In other words, if the distant Universe is similar to the nearby Universe, and this is one of the principles of modern astronomy, then the distant galaxies have the same structure as nearby galaxies.

It doesn’t mean that the Universe is bigger than we thought, or that there are more stars, it just means that the Universe contains more galaxies, which have less stars in them. There are the big main galaxies, and then a smooth distribution curve of smaller and smaller galaxies down to the tiny dwarf galaxies. The total number of stars comes out to be the same number.

The Fornax dwarf galaxy is one of our Milky Way’s neighbouring dwarf galaxies. The Milky Way is, like all large galaxies, thought to have formed from smaller galaxies in the early days of the Universe. These small galaxies should also contain many very old stars, just as the Milky Way does, and a team of astronomers has now shown that this is indeed the case. This image was composed from data from the Digitized Sky Survey 2. Credit: ESO
The Fornax dwarf galaxy is one of our Milky Way’s neighbouring dwarf galaxies. Credit: ESO

The galaxies we can see are just the tip of the galactic iceberg. For every galaxy we can see, there are another 9, smaller fainter galaxies that we can’t see.

Of course, we’re just a few years away from being able to see these dimmer galaxies. When NASA’s James Webb Space Telescope launches in October, 2018, it’s going to be carrying a telescope mirror with 25 square meters of collecting surface, compared to Hubble’s 4.5 square meters.

Furthermore, James Webb is an infrared telescope, a specialized tool for looking at cooler objects, and galaxies which are billions of light-years away. The kinds of galaxies that Hubble can only hint at, James Webb will be able to see directly.

So, why don’t we see galaxies in all directions with our eyeballs?  This is actually an old conundrum, proposed by Wilhelm Olbers in the 1700, appropriately named Olber’s Paradox.  We did a whole article on it, but the basic idea is that if you look in any direction, you’ll eventually hit a star. It could be close, like the Sun, or very far away, but whatever the case, it should be stars in all directions. Which means that the entire night sky should be as bright as the surface of a star. Clearly it isn’t, but why isn’t it?

In fact, with 10 times the number of galaxies, you could restate the paradox and say that in every direction, you should be looking at a galaxy, but that’s not what you see.

A partial map of the distribution of galaxies in the SDSS, going out to a distance of 7 billion light years. The amount of galaxy clustering that we observe today is a signature of how gravity acted over cosmic time, and allows as to test whether general relativity holds over these scales. (M. Blanton, SDSS)

Except you are. Everywhere you look, in all directions, you’re seeing galaxies. It’s just that those galaxies are red-shifted from the visible spectrum into the infrared spectrum, so your eyeballs can’t perceive them. But they’re there.

When you see the sky in microwaves, it does indeed glow in all directions. That’s the Cosmic Microwave Background Radiation, shining behind all those galaxies.

It turns out the Universe has 10 times more galaxies than previously estimated – 2 trillion galaxies. Not 10 times the stars or mass, those numbers have stayed the same.

And, once James Webb launches, those numbers will be fine-tuned again to be even more precise. 1.5 trillion? 3.4 trillion? Stay tuned for the better number.

Why Does it Rain?

Earth, seen from space, above the Pacific Ocean. Credit: NASA

Many people love to ask, why does it always rain on me? There are those who would like to know why it rains so much when they are sad, when they feel like going out, or only when they decide to jog or take their pet for a walk. There are no easy answers for these arguably subjective questions. However, if one to ask “why does it rain”, the answer would be much simpler.

For starters, rain is liquid precipitation, as opposed to non-liquid kinds (such as snow, hail and sleet). It begins with the vaporization of water near the Earth’s surface, in the form of rivers, lakes, oceans or ground water, provided there are atmospheric temperatures above melting point of water (0°C). This is followed by the condensation of atmospheric water vapor into drops of water that are heavy enough to fall, often making it to the surface.

Precipitation is also a major component of the hydrological cycle – aka. “water cycle“. This is the term used to describe the continuous movement of water on, above, and below the Earth, and is responsible for depositing most of the fresh water on the planet. Rain occurs when two basic processes occur: Saturation and Coalescence.

Diagram of the Water Cycle. Credit: NASA Precipitation Education

Saturation:

This process occurs when “invisible” moisture in the air (water vapor) is forced to condense on microscopic particles (i.e. pollen and dust) to form tiny “visible” droplets. The amount of moisture in air is also commonly reported as relative humidity; which is the percentage of the total water vapor air can hold at a particular air temperature.

How much water vapor a parcel of air can contain before it becomes saturated (100% relative humidity) and forms into a cloud (a group of visible and tiny water and ice particles suspended above the Earth’s surface) depends on its temperature. Warmer air can contain more water vapor than cooler air before becoming saturated.

Coalescence:

Condensation occurs when the air is cooled down to its “dew point” temperature – the point at which it becomes saturated. Coalescence occurs when water droplets fuse to create larger water droplets (or when water droplets freeze onto an ice crystal) which is usually the result of air turbulence which forces collisions to occur.

As these larger water droplets descend, coalescence continues, so that drops become heavy enough to overcome air resistance and fall as rain. Rain is the primary source of freshwater for most areas of the world, providing suitable conditions for diverse ecosystems, as well as water for hydroelectric power plants and crop irrigation.

Earth Observation of sun-glinted ocean and clouds
Image obtained by the Earth Observatory of the sun-glinted ocean and clouds. Credit: NASA

Measurement:

Rainfall is measured through the use of rain gauges. These gauges typically consist of two cylinders, one within the other, that fill with water. The inner cylinder fills first, with overflow entering the outer cylinder. Once the inner cylinder is filled, it is emptied and then filled with the remaining rainfall in the outer cylinder, producing a total estimate in millimeters or inches.

Other types of gauges include the popular wedge gauge, the tipping bucket rain gauge, and the weighing rain gauge. The most inexpensive option is a simple cylinder with a measuring stick, provided the cylinder is straight and the measuring stick is accurate. Any of these gauges can be made at home, with the right kind of knowledge.

Precipitation amounts are also estimated actively by weather radar, and passively by weather satellites. Examples of the latter include the Tropical Rainfall Measuring Mission (TRMM) satellite – a joint mission conducted by NASA and the Japanese Space Agency to monitor precipitation in the tropics – and NASA’s Global Precipitation Measurement (GPM).

Both of these mission employ microwave sensors to create precipitation estimates. Annual precipitation data is collected and monitored by NASA’s Earth Observatory (NEO), which creates detailed maps of global weather patterns (as well as heating and other meteorological factors).

3D view inside an extra-tropical cyclone observed off the coast of Japan, March 10, 2014, by GPM's Dual-frequency Precipitation Radar. The vertical cross-section approx. 4.4 mi (7 km) high show rain rates: red areas indicate heavy rainfall while yellow and blue indicate less intense rainfall. Credit: JAXA/NASA
A 3D map of the extra-tropical cyclone observed off the coast of Japan on March 10th, 2014, by GPM’s Dual-frequency Precipitation Radar. The colors indicate intensity of rainfall. Credit: JAXA/NASA

Climate Change:

Anthropocentric Climate Change, which includes Global Warming, is also causing changes in global precipitation patterns. This is due to the fact that increases in carbon dioxide emissions have led to increasing annual temperatures around the globe, leading to more evaporation and precipitation and more extreme weather events.

At latitudes north of 30°, precipitation has increased over the past century, while similarly declining over the tropics since the 1970s. And while there has been no consistent change on a global scale, regional variations have been pronounced. For instance, eastern portions of North and South America, northern Europe, and northern and central Asia have become wetter.

Other regions, such as the Sahel (between the Sahara desert and the Sudanian Savanna), the Mediterranean, southern Africa and parts of southern Asia have become drier. There has also been an increase in both the number of heavy rainstorms and droughts over many areas in the past century. In the tropics and subtropics, there has also been an increase in the prevalence of droughts since the 1970s.

Rain on Other Planets:

Despite what you might think, Earth is not the only planet where rain occurs. On other bodies in the Solar System, liquid precipitation takes place, though it rarely involves water. In fact, on Venus, rain regularly occurs, except that it involves sulfuric acid!

This acid rain is formed high in the atmosphere, where the wind speeds get up to 360 kilometers/hour (224 mph). However, once the droplets reach the lower atmosphere, they evaporate due to the extreme heat – over 460 °C or 860 °F. Hence, the rain never reaches the surface, which is extremely dry and molten.

On Saturn’s moon Titan, rain takes the form of methane. As evidence provided by the Cassini-Huygens mission has indicated, the moon has an active hydrological cycle. Except that Titan’s involves liquid hydrocarbons instead of water. As part of this cycle, liquid methane evaporates on the surface, accumulates in the atmosphere, and then returns to the surface as seasonal rains.

But it gets weirder! For instance, in recent years, scientists have obtained experimental evidence that indicates that Jupiter and Saturn may experience liquid helium rain. Due to the extreme pressure conditions that exist within the gas giants interior, these gases are compressed to the point where they take liquid form.

And then there’s what is known as “diamond rain”, which has been speculated to exist on all the gas giants. Essentially, Jupiter, Saturn, Uranus and Neptune all possess methane in their interiors. Due to the extreme pressure conditions, these hydrocarbons are compressed to the point that actual diamonds are believed to form. As such, diamond rain may actually exist in these gas/ice giants.

Last, but not least, there is the curious case of “Coronal Rain“, which takes place on the Sun. This phenomena occurs during a coronal mass ejection, where plasma cools after being ejected and falls back to the surface. Sometimes, these plasma droplets makes ‘splashes’ where they hit. And instead of falling straight down, the plasma rain appears to follow the path of the Sun’s invisible magnetic field lines.

Here on Earth, rain takes the form of water, and is an intrinsic part of our hydrological cycle. On other worlds, rain can take a different form, but still occupies much the same place in the planet’s cycle. Due to changing temperatures, saturation and coalescence, what goes up (in the form of vapor) must eventually come down.

We have written many articles about rain for Universe Today. Here’s What are Cumulonimbus Clouds?, What is the Wettest Place on Earth?, What is a Warm Front?, Evidence of Rain on Mars, and Rare Rain on Titan; Once Every 1,000 Years.

If you’d like more info on rain, check out Visible Earth Homepage. And here’s a link to NASA’s Earth Observatory.

We’ve also recorded an episode of Astronomy Cast all about planet Earth. Listen here, Episode 51: Earth.

Sources:

Messier 25 – The IC 4725 Open Cluster

Messier 25, shown in proximity to the Sagittarius Constellation. Credit: Wikisky

Welcome back to Messier Monday! In our ongoing tribute to the great Tammy Plotner, we take a look at the Messier 25 open star cluster. Enjoy!

Back in the 18th century, famed French astronomer Charles Messier noted the presence of several “nebulous objects” in the night sky. Having originally mistaken them for comets, he began compiling a list of these objects so that other astronomers wouldn’t make the same mistake. Consisting of 100 objects, the Messier Catalog has come to be viewed as a major milestone in the study of Deep Space Objects.

One of these objects is Messier 25, an open star cluster located in the direction of the Sagittarius Constellation. At  a distance of about 2000 light years from Earth, it is one of the few Messier Objects that is visible to the naked eye (on a clear night when light conditions are favorable).

Description:

This galactic star cluster was originally discovered by Philippe Loys de Cheseaux in 1745 and included in Charles Messier’s catalog in 1764. Oddly enough, it was one of those curious objects that didn’t get cataloged by Sir John Herschel – therefore it never received a New General Catalog (NGC) number.

This is odd, considering that it was part of the 1777 catalog of Johann Elert Bode, observed by William Herschel in 1783, written about by Admiral Smyth in 1836 and even commented on by the Reverend Thomas William Webb in 1859! It was until J.L.E. Dreyer in 1908 that poor little M25 ended up getting added to the second Index Catalog.

Messier 25. Atlas Image mosaic obtained as part of the Two Micron All Sky Survey (2MASS), a joint project of the University of Massachusetts and the Infrared Processing and Analysis Center/California Institute of Technology, funded by the National Aeronautics and Space Administration and the National Science Foundation.
Atlas Image mosaic of Messier 25,obtained as part of the Two Micron All Sky Survey (2MASS). Credit: Univ. of Mass./IPAC/Caltech/NASA/NSF

Cruising along peacefully about 2,000 light-years away from Earth, this little group of stars spans across about 19 light years of space. Caught inside of its influence are four giant stars – two of spectral type M and two of type G. As we know, it contains the variable star U Sagittarii, a Delta Cephei-type, which lets us know this group of 86 or so stars may have began life together as long ago as 90 million years.

But how many stars are really in there? If you’re using a large aperture telescope, you’re probably detecting the signature of several just beyond the threshold limits. And so has more recent scientific studies. According to a study by A.L. Tadross (et al.) of the National Research Institute of Astronomy and Geophysics:

“The young open star cluster M25 (IC 4725) is located in the direction of the galactic center in a crowded region, near much irregular absorption features on Sagittarius arm. This cluster has some difficult observing problems due to its southern location. The mass data available in the literature have been gathered to re investigate this cluster using most photometric tools to determine its main photometric parameters. More than 220 stars with mean reddening of 0.50 mag and absorption of 1.62 mag are found within the cluster.”

Core region of the Messier 25 open star cluster. Credit: Sergio Eguivar

And how many of those stars are surprises? Let’s try a few blue straggler stars. According to a study titled “Blue Stragglers, Be stars and X-ray binaries in open clusters“, by A. Marco (et al):

“Combination of high-precision photometry and spectroscopy allows the detailed study of the upper main sequence in open clusters. We are carrying out a comprehensive study of a number of clusters containing Be stars in order to evaluate the likelihood that a significant number of Be stars form through mass exchange in a binary. Our first results show that most young open clusters contain blue stragglers. In spite of the small number of clusters so far analyzed, some trends are beginning to emerge.In younger open clusters, such as NGC 869 and NGC 663, there are many blue stragglers, most of which are not Be stars. In older clusters, such as IC 4725, the fraction of Be stars among blue stragglers is very high. Two Be blue stragglers are moderately strong X-ray sources, one of them being a confirmed X-ray binaries. Such objects must have formed through binary evolution. We discuss the contribution of mass transfer in a close binary to the formation of both blue stragglers and Be stars.”

History of Observation:

Perhaps we know more about it today than our historic antecedents, but our knowledge of its existence is owed to astronomers like Charles Messier, who took the time to catalog it. As he wrote in his notes:

“In the same night, June 20 to 21, 1764, I have determined the position of another star cluster in the vicinity of the two preceding, between the head and the extremity of the bow of Sagittarius, and almost on the same parallel as the two others: the closest known star is that of the sixth magnitude, the twenty-first of Sagittarius, in the catalog of Flamsteed: this cluster is composed of small stars which one sees with difficulty with an ordinary refractor of 3 feet: it doesn’t contain any nebulosity, and its extension may be 10 minutes of arc. I have determined its position by comparing with the star Mu Sagittarii; its right ascension has been found at 274d 25′, and its declination at 19d 5′ south.”

Finder Chart for M25 (also shown M8->M9, M16->M18, M20->M24 and M28). Credit: freestarcharts

Perhaps William Herschel understood there was more there to be seen, for he commented in his unpublished notes; “Very large, bright, stars and some small, faint ones; I counted 70, and there are many more within no considerable extent.”

Yet, it was Admiral Smyth who really understood what lay beyond. From his observations, he wrote:

“A loose cluster of large and small stars in the Galaxy, between the Archer’s head and Sobieski’s shield; of which a pair og 8th magnitudes, the principle of a set something in the form of a jew’s harp, are above registered. The gathering portion of the group assumes an arched form, and is thickly strewn in the south, on the upper part, where a pretty knot of minute glimmers occupies the center, with much star-dust around. It was discovered in 1764 by Messier, and estimated by him at 10′ in extent: it is 5 deg to the north-east of Mu Sagittarii, and nearly on the parallel of Beta Scorpii, which glimmers far away in the west.”

Locating Messier 25:

Finding Messier 25 with binoculars is quite easy. Simply start at the teapot “lid” star, Lambda, and aim about a fist width almost due north. Here you will encounter a a Cepheid variable – U Sagittarii. This one is a quick change artist, going from magnitude 6.3 to 7.1 in less than seven days, so although it is a cluster member, it may fade on you from time to time as a marker star!

The location of Messier 25. Credit: IAU/Sky & Telescope magazine (Roger Sinnott & Rick Fienberg)
Location of Messier 25 and other Deep Sky Objects in proximity to the Sagittarius Constellation. Credit: IAU/Sky & Telescope magazine (Roger Sinnott & Rick Fienberg)

M25 will appear a a loose, but bright association of stars in binoculars and as a faint hazy spot in binoculars – but behold incredible resolution in a telescope. You’ll love the different magnitudes, so stick to around low to medium magnifications to enjoy it most.

As always, here are the quick facts. Enjoy!

Object Name: Messier 25
Alternative Designations: M25, IC 4725
Object Type: Open Galactic Star Cluster
Constellation: Sagittarius
Right Ascension: 18 : 31.6 (h:m)
Declination: -19 : 15 (deg:m)
Distance: 2.0 (kly)
Visual Brightness: 4.6 (mag)
Apparent Dimension: 32.0 (arc min)

We have written many interesting articles about Messier Objects here at Universe Today. Here’s Tammy Plotner’s Introduction to the Messier Objects, , M1 – The Crab Nebula, M8 – The Lagoon Nebula, and David Dickison’s articles on the 2013 and 2014 Messier Marathons.

Be to sure to check out our complete Messier Catalog. And for more information, check out the SEDS Messier Database.

Sources:

What is the Mars Curse?

What is the Mars Curse?


Last week, ESA’s Schiaparelli lander smashed onto the surface of Mars. Apparently its descent thrusters shut off early, and instead of gently landing on the surface, it hit hard, going 300 km/h, creating a 15-meter crater on the surface of Mars.

Fortunately, the orbiter part of ExoMars mission made it safely to Mars, and will now start gathering data about the presence of methane in the Martian atmosphere. If everything goes well, this might give us compelling evidence there’s active life on Mars, right now.

It’s a shame that the lander portion of the mission crashed on the surface of Mars, but it’s certainly not surprising. In fact, so many spacecraft have gone to the galactic graveyard trying to reach Mars that normally rational scientists turn downright superstitious about the place. They call it the Mars Curse, or the Great Galactic Ghoul.

Mars eats spacecraft for breakfast. It’s not picky. It’ll eat orbiters, landers, even gentle and harmless flybys. Sometimes it kills them before they’ve even left Earth orbit.

NASA’s Mars Atmosphere and Volatile EvolutioN (MAVEN) spacecraft celebrated one Earth year in orbit around Mars on Sept. 21, 2015. MAVEN was launched to Mars on Nov. 18, 2013 from Cape Canaveral Air Force Station in Florida and successfully entered Mars’ orbit on Sept. 21, 2014. Credit: NASA

At the time I’m writing this article in late October, 2016, Earthlings have sent a total of 55 robotic missions to Mars. Did you realize we’ve tried to hurl that much computing metal towards the Red Planet? 11 flybys, 23 orbiters, 15 landers and 6 rovers.

How’s our average? Terrible. Of all these spacecraft, only 53% have arrived safe and sound at Mars, to carry out their scientific mission. Half of all missions have failed.

Let me give you a bunch of examples.

In the early 1960s, the Soviets tried to capture the space exploration high ground to send missions to Mars. They started with the Mars 1M probes. They tried launching two of them in 1960, but neither even made it to space. Another in 1962 was destroyed too.

They got close with Mars 1 in 1962, but it failed before it reached the planet, and Mars 2MV didn’t even leave the Earth’s orbit.

Five failures, one after the other, that must have been heartbreaking. Then the Americans took a crack at it with Mariner 3, but it didn’t get into the right trajectory to reach Mars.

Mariner IV encounter with Mars. Image credit: NASA/JPL

Finally, in 1964 the first attempt to reach Mars was successful with Mariner 4. We got a handful of blurry images from a brief flyby.

For the next decade, both the Soviets and Americans threw all kinds of hapless robots on a collision course with Mars, both orbiters and landers. There were a few successes, like Mariner 6 and 7, and Mariner 9 which went into orbit for the first time in 1971. But mostly, it was failure. The Soviets suffered 10 missions that either partially or fully failed. There were a couple of orbiters that made it safely to the Red Planet, but their lander payloads were destroyed. That sounds familiar.

Now, don’t feel too bad about the Soviets. While they were struggling to get to Mars, they were having wild success with their Venera program, orbiting and eventually landing on the surface of Venus. They even sent a few pictures back.

Finally, the Americans saw their greatest success in Mars exploration: the Viking Missions. Viking 1 and Viking 2 both consisted of an orbiter/lander combination, and both spacecraft were a complete success.

View of Mars from Viking 2 lander, September 1976. (NASA/JPL-Caltech)

Was the Mars Curse over? Not even a little bit. During the 1990s, the Russians lost a mission, the Japanese lost a mission, and the Americans lost 3, including the Mars Observer, Mars Climate Orbiter and the Mars Polar Lander.

There were some great successes, though, like the Mars Global Surveyor and the Mars Pathfinder. You know, the one with the Sojourner Rover that’s going to save Mark Watney?

The 2000s have been good. Every single American mission has been successful, including Spirit and Opportunity, Curiosity, the Mars Reconnaissance Orbiter, and others.

But the Mars Curse just won’t leave the Europeans alone. It consumed the Russian Fobos-Grunt mission, the Beagle 2 Lander, and now, poor Schiaparelli. Of the 20 missions to Mars sent by European countries, only 4 have had partial successes, with their orbiters surviving, while their landers or rovers were smashed.

Is there something to this curse? Is there a Galactic Ghoul at Mars waiting to consume any spacecraft that dare to venture in its direction?

ExoMars 2016 lifted off on a Proton-M rocket from Baikonur, Kazakhstan at 09:31 GMT on 14 March 2016. Copyright ESA–Stephane Corvaja, 2016

Flying to Mars is tricky business, and it starts with just getting off Earth. The escape velocity you need to get into low-Earth orbit is about 7.8 km/s. But if you want to go straight to Mars, you need to be going 11.3 km/s. Which means you might want a bigger rocket, more fuel, going faster, with more stages. It’s a more complicated and dangerous affair.

Your spacecraft needs to spend many months in interplanetary space, exposed to the solar winds and cosmic radiation.

Arriving at Mars is harder too. The atmosphere is very thin for aerobraking. If you’re looking to go into orbit, you need to get the trajectory exactly right or crash onto the planet or skip off and out into deep space.

And if you’re actually trying to land on Mars, it’s incredibly difficult. The atmosphere isn’t thin enough to use heatshields and parachutes like you can on Earth. And it’s too thick to let you just land with retro-rockets like they did on the Moon.

Schiaparelli lander descent sequence. Image: ESA/ATG medialab
Schiaparelli lander’s planned descent sequence. Image: ESA/ATG medialab

Landers need a combination of retro-rockets, parachutes, aerobraking and even airbags to make the landing. If any one of these systems fails, the spacecraft is destroyed, just like Schiaparelli.

If I was in charge of planning a human mission to Mars, I would never forget that half of all spacecraft ever sent to the Red Planet failed. The Galactic Ghoul has never tasted human flesh before. Let’s put off that first meal for as long as we can.

What is a Waxing Moon?

The waxing gibbous Moon closes in on Aldebaran (lower left). Image credit and copyright: Sarah & Simon Fisher

As you’ve probably noticed, the Moon looks different from one evening to the next. Sometimes we see a New Moon, when the Moon is enshrouded in shadow. At other times, we see a Full Moon, when the entire face of the Moon is illuminated. And of course, there are the many phases in between, where portions of the Moon are illuminated.

This is what is called a Lunar Cycle, a 29 ½-day period (aka. lunar month) where the Moon becomes brighter and dimmer, depending on its orientation with the Earth and the Sun. During the first half of a lunar month, when the amount of illumination on the Moon is increasing, astronomers call this a “waxing moon”.

Lunar Cycle:

To understand the Lunar Cycle, we first must consider the Moon’s orbit in relation to Earth. Basically, the Moon orbits Earth, and Earth orbits the Sun, which means the Moon is always half illuminated by the latter. But from our perspective here on Earth, which part of the Moon is illuminated – and how much – changes over time.

When the Sun, the Moon and Earth are perfectly lined up, the angle between the Sun and the Moon is 0-degrees. At this point, the side of the Moon facing the Sun is fully illuminated, and the side facing the Earth is enshrouded in darkness. We call this a New Moon.

After this, the phase of the Moon changes, because the angle between the Moon and the Sun is increasing from our perspective. A week after a New Moon, and the Moon and Sun are separated by 90-degrees, which effects what we will see. And then, when the Moon and Sun are on opposite sides of the Earth, they’re at 180-degrees – which corresponds to a Full Moon.

Waxing vs. Waning:

The period in which a Moon will go from a New Moon to a Full Moon and back again is known as “Lunar Month”. One of these lasts 28 days, and encompasses what are known as “waxing” and “waning” Moons. During the former period, the Moon brightens and its angle relative to the Sun and Earth increases.

A waxing gibbous Moon from October 12th, headed towards Full this weekend. Image credit and copyright: John Brimacombe.

When the Moon is in between the Earth and the Sun, the side of the Moon facing away from the Earth is fully illuminated, and the side we can see is shrouded in darkness. As the Moon orbits the Earth, the angle between the Moon and the Sun increases. At this point, the angle between the Moon and Sun is 0 degrees, which gradually increases over the next two weeks. This is what astronomers call a waxing moon.

After the first week, the angle between the Moon and the Sun is 90-degrees and continues to increase to 180-degrees, when the Sun and Moon are on opposite sides of the Earth. When the Moon starts to decrease its angle again, going from 180-degrees back down to 0-degrees, astronomers say that it’s a waning moon. In other words, when the Moon is waning, it will have less and less illumination every night until it’s a New Moon.

Waxing Phases:

The period when the Moon is waxing occurs between a New Moon and a Full Moon, which is characterized by many changes in appearance. The first is known as a Waxing crescent, where 1-49% of the Moon is illuminated. Which side appears illuminated will depend on the observer’s location. For those living in the northern hemisphere, the right side will appear illuminated; whereas for those in the southern hemisphere, the reverse is the case.

Next up is the First Quarter, where 50% of the Moon’s face is illuminated – again, the right side for those in the northern hemisphere and the left for those in the south. This is followed by a Waxing Gibbous Moon, where 51 – 99% of the Moon’s surface is illuminated – right side in the northern hemisphere, left side in the southern. The waxing phase concludes with a Full Moon.

We have written many articles about the Moon here at Universe Today. Here’s What are the Phases of the Moon?, What is a Waning Moon?, What is a Hunter’s Moon?, A Red Moon – Not a Sign of the Apocalypse!, How Did the Moon Form? and What is the Distance to the Moon?

NASA has a cool list of all the Moon phases over the course of 6000 years. And here’s a calculator that shows the current phase of the Moon.

You can listen to a very interesting podcast about the formation of the Moon from Astronomy Cast, Episode 17: Where Did the Moon Come From?

Sources:

Can We Get Space Madness?

If you’ve watched any Ren and Stimpy cartoons, you know that one of the greatest hazards of spaceflight is “space madness”. Only exposure to the isolation and all pervasive radiation of deep space could drive an animated chihuahua into such a state of lunacy.

What will happen if they press the history eraser button? Maybe something good? Maybe something bad? I guess, we’ll never know.

Of course, Ren and Stimpy weren’t the first fictionalized account of people losing their marbles when they fly into the inky darkness of space. There were the Reavers from Firefly, that crazy Russian cosmonaut in Armageddon, almost everyone in the movie Sunshine, and it was the problem in every second episode of Star Trek.

The Icarus Pathfinder starship passing by Neptune. Credit: Adrian Mann

According to movies and television, if you’ve got space madness, you and your crewmates are in for a rough ride. If you’re lucky, you merely hallucinate those familiar space sirens, begging you to take off your space helmet and join them for eternity on that asteroid over there.

But you’re just as likely to go homicidal, turning on your crewmates, killing them one by one as a dark sacrifice to the black hole that powers your ship’s stardrive.  And whatever you do, don’t stare too long at that pulsar, with its hypnotic, rhythmic pulse. The isolation, the alien psycho-waves, dark whisperings from eldritch gods speak to you though the paper-thin membrane of sanity. If we go to space, does only madness await us?

If you’ve spent any time around human beings, you know that we’ve got our share of mental disease right here on Earth. You don’t have to travel to space to suffer depression, anxiety, and other mental disorders.

Once we’re in orbit, or prancing about on the surface, of Mars, we’re going to experience our share of human physical and mental frailties. We’re going to take our basic humanity to space, including our brains.

According to the National Institute of Mental Health, 18% of the US population, or 40 million Americans suffer from some variety of anxiety-related disorder. 6.7% of adults had a major, crippling depressive episode over the course of a year.

Unless we improve treatment outcomes for mental disorders here on Earth, we can expect to see similar outcomes in space. Especially once we make exploration a little safer, and we’re not concerned with our immediate exposure to the vacuum of space. But will going to space make things worse?

Outside view of the Mir space station. Credit: NASA

NASA has carried out two studies on astronaut psychological health studies. One for the cosmonauts and astronauts on the Mir space station, and a second study for the folks on the International Space Station. They tested both the folks in space as well as their ground support staff once a week, to see how they were doing.

Although they reported some tension, there was no loss in mood or group cohesion during the mission. The crews had better cohesion when they had an effective leader on board.

Isolation working in close quarters has been heavily studied here on Earth, with submarine crews and isolated groups at research bases in Antarctica.

United States members of the second HI-SEAS (Hawaii Space Exploration Analog and Simulation) crew celebrate Independence Day during their simulated 120-day Mars mission. Credit: Casey Stedman/Instagram
A previous HI-SEAS simulated Mars mission. This one was only for 120 days. Credit: Casey Stedman/Instagram

Earlier this year, a crew of simulated Mars astronauts emerged, unharmed from a year-long isolation experiment in Hawaii. The six international crewmembers were part of the Hawaii Space Exploration Analog and Simulation experiment, to see what would happen to potential Mars explorers, stuff on the surface of the red planet for a year.

They couldn’t leave their 110 square-meter (1,200 square-foot) habitat without a spacesuit on. What did they report? Mostly boredom. Some interpersonal issues. Now that they’re out, some are good friends, and others probably won’t stay in contact, or pay too much attention to them in their Facebook feed.

The bottom line is that it doesn’t seem like there’s too much of a risk from the isolation and close quarters. Well, nothing that we’re not used to dealing with as human beings.

But there is another problem that has revealed itself, and might be much more severe: space dementia. And we’re not talking about the song from Muse.

According to researchers from the University of California, Irvine, long term exposure to the radiation of deep space will cause significant damage to our fragile human brains. Or at least, that’s what happened to a group of rats bathed in radiation at the NASA Space Radiation Laboratory at New York’s Brookhaven National Laboratory.

Over time, the damage to their brains would cause astronauts to experience a type of dementia that causes anxiety. Brain cancer patients who receive radiation treatment are prone to this as well.

Artist's concept of a habitat for a Mars colony. Credit: NASA
Artist’s concept of a habitat for a Mars colony. Credit: NASA

During the months and years of a Mars mission, astronauts would take a large dose of radiation, even with shielding, and the effects would be harmful to their bodies and to their brains. In fact, even when the astronauts return to Earth, their condition might worsen, with more anxiety, depression, memory problems, and a loss of decision making ability. This is a serious problem that needs to be solved if humans are going to live for a long time outside the Earth’s protective magnetosphere.

It turns out, science fiction space madness isn’t a real thing, it’s a plot device like warp drives, teleporters, and light sabers.

Isolation and close proximity isn’t much of a problem, we’ve dealt with it before, and we can still work with people, even though we hate them and the way they slurp their coffee, and lean back on their chair, even though that thing is totally going to break and they’re going to hurt themselves. And they won’t stop doing it, no matter how many times we ask them to stop.

Once again, radiation in space is a big problem. It’s out there, it’s everywhere, and we don’t have a great way to protect against it. Especially when it wrecks our brains.