I’ve got to say, you are one of the luckiest people I’ve ever met.
For starters, you are the descendant of an incomprehensible number of lifeforms who were successful, and survived long enough to find a partner, procreate, and have an offspring. Billions of years, and you are the result of an unbroken chain of success, surviving through global catastrophe after catastrophe. Nice going.
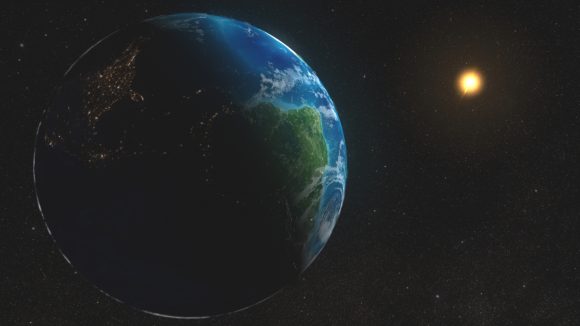
Not only that, but your lineage happened to be born on a planet, which was in just the right location around just the right kind of star. Not too hot, not too cold, just the right temperature where liquid water, and whatever else was necessary for life to get going. Again, I like your lucky streak.
Yup, you are pretty lucky to call this place home. Credit: NASA
In fact, you happened to be born into a Universe that has the right physical constants, like the force of gravity or the binding force of atoms, so that stars, planets and even the chemistry of life could happen at all.
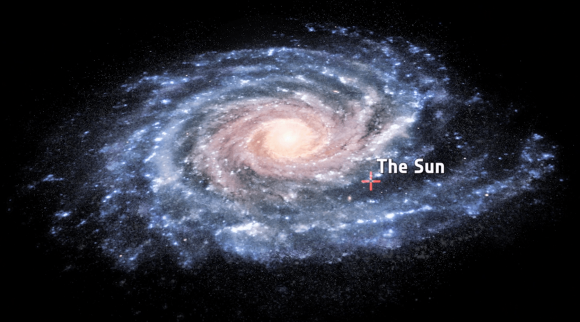
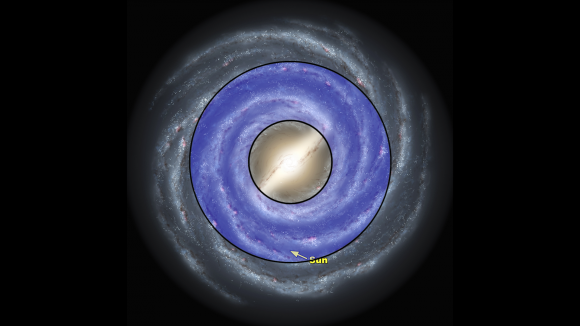
But there’s another lottery you won, and you probably didn’t even know about it. You happened to be born on an unassuming, mostly harmless planet orbiting a G-type main sequence star in the habitable zone of the Milky Way.
Wait a second, even galaxies have habitable zones? Yep, and you’re in it right now.
The Milky Way is a big place, measuring up to 180,000 light years across. It contains 100 to 400 billion stars spread across this enormous volume.
We’re located about 27,000 light years away from the center of the Milky Way, and tens of thousands of light-years away from the outer rim.
Credit: ESA
The Milky Way has some really uninhabitable zones. Down near the center of the galaxy, the density of stars is much greater. And these stars are blasting out a combined radiation that would make it much more unlikely for life to evolve.
Radiation is bad for life. But it gets worse. There’s a huge cloud of comets around the Sun known as the Oort Cloud. Some of the greatest catastrophes in history happened when these comets were kicked into a collision course with the Earth by a passing star. Closer to the galactic core, these disruptions would happen much more often.
There’s another dangerous place you don’t want to be: the galaxy’s spiral arms. These are regions of increased density in the galaxy, where star formation is much more common. And newly forming stars blast out dangerous radiation.
Fortunately, we’re far away from the spiral arms, and we orbit the center of the Milky Way in a nice circular orbit, which means we don’t cross these spiral arms very often.
We stay nice and far away from the dangerous parts of the Milky Way, however, we’re still close enough to the action that our Solar System gathered the elements we needed for life.
The first stars in the Universe only had hydrogen, helium and a few other trace elements left over from the Big Bang. But when the largest stars detonated as supernovae, they seeded the surrounding regions with heavier elements like oxygen, carbon, even iron and gold.
Early stars were made almost entirely of hydrogen and helium. Credit: NASA/WMAP Science Team
Our solar nebula was seeded with the heavy elements from many generations of stars, giving us all the raw materials to help set evolution in motion.
If the Solar System was further out, we probably wouldn’t have gotten enough of those heavier elements. So, thanks multiple generations of dead stars.
According to astrobiologists the galactic habitable zone probably starts just outside the galactic bulge – about 13,000 light-years from the center, and ends about halfway out in the disk, 33,000 light-years from the center.
Remember, we’re 27,000 light-years from the center, so just inside that outer edge. Phew.
The Milky Way’s habitable zone. Credit: NASA/Caltech
Of course, not all astronomers believe in this Rare Earth hypothesis. In fact, just as we’re finding life on Earth wherever we find water, they believe that life is more robust and resilient. It could still survive and even thrive with more radiation, and less heavier elements.
Furthermore, we’re learning that solar systems might be able to migrate a significant distance from where they formed. Stars that started closer in where there were plenty of heavier elements might have drifted outward to the safer, calmer galactic suburbs, giving life a better chance at getting a foothold.
As always, we’ll need more data, more research to get an answer to this question.
Just when you thought you were already lucky, it turns out you were super duper extra lucky. Right Universe, right lineage, right solar system, right location in the Milky Way. You already won the greatest lottery in existence.
A tornado near Anadarko, Oklahoma. Credit: NSSL/NOAA
Tornadoes are a fascinating force of nature, as awe-inspiring as they are destructive. They form periodically due to the convergence of weather patterns, and often leave plenty of devastation in their wake. And for those who live in the active tornado regions of the world, they are an unfortunate fact of life.
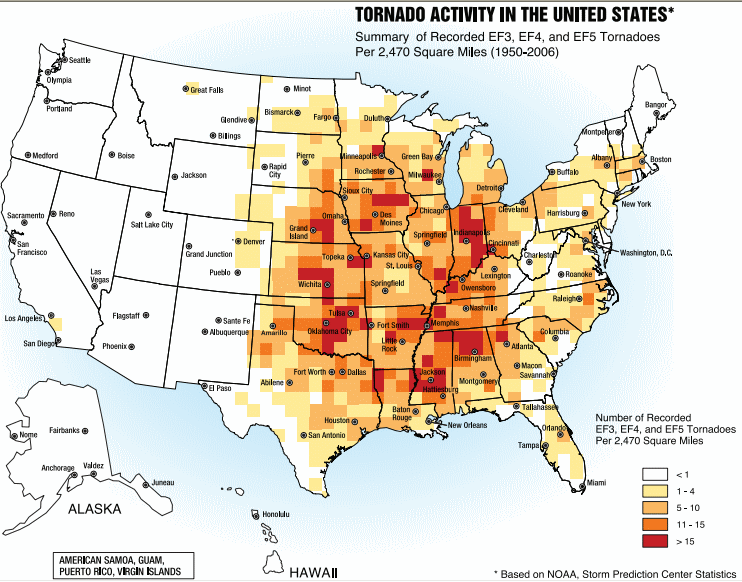
Such is the nature of life for those who live in the infamous “Tornado Alley”, a region that extends from the southern US into parts of Canada. This area is so-named because of the frequency with which tornadoes take place. Compared to other active regions of the world, this area experiences the highest frequency of violent tornadoes.
Origin of the Name:
The term “Tornado Alley” was first used in 1952 as the title of a research project about severe weather in the US. This project was conducted by U.S. Air Force meteorologists Maj. Ernest J. Fawbush and Capt. Robert C. Miller, and covered a region extending from areas of Texas to locations throughout the mid-western US.
Tornado at Union City, Oklahoma. Credit: NOAA Photo Library
The term has since caught on thanks to media sources as well meteorologist and climatologists, though many use the term “Great Plains Tornado Belt” as well.
Geographical Area:
The geographical boundaries of “Tornado Alley” have never been very clearly defined and no official definition has been adopted by the National Weather Service (NWS). As a result, different definitions and boundaries have been adopted based on different sets of criteria. For instance, the National Severe Storms Laboratory (NSSL) states:
“‘Tornado Alley’ is just a nickname made up by the media for an area of relatively high tornado occurrence; it is not a clearly defined area. Is tornado alley the area with the most violent tornadoes, or is it the area with the most tornado-related deaths, or the highest frequency or tornadoes? It depends on what kind of information you want!”
While no region of the US is entirely free of tornadoes, they occur more frequently in the mid-western US – spanning areas of Texas to parts of Oklahoma, Kansas, South Dakota, Iowa, Illinois, Missouri, New Mexico, Colorado, North Dakota, and Minnesota.
Artist’s impression of the geographical region known as “Tornado Alley”. Credit: Dan Craggs/Wikipedia Commons
Texas reports the most tornadoes of any state, whereas Kansas and Oklahoma rank first and second respectively in the number of tornadoes per area. Florida also reports a high number and density of tornado occurrences, though tornadoes there rarely reach the strength of those that sometimes occur in the southern plains.
However, the Canadian prairies, eastern Colorado and western Pennsylvania are often included in the boundaries. And last, several smaller areas have been designated as being their own “Tornado Alley” – which include the Texas/Oklahoma/Kansas core, the Upper Midwest, the lower Ohio Valley, the Tennessee Valley and the lower Mississippi valley.
There is also the term “Dixie Alley”, a name coined by Allen Peasons, a former director of the National Severe Storms Forecasting Center (NSSFC), in 1971. This name refers to the lower Mississippi Valley and upper Tennessee Valley were tornadoes occur frequently.
Nevertheless, most definitions focus on the geographical region known as the Great Plains where no major mountain ranges are located. This is important because mountains act as breaks on weather systems, forcing them to dump the majority of their moisture before crossing over them (the reason why the southwestern US has a more arid climate).
Image from Federal Emergency Management Agency booklet, “Taking Shelter from the Storm: Building a Safe Room Inside your House” (3rd ed.). Credit: FEMA
In the case of the Great Plains, the region’s lack of these natural barriers leaves it open to cold fronts from Canada and warm fronts from Mexico and the Gulf Coast. When cold and warm front collide, they create supercells and thunderstorm systems that lead to tornadoes.
Impact:
Due to the frequency of tornadoes in certain areas of the United States, building codes and warning systems have been implemented. These include the institution of special building codes, construction of storm cellars, sirens, preparedness drills, education programs, and regular weather coverage by local media outlets.
According to the National Climatic Data Center, during the period of 1991 to 2010, those states that have the most experienced an average of 5.7 (Minnesota) to 12.2 (Florida) tornadoes. Using a long-term average (based on data collected between 1950 and 2012), the entire “Alley” experiences about 268 tornadoes per year.
In the southeastern United States, where housing is less robust and many people live in mobile homes, causalities are particularly high. According to the NOAA, almost 3600 tornadoes have occurred in the United States, which resulted in more than 20,000 deaths, between 1680 and 2000.
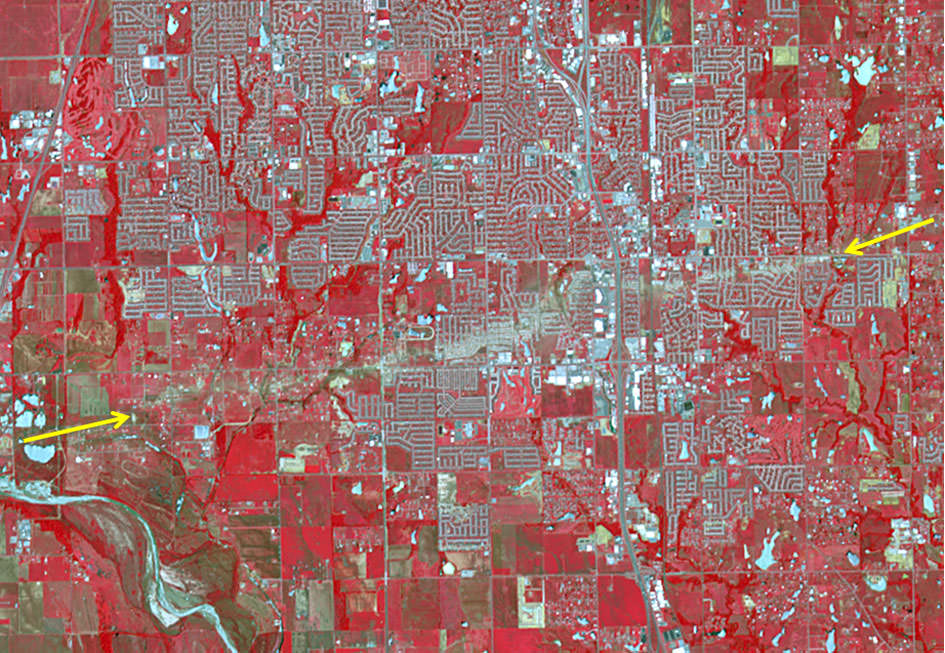
The track of the tornado that struck Moore, Oklahoma on May 20, 2013 is visible from space in this false color image taken on June 2, 2013 by the Advanced Spaceborne Thermal Emission and Reflection Radiometer (ASTER) on NASA’s Terra satellite.
Meanwhile, data from the Tornado History Project shows there were 5,587 confirmed fatalities blamed on tornadoes across the United States between 1950 and 2012. Of those, 1,110 occurred in Tornado Alley. The injuries caused by tornadoes are much higher, with a reported 64,054 injuries being attributed to tornadoes during the same period – over 15,000 of which occurred in Tornado Alley.
The worst year on record was 2011, when tornado activity spiked leading to 1,704 confirmed tornadoes and 553 confirmed deaths. This includes the 158 deaths that resulted from the tornado that struck Joplin, Missouri, on May 22nd, which was also the deadliest since modern record-keeping began in 1950.
In financial terms, the cost of tornadoes is also quite high. In fact, the Insurance Information Institute reports that between 1993 and 2012, the average insured loss per year was $7.78 billion for severe thunderstorm events, including tornadoes. In 2011, during the spike in storms, an estimated $27 billion was filed for in insurance claims.
No matter how you slice it, living in regions where tornadoes are known to frequent is both a dangerous and expensive prospect. As our understanding of tornadoes grows, we are able to predict where they will form and what paths they will take with greater accuracy. As such, we can reduce the cost in human and monetary terms over time.
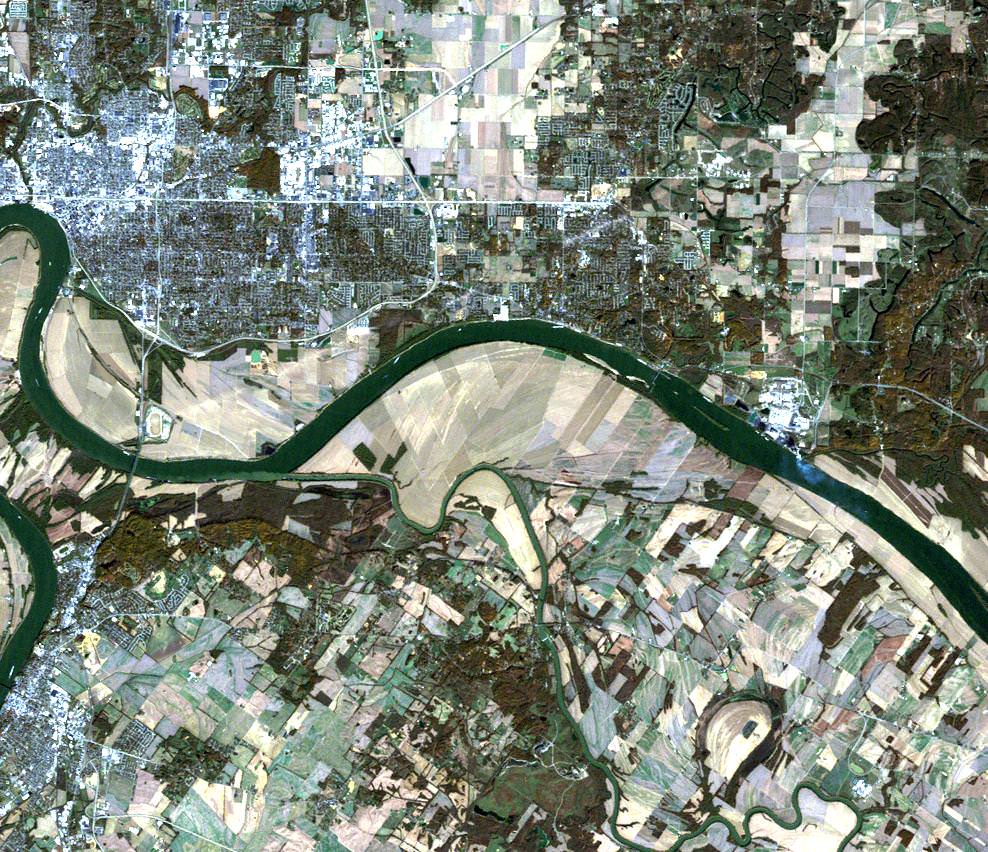
Satellite image showing the after-effects of the deadly tornado that ripped through Indiana and Kentucky. Credit: NASA Landsat Project Science Office and USGS EROS
But in the long run, the greatest safeguards against injuries and death are public awareness and education. Tornadoes are also an important aspect of Climate Change, since changes in our environment are likely to effect and exacerbate extreme weather patterns.
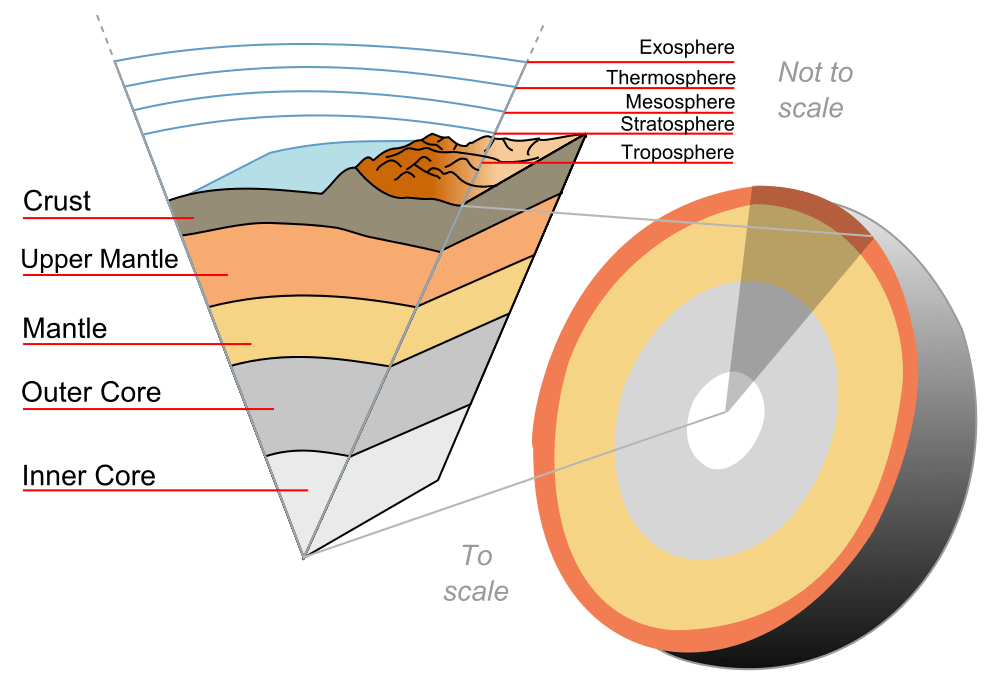
The Earth's layers, showing the Inner and Outer Core, the Mantle, and Crust. Credit: discovermagazine.com
As you may recall learning in geology class, the Earth is made up of distinct layers. The further one goes towards the center of the planet, the more intense the heat and pressure becomes. Luckily, for those of us living on the crust (the outermost layer, where all life lives) the temperature is relatively steady and pleasant.
In fact, one of the things that makes planet Earth habitable is the fact that the planet is close enough to our Sun to receive enough energy to stay warm. What’s more, its “surface temperatures” are warm enough to sustain liquid water, the key to life as we know it. But the temperature of Earth’s crust also varies considerably depending on where and when you are measuring it.
Earth’s Structure:
As a terrestrial planet, Earth is composed of silicate rocks and metals which are differentiated between a solid metal core, a molten outer core, and a silicate mantle and crust. The inner core has an estimated radius of 1,220 km, while the outer core extends beyond it to a radius of about 3,400 km.
The layers of the Earth, a differentiated planetary body. Credit: Wikipedia Commons/Surachit
Extending outwards from the core are the mantle and the crust. Earth’s mantle extends to a depth of 2,890 km beneath the surface, making it the thickest layer of Earth. This layer is composed of silicate rocks that are rich in iron and magnesium relative to the overlying crust. Although solid, the high temperatures within the mantle cause the silicate material to be sufficiently ductile that it can flow on very long timescales.
The upper layer of the mantle is divided into the lithospheric mantle (aka. the lithosphere) and the asthenosphere. The former consists of the crust and the cold, rigid, top part of the upper mantle (which the tectonic plates are composed of) while the asthenosphere is the relatively low-viscosity layer on which the lithosphere rides.
Earth’s Crust:
The crust is the absolute outermost layer of the Earth, which constitutes just 1% of the Earth’s total mass. The thickness of the crust varies depending on where the measurements are taken, ranging from 30 km thick where there are continents to just 5 km thick beneath the oceans.
The crust is composed of a variety of igneous, metamorphic and sedimentary rocks and is arranged in a series of tectonic plates. These plates float above the Earth’s mantle, and it’s believed that convection in the mantle causes the plates to be in constant motion.
Sometimes these plates collide, pull apart, or slide alongside each other; resulting in convergent boundaries, divergent boundaries, and transform boundaries. In the case of convergent boundaries, subduction zones are often the result, where the heavier plate slips under the lighter plate – forming a deep trench.
In the case of divergent boundaries, these are formed when tectonic plates pull apart, forming rift valleys on the seafloor. When this happens, magma wells up in the rift as the old crust pulls itself in opposite directions, where it is cooled by seawater to form new crust.
A transform boundary is formed when tectonic plates slide horizontally and parts get stuck at points of contact. Stress builds in these areas as the rest of the plates continue to move, which causes the rock to break or slip, suddenly lurching the plates forward and causing earthquakes. These areas of breakage or slippage are called faults.
Illustration of the Earth’s Tectonic Plates and the plate boundaries. Credit: msnucleus.org
Taken together, these three types of tectonic plate action are what is responsible for shaping the Earth’s crust and leading to periodic renewal of its surface over the course of millions of years.
Temperature Range:
The temperature of the Earth’s crust ranges considerably. At its outer edge, where it meets the atmosphere, the crust’s temperature is the same temperature as that of the air. So, it might be as hot as 35 °C in the desert and below freezing in Antarctica. On average, the surface of the Earth’s crust experiences temperatures of about 14°C.
However, the hottest temperature ever recorded was 70.7°C (159°F), which was taken in the Lut Desert of Iran as part of a global temperature survey conducted by scientists at NASA’s Earth Observatory. Meanwhile, the coldest temperature ever recorded on Earth was measured at the Soviet Vostok Station on the Antarctic Plateau – which reached an historic low of -89.2°C (-129°F) on July 21st, 1983.
That’s quite the range already. But consider the fact that the majority of the Earth’s crust lies beneath the oceans. Far from the Sun, temperatures can reach as low as 0-3° C (32-37.5° F) where the water reaches the crust. Still, a lot balmier than a cold night in Antarctica!
And as geologists have known for some time, if you dig down into the continental crust, temperatures will go up. For example, the deepest mine in the world is currently the TauTona gold mine in South Africa, measuring 3.9 km deep. At the bottom of the mine, temperatures reach a sweltering 55 °C, which requires that air conditioning be provided so that it’s comfortable for the miners to work all day.
So in the end, the temperature of Earth’s crust varies considerably. It’s average surface temperature which depends on whether it is being taken on dry land or beneath the sea. And depending on the location, seasons, and time of day, it can range from sweltering to freezing cold!
And yet, Earth’s crust remains the only place in the Solar System where temperatures are stable enough that life can continue to thrive on it. Add to that our viable atmosphere and protective magnetosphere, and we really should consider ourselves to be the lucky ones!
Volcanoes are an impressive force of nature. Physically, they dominate the landscape, and have an active role in shaping our planet’s geography. When they are actively erupting, they are an extremely dangerous and destructive force. But when they are passive, the soil they enrich can become very fertile, leading to settlements and cities being built nearby.
Such is the nature of volcanoes, and is the reason why we distinguish between those that are “active” and those that are “dormant”. But what exactly is the differences between the two, and how do geologists tell? This is actually a complicated question, because there’s no way to know for sure if a volcano is all done erupting, or if it’s going to become active again.
Put simply, the most popular way for classifying volcanoes comes down to the frequency of their eruption. Those that erupt regularly are called active, while those that have erupted in historical times but are now quiet are called dormant (or inactive). But in the end, knowing the difference all comes down to timing!
Sarychev volcano, (located in Russia’s Kuril Islands, northeast of Japan) in an early stage of eruption on June 12, 2009. Credit: NASA
Active Volcano:
Currently, there is no consensus among volcanologists about what constitutes “active”. Volcanoes – like all geological features – can have very long lifespans, varying between months to even millions of years. In the past few thousand years, many of Earth’s volcanoes have erupted many times over, but currently show no signs of impending eruption.
As such, the term “active” can mean only active in terms of human lifespans, which are entirely different from the lifespans of volcanoes. Hence why scientists often consider a volcano to be active only if it is showing signs of unrest (i.e. unusual earthquake activity or significant new gas emissions) that mean it is about to erupt.
Aleutian island #volcano letting off a little steam after the new year on Jan 2, 2016. #YearInSpace. Credit: NASA/Scott Kelly/@StationCDRKelly
By this definition, those volcanoes that have erupted in the course of human history (which includes more than 500 volcanoes) are defined as active. However, this too is problematic, since this varies from region to region – with some areas cataloging volcanoes for thousands of years, while others only have records for the past few centuries.
As such, an “active volcano” can be best described as one that’s currently in a state of regular eruptions. Maybe it’s going off right now, or had an event in the last few decades, or geologists expect it to erupt again very soon. In short, if its spewing fire or likely to again in the near future, then it’s active!
Dormant Volcano:
Meanwhile, a dormant volcano is used to refer to those that are capable of erupting, and will probably erupt again in the future, but hasn’t had an eruption for a very long time. Here too, definitions become complicated since it is difficult to distinguish between a volcano that is simply not active at present, and one that will remain inactive.
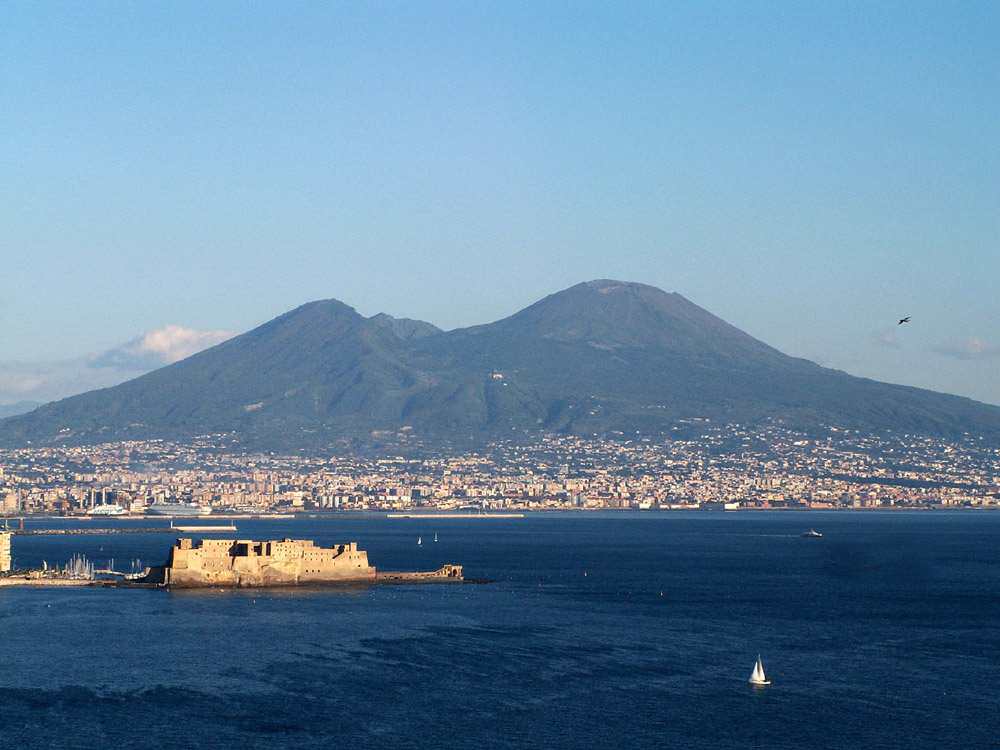
Volcanoes are often considered to be extinct if there are no written records of its activity. Nevertheless, volcanoes may remain dormant for a long period of time. For instance, the volcanoes of Yellowstone, Toba, and Vesuvius were all thought to be extinct before their historic and devastating eruptions.
The area around Mount Vesuvius, which erupted in 79 CE, is now densely populated. Credit: Wikipedia Commons/Jeffmatt
The same is true of the Fourpeaked Mountain eruption in Alaska in 2006. Prior to this, the volcano was thought to be extinct since it had not erupted for over 10,000 years. Compare that to Mount Grímsvötn in south-east Iceland, which erupted three times in the past 12 years (in 2011, 2008 and 2004, respectively).
And so a dormant volcano is actually part of the active volcano classification, it’s just that it’s not currently erupting.
Extinct Volcano:
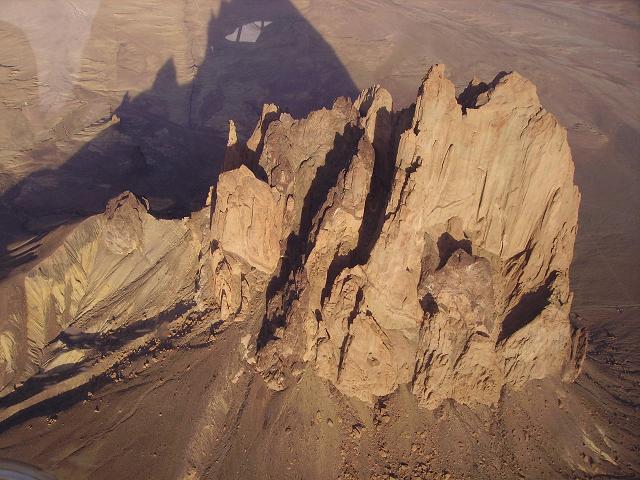
Geologists also employ the category of extinct volcano to refer to volcanoes that have become cut off from their magma supply. There are many examples of extinct volcanoes around the world, many of which are found in the Hawaiian-Emperor Seamount Chain in the Pacific Ocean, or stand individually in some areas.
For example, the Shiprock volcano, which stands in Navajo Nation territory in New Mexico, is an example of a solitary extinct volcano. Edinburgh Castle, located just outside the capitol of Edinburgh, Scotland, is famously located atop an extinct volcano.
Aerial photograph of the Shiprock extinct volcano. Credit: Wikipedia Commons
But of course, determining if a volcano is truly extinct is often difficult, since some volcanoes can have eruptive lifespans that measure into the millions of years. As such, some volcanologists refer to extinct volcanoes as inactive, and some volcanoes once thought to be extinct are now referred to as dormant.
In short, knowing if a volcano is active, dormant, or extinct is complicated and all comes down to timing. And when it comes to geological features, timing is quite difficult for us mere mortals. Individuals and generations have limited life spans, nations rise and fall, and even entire civilization sometimes bite the dust.
But volcanic formations? They can endure for millions of years! Knowing if there still life in them requires hard work, good record-keeping, and (above all) immense patience.
Look up at the night sky, and what do you see? Space, glittering and gleaming in all its glory. Astronomically speaking, space is really quite close, lingering just on the other side of that thin layer we call an atmosphere. And if you think about it, Earth is little more than a tiny island in a sea of space. So it is quite literally all around us.
By definition, space is defined as being the point at which the Earth’s atmosphere ends, and the vacuum of space begins. But exactly how far away is that? How high do you need to travel before you can actually touch space? As you can probably imagine, with such a subjective definition, people tend to disagree on exactly where space begins.
Definition:
The first official definition of space came from the National Advisory Committee for Aeronautics (the predecessor to NASA), who decided on the point where atmospheric pressure was less than one pound per square foot. This was the altitude that airplane control surfaces could no longer be used, and corresponded to roughly 81 kilometers (50 miles) above the Earth’s surface.
The Bell X-1, in which Chuck Yeager “broke” the sound barrier in 1947. Credit: NASA
Any NASA test pilot or astronaut who crosses this altitude is awarded their astronaut wings. Shortly after that definition was passed, the aerospace engineer Theodore von Kármán calculated that above an altitude of 100 km, the atmosphere would be so thin that an aircraft would need to be traveling at orbital velocity to derive any lift.
This altitude was later adopted as the Karman Line by the World Air Sports Federation (Fédération Aéronautique Internationale, FAI). And in 2012, when Felix Baumgartner broke the record for the highest freefall, he jumped from an altitude of 39 kilometers (24.23 mi), less than halfway to space (according to NASA’s definition).
By the same token, space is often defined as beginning at the lowest altitude at which satellites can maintain orbits for a reasonable time – which is approximately 160 kilometers (100 miles) above the surface. These varying definitions are complicated when one takes the definition of the word “atmosphere” into account.
Earth’s Atmosphere:
When we talk about Earth’s atmosphere, we tend to think of the region where air pressure is still high enough to cause air resistance, or where the air is simply thick enough to breath. But in truth, Earth’s atmosphere is made up of five main layers – the Troposphere, the Stratosphere, the Mesosphere, the Thermosphere, and the Exosphere – the latter of which extend pretty far out into space.
Space Shuttle Endeavor silhouetted against Earth’s atmosphere. The orange layer is the troposphere, the white layer is the stratosphere and the blue layer the mesosphere. Credit: NASAThe Thermosphere, the second highest layer of the atmosphere, extends from an altitude of about 80 km (50 mi) up to the thermopause, which is at an altitude of 500–1000 km (310–620 mi). The lower part of the thermosphere, – from 80 to 550 kilometers (50 to 342 mi) – contains the ionosphere, which is so named because it is here in the atmosphere that particles are ionized by solar radiation.
Hence, this is where the phenomena known as Aurora Borealis and Aurara Australis are known to take place. The International Space Station also orbits in this layer, between 320 and 380 km (200 and 240 mi), and needs to be constantly boosted because friction with the atmosphere still occurs.
The outermost layer, known as the exosphere, extends out to an altitude of 10,000 km (6214 mi) above the planet. This layer is mainly composed of extremely low densities of hydrogen, helium and several heavier molecules (nitrogen, oxygen, CO²). The atoms and molecules are so far apart that the exosphere no longer behaves like a gas and the particles constantly escape into space.
It is here that Earth’s atmosphere truly merges with the emptiness of outer space, where there is no atmosphere. Hence why the majority of Earth’s satellites orbit within this region. Sometimes, the Aurora Borealis and Aurora Australis occur in the lower part of the exosphere, where they overlap into the thermosphere. But beyond that, there is no meteorological phenomena in this region.
Interplanetary vs. Interstellar:
Another important distinction when discussing space is the difference between that which lies between planets (interplanetary space) and that which lies between star systems (interstellar space) in our galaxy. But of course, that’s just the tip of the iceberg when it comes to space.
If one were to cast the net wider, there is also the space which lies between galaxies in the Universe (intergalactic space). In all cases, the definition involves regions where the concentration of matter is significantly lower than in other places – i.e. a region occupied centrally by a planet, star or galaxy.
In addition, in all three definitions, the measurements involved are beyond anything that we humans are accustomed to dealing with on a regular basis. Some scientists believe that space extends infinitely in all directions, while others believe that space is finite, but is unbounded and continuous (i.e. has no beginning and end).
In other words, there’s a reason they call it space – there’s just so much of it!
Exploration:
The exploration of space (that is to say, that which lies immediately beyond Earth’s atmosphere) began in earnest with what is known as the “Space Age“, This newfound age of exploration began with the United States and Soviet Union setting their sights on placing satellites and crewed modules into orbit.
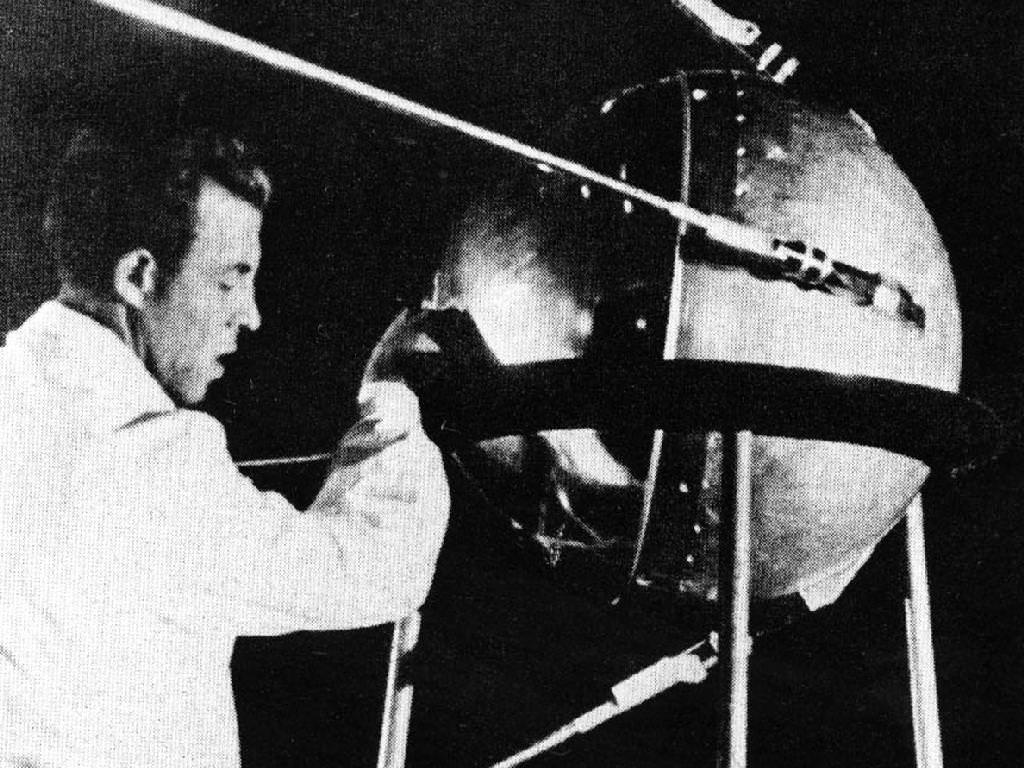
The first major event of the Space Age took place on October 4th, 1957, with the launch ofSputnik 1 by the Soviet Union – the first artificial satellite to be launched into orbit. In response, then-President Dwight D. Eisenhower signed the National Aeronautics and Space Act on July 29th, 1958, officially establishing NASA.
Photograph of a Russian technician putting the finishing touches on Sputnik 1, humanity’s first artificial satellite. Credit: NASA/Asif A.
Immediately, NASA and the Soviet space program began taking the necessary steps towards creating manned spacecraft. By 1959, this competition resulted in the creation of the Soviet Vostok program and NASA’s Project Mercury. In the case of Vostok, this consisted of developing a space capsule that could be launched aboard an expendable carrier rocket.
Along with numerous unmanned tests, and a few using dogs, six Soviet pilots were selected by 1960 to be the first men to go into space. On April 12th, 1961, Soviet cosmonaut Yuri Gagarin was launched aboard the Vostok 1spacecraft from the Baikonur Cosmodrome, and thus became the fist man to go into space (beating American Alan Shepard by just a few weeks).
On June 16th, 1963, Valentina Tereshkova was sent into orbit aboard the Vostok 6 craft (which was the final Vostok mission), and thus became the first woman to go into space. Meanwhile, NASA took over Project Mercury from the US Air Force and began developing their own crewed mission concept.
Yury Gagarin before a space flight aboard the Vostok spacecraft. April 12, 1961 Credit: RIA Novosti
Designed to send a man into space using existing rockets, the program quickly adopted the concept of launching ballistic capsules into orbit. The first seven astronauts, nicknamed the “Mercury Seven“, were selected from from the Navy, Air Force and Marine test pilot programs.
On May 5th, 1961, astronaut Alan Shepard became the first American in space aboard the Freedom 7 mission. Then, on February 20th, 1962, astronaut John Glenn became the first American to be launched into orbit by an Atlas launch vehicle as part of Friendship 7. Glenn completed three orbits of planet Earth, and three more orbital flights were made, culminating in L. Gordon Cooper’s 22-orbit flight aboard Faith 7, which flew on May 15th and 16th, 1963.
In the ensuing decades, both NASA and Soviets began to develop more complex, long-range crewed spacecraft. Once the “Race to the Moon” ended with the successful landing of Apollo 11 (followed by several more Apollo missions), the focus began to shift to establishing a permanent presence in space.
For the Russians, this led to the continued development of space station technology as part of the Salyut program. Between 1972 and 1991, they attempted to orbit seven separate stations. However, technical failures and a failure in one rocket’s second stage boosters caused the first three attempts after Salyut 1 to fail or result in the station’s orbits decaying after a short period.
Skylab, America’s First manned Space Station. Photo taken by departing Skylab 4 crew in Feb. 1974. Credit: NASA
However, by 1974, the Russians managed to successfully deploy Salyut 4, followed by three more stations that would remain in orbit for periods of between one and nine years. While all of the Salyuts were presented to the public as non-military scientific laboratories, some of them were actually covers for the military Almaz reconnaissance stations.
NASA also pursued the development of space station technology, which culminated in May of 1973 with the launch of Skylab, which would remain America’s first and only independently-built space station. During deployment, Skylab suffered severe damage, losing its thermal protection and one of its solar panels.
This required the first crew to rendezvous with the station and conduct repairs. Two more crews followed, and the station was occupied for a total of 171 days during its history of service. This ended in 1979 with the downing of the station over the Indian Ocean and parts of southern Australia.
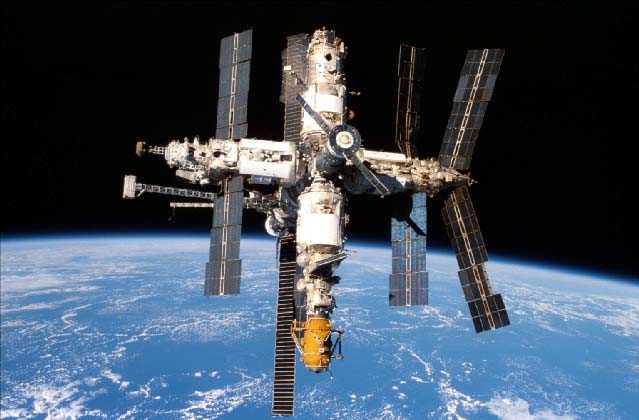
By 1986, the Soviets once again took the lead in the creation of space stations with the deployment of Mir. Authorized in February 1976 by a government decree, the station was originally intended to be an improved model of the Salyut space stations. In time, it evolved into a station consisting of multiple modules and several ports for crewed Soyuz spacecraft and Progress cargo spaceships.
The Mir Space Station and Earth limb observed from the Orbiter Endeavour during NASA’s STS-89 mission in 1998. Credit: NASA
The core module was launched into orbit on February 19th, 1986; and between 1987 and 1996, all of the other modules would be deployed and attached. During its 15-years of service, Mir was visited by a total of 28 long-duration crews. Through a series of collaborative programs with other nations, the station would also be visited by crews from other Eastern Bloc nations, the European Space Agency (ESA), and NASA.
After a series of technical and structural problems caught up with the station, the Russian government announced in 2000 that it would decommission the space station. This began on Jan. 24th, 2001, when a Russian Progress cargo ship docked with the station and pushed it out of orbit. The station then entered the atmosphere and crashed into the South Pacific.
By 1993, NASA began collaborating with the Russians, the ESA and the Japan Aerospace Exploration Agency (JAXA) to create the International Space Station (ISS). Combining NASA’s Space Station Freedom project with the Soviet/Russian Mir-2 station, the European Columbus station, and the Japanese Kibo laboratory module, the project also built on the Russian-American Shuttle-Mir missions (1995-1998).
With the retirement of the Space Shuttle Program in 2011, crew members have been delivered exclusively by Soyuz spacecraft in recent years. Since 2014, cooperation between NASA and Roscosmos has been suspended for most non-ISS activities due to tensions caused by the situation in the Ukraine.
However, in the past few years, indigenous launch capability has been restored to the US thanks to companies like SpaceX, United Launch Alliance, and Blue Origin stepping in to fill the void with their private fleet of rockets.
The ISS has been continuously occupied for the past 15 years, having exceeded the previous record held by Mir; and has been visited by astronauts and cosmonauts from 15 different nations. The ISS program is expected to continue until at least 2020, but may be extended until 2028 or possibly longer, depending on the budget environment.
As you can clearly see, where our atmosphere ends and space begins is the subject of some debate. But thanks to decades of space exploration and launches, we have managed to come up with a working definition. But whatever the exact definition is, if you can get above 100 kilometers, you have definitely earned your astronaut wings!
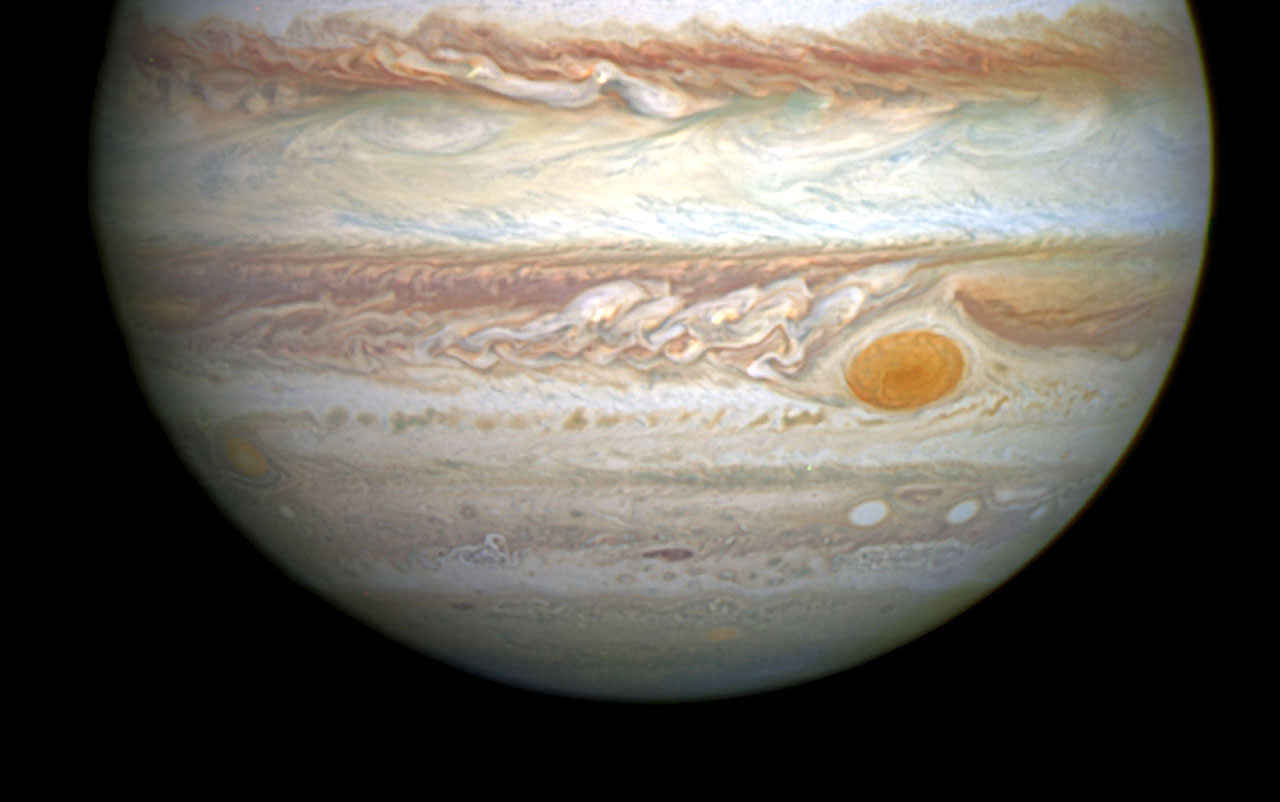
Jupiter's Great Red Spot or GRS - taken by Hubble on April 21, 2014.
Image Credit:
Welcome to a new series here at Universe Today! In this segment, we will be taking a look at the weather on other planets. First up, we take a look at the “King of Planets” – Jupiter!
One of the most obvious facts about the gas giant Jupiter is its immense size. With a mean radius of 69,911 ± 6 km (43441 mi) and a mass of 1.8986 × 1027 kg, Jupiter is almost 11 times the size of Earth, and just under 318 times Earth’s massive. But this “go big or go home” attitude extends far beyond the planet’s size.
When it comes to weather patterns, Jupiter is also an exercise in extremes. The planet experiences storms that can grow to thousands of kilometers in diameter in the space of a few hours. The planet also experiences windstorms, lightning, and auroras in some areas. In fact, the weather on Jupiter is so extreme that it can be seen from space!
Jupiter’s Atmosphere:
Jupiter is composed primarily of gaseous and liquid matter. It is the largest of the gas giants, and like them, is divided between a gaseous outer atmosphere and an interior that is made up of denser materials. It’s upper atmosphere is composed of about 88–92% hydrogen and 8–12% helium by percent volume of gas molecules, and approx. 75% hydrogen and 24% helium by mass, with the remaining one percent consisting of other elements.
This view compares a “lucky imaging” view of Jupiter from VISIR (left) at infrared wavelengths with a very sharp amateur image in visible light (right). Credit: ESO/L.N. Fletcher/Damian Peach
The atmosphere contains trace amounts of methane, water vapor, ammonia, and silicon-based compounds as well as trace amounts of benzene and other hydrocarbons. There are also traces of carbon, ethane, hydrogen sulfide, neon, oxygen, phosphine, and sulfur. Crystals of frozen ammonia have also been observed in the outermost layer of the atmosphere.
Jupiter is perpetually covered with clouds that are composed of these ammonia crystals, and possibly ammonium hydrosulfide. These clouds are located in the tropopause and are arranged into bands of different latitudes, known as “tropical regions”. The cloud layer is only about 50 km (31 mi) deep, and consists of at least two decks of clouds: a thick lower deck and a thin clearer region.
These clouds are also what gives the planet is banded appearance, with clouds of yellow, brown and white circling the surface rapidly. These bands are produced by air flowing in different directions at various latitudes. Lighter-hued areas where the atmosphere rises are called zones. Darker regions where air falls are called belts. When these opposing flows interact, storms and turbulence appear (aka. “zonal jets”).
The Great Red Spot:
As noted already, Jupiter experiences violent storms, which often take the form of zonal jets. In these weather fronts, wind speeds of 100 m/s (360 km/h) are common. But wind storms on the mighty planet can reach as high as 620 kph (385 mph). These storms can form within hours and become thousands of kilometers in diameter overnight.
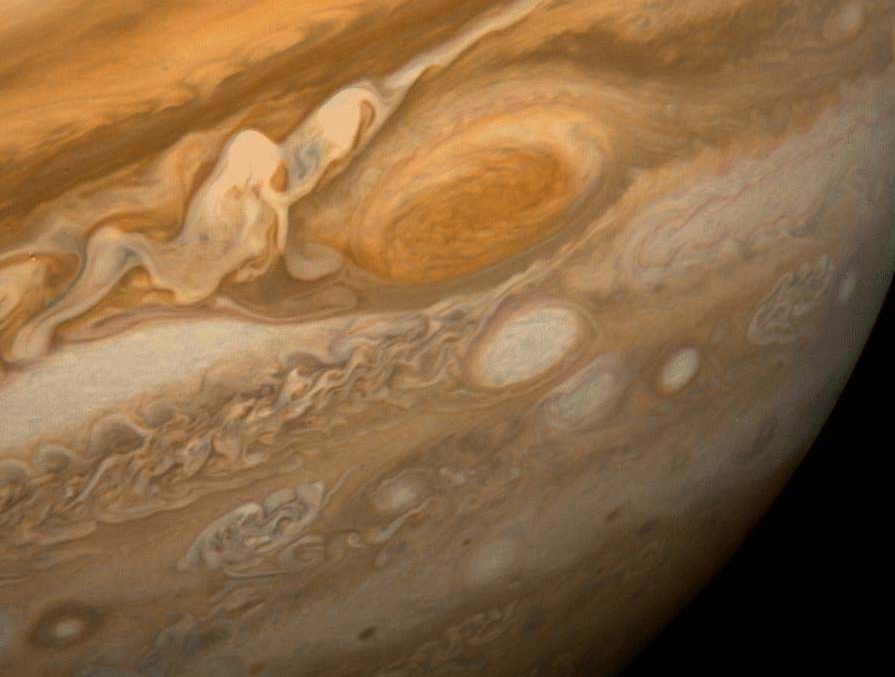
The Juno spacecraft isn’t the first one to visit Jupiter. Galileo went there in the mid 90’s, and Voyager 1 snapped a nice picture of the clouds on its mission. Image: NASA
One storm, the Great Red Spot, has been raging since at least the late 1600s – when Italian astronomer Giovanni Cassini made the first recorded observation of it. The storm has been shrinking and expanding throughout its history; but in 2012, it was suggested that the Giant Red Spot might eventually disappear.
This storm is one of the best known features in the Solar System. It is located 22° south of the equator and reaching sizes of up to 40,000 km across, it is larger in diameter than Earth. The storm rotates in a counter-clockwise motion, making it an anti-cyclonic storm.
It rotates differently than the rest of the atmosphere: sometimes faster and sometimes slower. During its recorded history it has traveled several times around the planet relative to any fixed position below it.
Meteorological Phenomena:
Jupiter also experience weather phenomena that are similar to those of Earth. These lightning storms, which have been detected in Jupiter’s atmosphere. Scientists believe that these may be due to a thin layer of water clouds underlying the ammonia layer.
Composite images from the Chandra X-Ray Observatory and the Hubble Space Telescope show the hyper-energetic x-ray auroras at Jupiter. Image: X-ray: NASA/CXC/UCL/W.Dunn et al, Optical: NASA/STScI
The presence of this water layer (and it’s polarity) would create the charge separation needed for lightning to occur. Observations of these electrical discharges indicate that they can be up to a thousand times as powerful as those observed here on the Earth.
Like Earth, Jupiter also experiences auroras near its northern and southern poles. But on Jupiter, the auroral activity is much more intense and rarely ever stops. The intense radiation, Jupiter’s powerful magnetic field, and the abundance of material from Io’s volcanoes that react with Jupiter’s ionosphere, create a light show that is truly spectacular.
What it comes down to is that Jupiter experiences weather that is similar to what we experience here on Earth. This includes wind storms, lightning, and auroras in both the northern and southern polar regions. The only difference is, in Jupiter’s case, the size and scale of the weather is much, much larger!
On Jupiter, as with everything else on the “King of Planets”, the weather is the result of titanic forces that produce some seriously powerful results. If any of these were to happen here on Earth, the results would be disasterous!
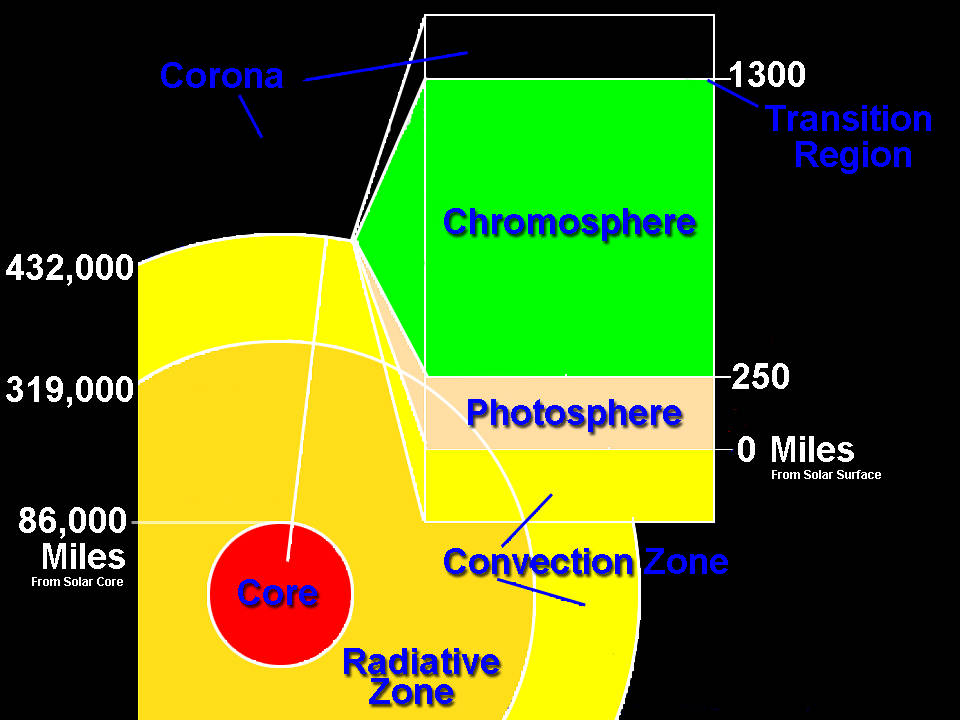
The interior structure of the Sun. Credit: Wikipedia Commons/kelvinsong
From here on Earth, the Sun like a smooth ball of light. And prior to Galileo’s discovery of sunposts, astronomers even thought it was a perfect orb with no imperfections. However, thanks to improved instruments and many centuries of study, we know that the Sun is much like the planets of our Solar System.
In addition to imperfections on its surface, the Sun is also made up of several layers, each of which serves its own purpose. It’s this structure of the Sun that powers this massive engine that provides the planets with all the light and heat they receive. And here on Earth, it is what provides all life forms with the energy they need to thrive and survive.
Composition:
If you could take the Sun apart, and stack up its various elements, you would find that the Sun is made of hydrogen (74%) and helium (about 24%). Astronomers consider anything heavier than helium to be a metal. The remaining amount of the Sun is made of iron, nickel, oxygen, silicon, sulfur, magnesium, carbon, neon, calcium and chromium. In fact, the Sun is 1% oxygen; and everything else comes out of that last 1%.
Where did these elements come from? The hydrogen and helium came from the Big Bang. In the early moments of the Universe, the first element, hydrogen, formed from the soup of elementary particles. The pressure and temperatures were still so intense that the entire Universe had the same conditions as the core of a star.
Hydrogen was fused into helium until the Universe cooled down enough that this reaction couldn’t happen any more. The ratios of hydrogen and helium that we see in the Universe today were created in those first few moments after the Big Bang. The other elements were created in other stars. Stars are constantly fusing hydrogen into helium in their cores.
Once the hydrogen in the core runs out, they switch to fusing heavier and heavier elements, like helium, lithium, oxygen. Most of the heavier metals we see in the Sun were formed in other stars at the end of their lives. The heaviest elements, like gold and uranium, were formed when stars many times more massive that our Sun detonated in supernova explosions.
In a fraction of a second, as a black hole was forming, elements were crushed together in the intense heat and pressure to form the heaviest elements. The explosion scattered these elements across the region, where they could contribute to the formation of new stars.
Our Sun is made up of elements left over from the Big Bang, elements formed from dying stars, and elements created in supernovae. That’s pretty amazing.
Structure:
Although the Sun is mostly just a ball of hydrogen and helium, it’s actually broken up into distinct layers. The layers of the Sun are created because the temperatures and pressures increase as you move towards the center of the Sun. The hydrogen and helium behave differently under the changing conditions.
The Core: Let’s start at the innermost layer of the Sun, the core of the Sun. This is the very center of the Sun, where temperatures and pressures are so high that fusion can happen. The Sun is combining hydrogen into helium atoms, and this reaction gives off the light and heat that we see here on Earth. The density of the core is 150 times the density of water, and the temperatures are thought to be 13,600,000 degrees Kelvin.
Astronomers believe that the core of the Sun extends from the center out to about 0.2 solar radius. And within this region, temperatures and pressures are so high that hydrogen atoms are torn apart to form separate protons, neutrons and electrons. With all of these free floating particles, the Sun is able to reform them into atoms of helium.
This reaction is exothermic. That means that the reaction gives off a tremendous amount of heat – 3.89 x 1033 ergs of energy every second. The light pressure of all this energy streaming from the core of the Sun is what stops it from collapsing inward on itself.
Radiative Zone: The radiative zone of the Sun starts at the edge of the core of the Sun (0.2 solar radii), and extends up to about 0.7 radii. Within the radiative zone, the solar material is hot and dense enough that thermal radiation transfers the heat of the core outward through the Sun.
The core of the Sun is where nuclear fusion reactions are happening – protons are merged together to create atoms of helium. This reaction produces a tremendous amount of gamma radiation. These photons of energy are emitted, absorbed, and then emitted again by various particles in the radiative zone.
The path that photons take is called the “random walk”. Instead of going in a straight beam of light, they travel in a zigzag direction, eventually reaching the surface of the Sun. In fact, it can take a single photon upwards of 200,000 years to make the journey through the radiative zone of the Sun.
As they transfer from particle to particle, the photons lose energy. That’s a good thing, since we wouldn’t want only gamma radiation streaming from the Sun. Once these photons reach space, they take a mere 8 minutes to get to Earth.
Most stars will have radiative zones, but their size depends on the star’s size. Small stars will have much smaller radiative zones, and the convective zone will take up a larger portion of the star’s interior. The smallest stars might not have a radiative zone at all, with the convective zone reaching all the way down to the core. The largest stars would have the opposite situation, where the radiative zone reaches all the way up to the surface.
Convective Zone: Outside the radiative zone is another layer, called the convective zone, where heat from inside the Sun is carried up by columns of hot gas. Most stars have a convective zone. In the case of the Sun, it starts at around 70% of the Sun’s radius and goes to the outer surface (the photosphere).
Gas deeper inside the star is heated up so that it rises, like globs of wax in a lava lamp. As it gets to the surface, the gas loses some of its heat, cools down, and sinks back towards the center to pick up more heat. Another example would be a pot of boiling water on the stove.
The surface of the Sun looks granulated. These granules are the columns of hot gas that carry heat to the surface. They can be more than 1,000 km across, and typically last about 8 to 20 minutes before dissipating. Astronomers think that low mass stars, like red dwarfs, have a convective zone that goes all the way down to the core. Unlike the Sun, they don’t have a radiative zone at all.
Photosphere: The layer of the Sun that we can see from Earth is called the photosphere. Below the photosphere, the Sun becomes opaque to visible light, and astronomers have to use other methods to probe its interior. The temperature of the photosphere is about 6,000 Kelvin, and gives off the yellow-white light that we see.
Above the photosphere is the atmosphere of the Sun. Perhaps the most dramatic of these is the corona, which is visible during a total solar eclipse.
Graphic showing a model of the layers of the Sun, with approximate mileage ranges for each layer. Credit: NASA
Diagram:
Below is a diagram of the Sun, originally developed by NASA for educational purposes.
Visible, IR and UV radiation – The light that we see coming from the Sun is visible, but if you close your eyes and just feel the warmth, that’s IR, or infrared radiation. And the light that gives you a sunburn is ultraviolet (UV) radiation. The Sun produces all of these wavelengths at the same time.
Photosphere 6000 K – The photosphere is the surface of the Sun. This is the region where light from the interior finally reaches space. The temperature is 6000 K, which is the same as 5,700 degrees C.
Photosphere 6000 K – The photosphere is the surface of the Sun. This is the region where light from the interior finally reaches space. The temperature is 6000 K, which is the same as 5,700 degrees C.
Radio emissions – In addition to visible, IR and UV, the Sun also gives off radio emissions, which can be detected by a radio telescope. These emissions rise and fall depending on the number of sunspots on the surface of the Sun.
Coronal Hole – These are regions on the Sun where the corona is cooler, darker and has less dense plasma.
2100000 – This is the temperature of the Sun’s radiative zone.
Convective zone/Turbulent convection – This is the region of the Sun where heat from the core is transferred through convection. Warm columns of plasma rise to the surface in columns, release their heat and then fall back down to heat up again.
Coronal loops – These are loops of plasma in the Sun’s atmosphere that follows magnetic flux lines. They look like big arches, stretching up from the surface of the Sun for hundreds of thousands of kilometers.
Core – The is the heart of the Sun, where the temperatures and pressures are so high that nuclear fusion reactions can happen. All of the energy coming from the Sun originates from the core.
14500000 K – The temperature of the core of the Sun.
Radiative Zone – The region of the Sun where energy can only be transferred through radiation. It can take a single photon 200,000 years to get from the core, through the radiative zone, out to the surface and into space.
Neutrinos – Neutrinos are nearly mass-less particles blasted out from the Sun as part of the fusion reactions. There are millions of neutrinos passing through your body every second, but they don’t interact, so you can’t feel them.
Chromospheric Flare – The Sun’s magnetic field can get twisted up and then snap into a different configuration. When this happens, there can be powerful X-ray flares emanating from the surface of the Sun.
Magnetic Field Loop – The Sun’s magnetic field extends out above its surface, and can be seen because hot plasma in the atmosphere follows the field lines.
Spot – A sunspot. These are areas on the Sun’s surface where the magnetic field lines pierce the surface of the Sun, and they’re relatively cooler than the surrounding areas.
Prominence – A bright feature that extends above the surface of the Sun, often in the shape of a loop.
Energetic particles – There can be energetic particles blasting off the surface of the Sun to create the solar wind. In solar storms, energetic protons can be accelerated to nearly the speed of light.
X-rays – In addition to the wavelengths we can see, there are invisible X-rays coming from the Sun, especially during flares. The Earth’s atmosphere protects us from this radiation.
Bright spots and short-lived magnetic regions – The surface of the Sun has many brighter and dimmer spots caused by changing temperature. The temperature changes from the constantly shifting magnetic field.
Yes, the Sun is like an onion. Peel back one layer and you’ll find many more. But in this case, each layers is responsible for a different function. And what they add to is a giant furnace and light source that keeps us living beings here on Earth warm and illuminated!
And be sure to enjoy this video from the NASA Goddard Center, titled “Snapshots from the Edge of the Sun”:
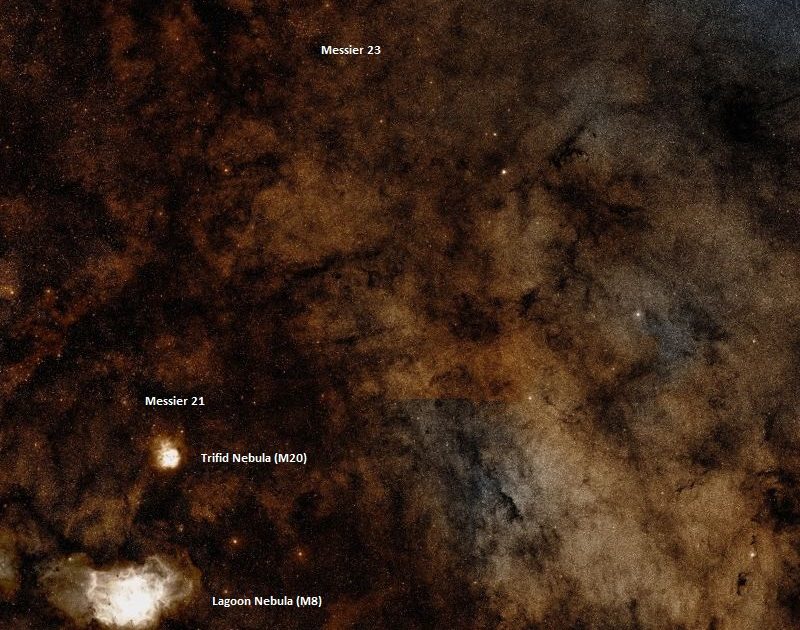
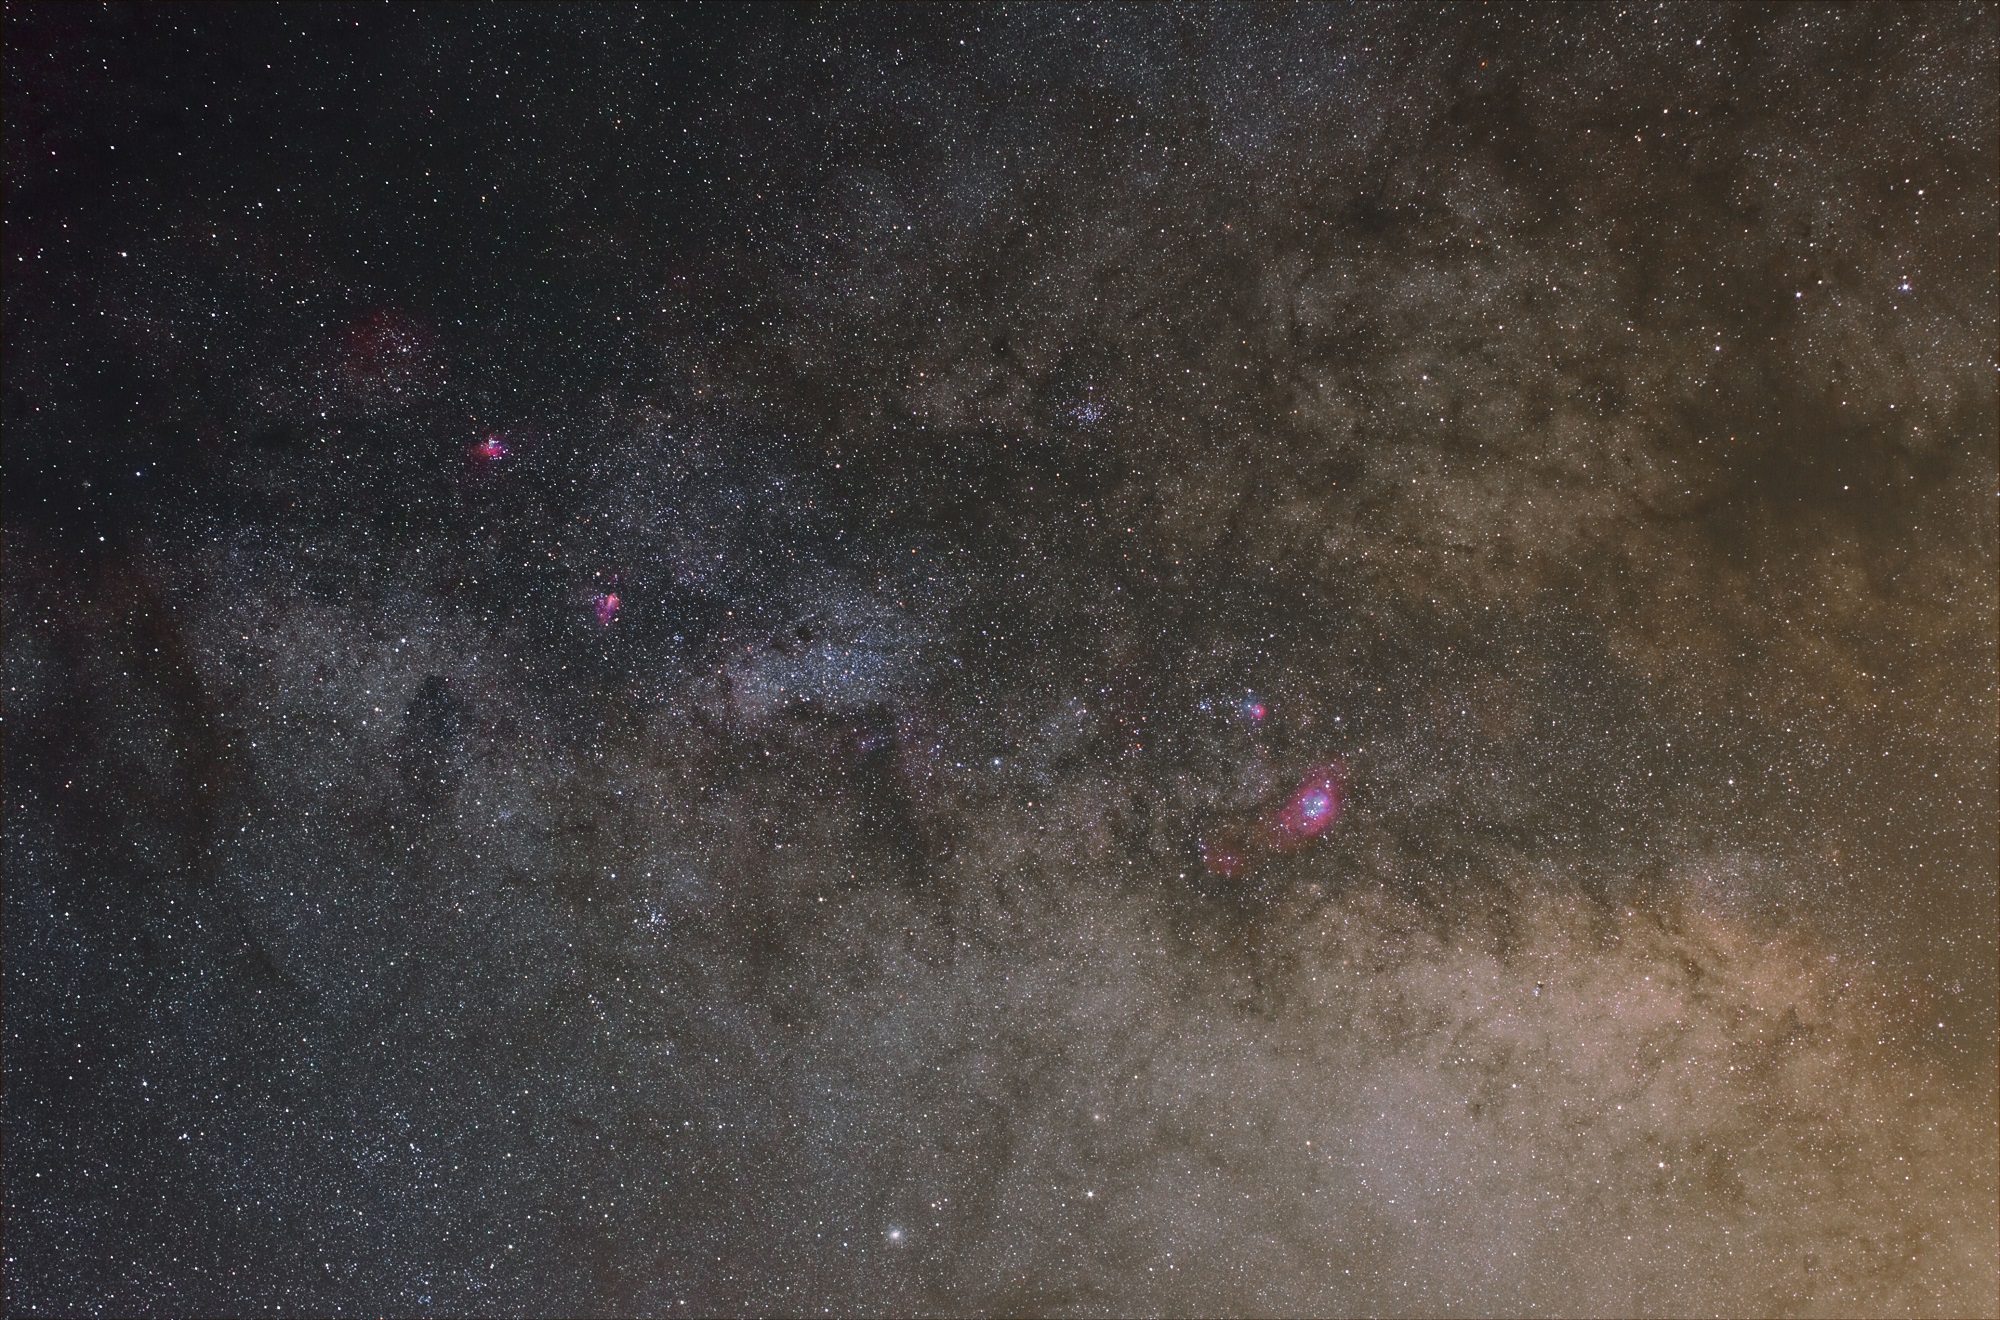
Messier 23, Messier 21, Trifid Nebula (M20) and Omega Nebula (M17). Credit: Wikisky
Welcome back to Messier Monday! In our ongoing tribute to the great Tammy Plotner, we take a look at the Messier 23 open star cluster. Enjoy!
Back in the 18th century, famed French astronomer Charles Messier noted the presence of several “nebulous objects” in the night sky. Having originally mistaken them for comets, he began compiling a list of these objects so that other astronomers wouldn’t make the same mistake. Consisting of 100 objects, the Messier Catalog has come to be viewed as a major milestone in the study of Deep Space Objects.
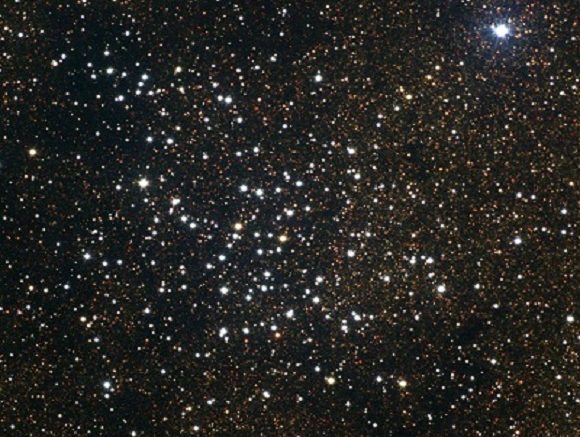
One of these objects is Messier 23 (aka. NGC 6494), a large open star cluster that is located in the constellation Sagittarius. Given its luminosity, it can be found quite easily in the rich star fields of the summer Milky Way using small telescopes and even binoculars.
Description:
Located some 2,150 light years (659 Parsecs) away from Earth, this vast cloud of 176 confirmed stars stretches across 15 to 20 light years of space. At an estimated 220 to 300 million years old, Messier 23 is on the “senior citizen” list of galactic open clusters in our galaxy. At this age, its hottest stars reach spectral type B9, and it even contains a few blue straggler candidates.
Mosaic image obtained as part of the Two Micron All Sky Survey (2MASS). Credit: UofM/IPAC/Caltech/NASA/NSF
Given that M23 has spent many centuries sweeping through the interstellar medium, astronomers have wondered how this would affect its metal content. Using UBV photometry, astronauts examined the metallicity of M23, and determined that it had no discernible effect. As W.L. Sanders wrote of the cluster in 1990:
“UBV photometric observations of 176 stars in the galactic cluster NGC 6494 are presented and analyzed. The effect of a gas poor environment on the metal abundance of NGC 6494 is studied. It is determined that the metallicity of NGC 6494, which has a delta(U – B) value = + 0.02, is not affected by the interarm region in which it dwelled.”
At the same time, astronomers have discovered that some of M23’s older stars – the red giants – are suffering mass loss. As G. Barbaro (et al.) of the Istituto di Fisica dell’Universita put it in 1969:
“A statistical research on evolved stars beyond hydrogen exhaustion is performed by comparing the H-R diagrams of about 60 open clusters with a set of isochronous curves without mass loss derived from Iben’s evolutionary tracks and time scales for Population I stars. Interpreting the difference in magnitude between the theoretical positions thus calculated and the observed ones as due to mass loss, when negative, the results indicate that this loss may be conspicuous only for very massive and red stars. However, a comparison with an analogous work of Lindoff reveals that the uncertainties connected with the bolometric and color corrections may invalidate by a large amount the conclusions which might be drawn from such research.”
Close-up of the core of M23, showing some of its brightest member stars. Credit: Sharp/NOAO/AURA/NSF
However, the most recent studies show that we have to determine radial velocities before we can really associate red giants as being cluster members. J.C. Mermilliod of Laboratoire d’Astrophysique de l’Ecole wrote in his 2008 study, “Red giants in open clusters“:
“The present material, combined with recent absolute proper motions, will permit various investigation of the galactic distribution and space motions of a large sample of open clusters. However, the distance estimates still remain the weakest part of the necessary data. This paper is the last one in this series devoted to the study of red giants in open clusters based on radial velocities obtained with the CORAVEL instruments.”
History of Observation:
This neat and tidy galactic star cluster was one of the original discoveries of Charles Messier. As he recorded of the cluster when first viewing it, which occurred on June 20th, 1764:
“In the night of June 20 to 21, 1764, I determined the position of a cluster of small stars which is situated between the northern extremity of the bow of Sagittarius and the right foot of Ophiuchus, very close to the star of sixth magnitude, the sixty-fifth of the latter constellation [Oph], after the catalog of Flamsteed: These stars are very close to each other; there is none which one can see easily with an ordinary refractor of 3 feet and a half, and which was taken for these small stars. The diameter of all is about 15 minutes of arc. I have determined its position by comparing the middle with the star Mu Sagittarii: I have found its right ascension of 265d 42′ 50″, and its declination of 18d 45′ 55″, south.”
The M23 open star cluster, as it appears in the night sky (a patch of red), flanked by M8 (Lagoon), M16 (Eagle), M17 (Omega), M20 (Trifid) and other deep sky objects. Credit & Copyright: Fernando Cabrerizo/NASA
While William Herschel did not publish his observations of Messier’s objects, he was still an avid observer. So of course, he had to look at this cluster, and wrote the following observations in his personal notes:
“A cluster of beautiful scattered, large stars, nearly of equal magnitudes (visible in my finder), it extends much farther than the field of the telescope will take in, and in the finder seems to be a nebula of a lengthened form extending to about half a degree.”
In July of 1835, Admiral Smyth would make an observation of Messier 23 and once again add his colorful remarks to the timeline:
“A loose cluster in the space between Ophiuchus’s left leg and the bow of Sagittarius. This is an elegant sprinkling of telescopic stars over the whole field, under a moderate magnifying power; the most clustering portion is oblique, in the direction sp to nf [south preceding to north following, SW to NE], with a 7th-magnitude star in the latter portion. The place registered it that of a neat pair, of the 9th and 10th magnitudes, of a lilac hue, and about 12″ apart. This object was discovered by Messier 1764, and it precedes a rich out-cropping of the Milky Way. The place is gained by differentiating the cluster with Mu Sagittarii, from which it bears north-west, distant about 5 deg, the spot being directed to by a line from Sigma on the shoulder, through Mu at the tip of the bow.”
Remember when observing Messier 23 that it won’t slap you in the face like many objects. Basically, it looks like a stellar scattering of freckles across the face of the sky when fully-resolved. It’s actually one of those objects that’s better to view with binoculars and low power telescopes.
Locating Messier 23:
M23 can be easily found with binoculars about a finger’s width north and two finger widths west of Mu Sagittarii. Or, simply draw a mental line between the top star in the teapot lid (Lambda) and Xi Serpentis. You’ll find a slight compression in the star field about halfway between these two stars that shows up as an open cluster with binoculars.
Using a finderscope, the object will appear nicely as a hazy spot. And for those using telescopes of any size, you’ll need to use fairly low magnification to help set this cluster apart from the surrounding star field, and it will resolve well to almost all instruments.
And here are the quick facts on this object to help you get started:
Object Name: Messier 23 Alternative Designations: M23, NGC 6494 Object Type: Open Star Cluster Constellation: Sagittarius Right Ascension: 17 : 56.8 (h:m) Declination: -19 : 01 (deg:m) Distance: 2.15 (kly) Visual Brightness: 6.9 (mag) Apparent Dimension: 27.0 (arc min)
It turns out I’ve got a few things in common with Elon Musk, the founder of SpaceX and Tesla. We’ve both got Canadian passports, we’re absolutely fascinated by space exploration and believe that humanity’s future is in the stars.
Oh, and we’re kind of obsessed at the possibility that we might be living in a computer simulation.
In the recent 2016 Code Conference, Elon Musk casually mentioned his fascination with the concept first put forth by the scientist Nick Bostrom. Apparently, Musk has brought up the argument so many times, he’s banned from discussing it in hot tubs.
I haven’t received any bans yet, but I’m sure that’s coming.
The argument goes like this:
Advanced civilizations (such as our own) will develop faster and faster computers, capable of producing better and better simulations. You know, how the Sims 2 was a little better than the Sims 1? The Sims 3 was sort of crappy and really felt like a money grab, but the Sims 4 was a huge improvement. Well… imagine the Sims, version 20, or 400, or 4 million.
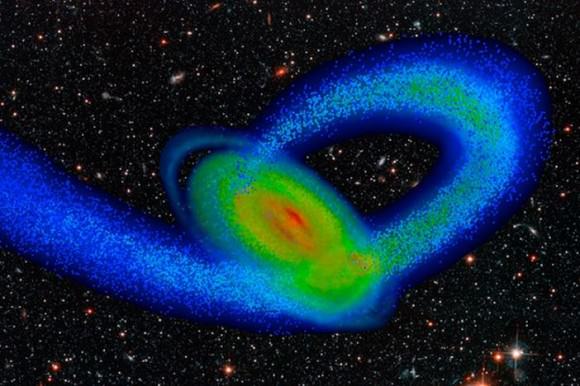
Computer model of the Milky Way and its smaller neighbor, the Sagittarius dwarf galaxy. Image by Tollerud, Purcell and Bullock/UC Irvine
Not only will the simulations get more sophisticated, but the total number of simulations will go up. As computers get faster, they’ll run more and more simulations simultaneously. You’ll get one mediocre simulation, and then a really great simulation, and then thousands of great simulations, and then an almost infinite number of near perfect simulations.
Nick Bostrom calls these ancestor simulations.
Which means that for all the beings living in all the realities, the vast majority of them will be living in a simulation.
According to this argument, and according to Elon Musk, the chance that you or I happen to be living in the actual reality is infinitesimally low.
Is it true then, are we living in a simulation? And if we are, is there any way to tell?
Nick Bostrom’s ancestor simulation argument is actually a little more complex. Either humans will go extinct before they reach the post-human stage. In other words, we’ll wipe ourselves out before we design computers fast enough to run ancestor-simulations.
I’m really hoping this one isn’t true. I’m looking forward to humanity’s long lived future.
Or, posthuman civilizations won’t bother getting around to running ancestor simulations. Like, the artificial superintelligent machines will have more interesting things to do, and won’t consider sparing a few computer cycles to simulate what it might have been like to watch YouTube videos back in 2016.
Again, this doesn’t sound likely to me. I’m sure those computers will be a tiny bit curious about what it was like to watch Jacksepticeye and Markiplier in their glory, before the terrible Five Nights at Freddy’s Theme Park disaster of 2023.
Those were dark days. Animatronics… blue hair… the horror.
At this point, you’re going to fall into one of two camps. Either you’ve thought through the argument and you find it airtight, like me and Elon Musk, or you’re skeptical.
That’s fine, let’s get skeptical.
For starters, you might say, computers can never simulate actual reality. From our current perspective, that true. Our current simulations suck. But, take a look at the simulations from 10 years ago, and you’ll have to agree that today’s simulations suck less than they did in the past. And in the future, they’re going to suck even less; maybe even be downright acceptable.
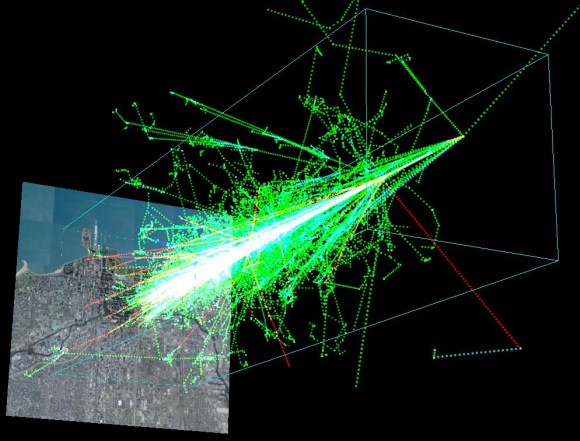
A simulation of the impact a cosmic ray has on entering the atmosphere (credit: AIRES package/Chicago University)
Scientific simulations are getting much much better. Cosmologists have developed simulations that accurately model the early Universe, starting from about 300,000 years after the Big Bang and then tracking forward for 13.8 billion years until now.
They’ve been able to model the interaction of dark matter, dark energy, the formation of the first stars and the interactions of galaxies at the largest scale. They have been able to tweak the simulation and get roughly the same Universe as we see today.
They provide all the starting material, and then simulate the gravity and hydrodynamics, the chemical properties of all that gas, radiation and magnetic fields.
These simulations only recreate the Universe at the largest scales, but I’m sure you can imagine a time when they get better and better, capable of simulating planetary formation, and maybe even the beginnings and evolution of life.
If an advanced civilization ran hundreds, thousands or even billions of these simulations, making them more and more advanced, who knows what they might come up with?
Could we know if we’re actually living in a simulation? The answer is maybe. And you might be amazed to know that scientists have worked out a few tests to try and get an answer.
The first thing to consider is that a simulation can never match the processing power of the reality that it’s trying to simulate. For example, if you made your computer simulate another computer, it wouldn’t be quite as fast as the computer is natively.
Things might seem a bit slow. Credit: CSIRO (CC BY 3.0)
A simulation would need to take shortcuts, use compression and other tricks to make it seem like it’s reality. Sort of how a television show uses a facade of a building, or a cosy living room. There’s nothing behind the door but a sound stage.
In theory, it could be possible to detect those tricks from within the simulation. A team of researchers from the University of Washington have proposed that there might be an underlying grid to the Universe, visible in our observations. They’ve proposed that the observed energy limitations of ultra high-energy cosmic rays might reveal the resolution of the simulation.
Of course, if the simulators are super intelligent enough, they’d have thought of that, and fixed the simulation to account for it. Or went back to a previous save file, once the simulatees figured out reality.
They should have insisted on Ironman Mode.
The reality is that there’s no way we can ever know if we’re actually living in a simulation, or we’re the real reality. We just need to live our lives as if we’re real, until better evidence comes along, or our simulations get so good, their inhabitants start questioning their own existence.
As long as you’re not actually in a hot tub with Elon Musk, feel free to argue about whether or not we’re living in a simulation. What strong reasons do you have to believe we are? Why do you think we aren’t? I’d love to hear your insights.
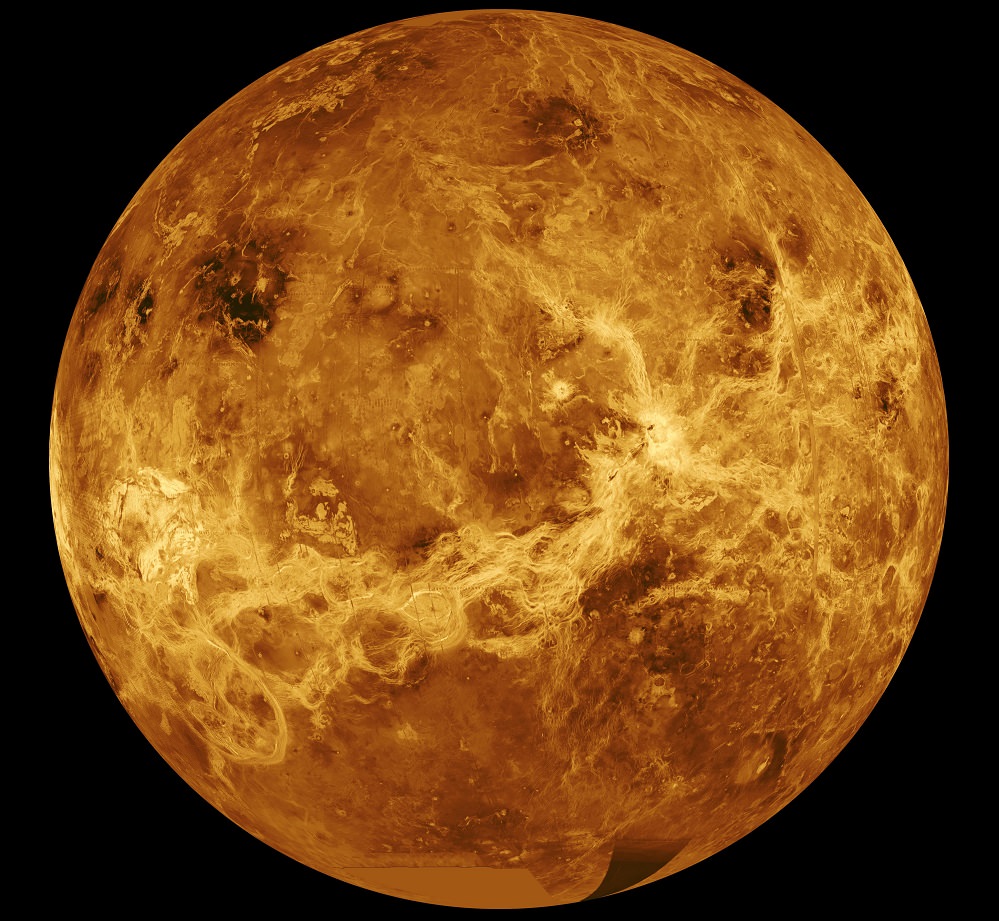
The planet Venus, as imaged by the Magellan 10 mission. The planet's inhospitable surface makes exploration extremely difficult. Credit: NASA/JPL
Welcome back to our series on Settling the Solar System! Today, we take a look at Earth’s “sister planet”, the hellish, yet strangely similar planet Venus. Enjoy!
Since humans first began looking up at the skies, they have been aware of Venus. In ancient times, it was known as both the “Morning Star” and the “Evening Star”, due to its bright appearance in the sky at sunrise and sunset. Eventually, astronomers realized that it was in fact a planet, and that like Earth, it too orbited the Sun. And thanks to the Space Age and numerous missions to the planet, we have learned exactly what kind of environment Venus has.
With an atmosphere so dense that it makes regular surface imaging impossible, heat so intense it can melt lead, and sulfuric acid rain, there seems little reason to go there. But as we’ve learned in recent years, Venus was once a very different place, complete with oceans and continents. And with the right technology, colonies could be built above the clouds, where they would be safe.
So what would it take to colonize Venus? As with other proposals for colonizing the Solar System, it all comes down to having the right kinds of methods and technologies, and how much are we willing to spend.
At a closest average distance of 41 million km (25,476,219 mi), Venus is the closest planet to Earth. Credit: NASA/JPL/Magellan
Examples in Fiction:
Since the early 20th century, the idea of colonizing Venus has been explored in science fiction, mainly in the form of terraforming it. The earliest known example is Olaf Stapleton’sLast And First Men(1930), two chapters of which are dedicated to describing how humanity’s descendants terraform Venus after Earth becomes uninhabitable; and in the process, commit genocide against the native aquatic life.
By the 1950s and 60s, terraforming began to appear in many works of science fiction. Poul Anderson also wrote extensively about terraforming in the 1950s. In his 1954 novel, The Big Rain, Venus is altered through planetary engineering techniques over a very long period of time. The book was so influential that the term term “Big Rain” has since come to be synonymous with the terraforming of Venus.
In 1991, author G. David Nordley suggested in his short story (“The Snows of Venus”) that Venus might be spun-up to a day-length of 30 Earth days by exporting its atmosphere of Venus via mass drivers. Author Kim Stanley Robinson became famous for his realistic depiction of terraforming in the Mars Trilogy – which included Red Mars, Green Mars and Blue Mars.
In 2012, he followed this series up with the release of 2312, a science fiction novel that dealt with the colonization of the entire Solar System – which includes Venus. The novel also explored the many ways in which Venus could be terraformed, ranging from global cooling to carbon sequestration, all of which were based on scholarly studies and proposals.
Artist’s conception of a terraformed Venus, showing a surface largely covered in oceans. Credit: Wikipedia Commons/Ittiz
Proposed Methods:
All told, most proposed methods for colonizing Venus emphasize ecological engineering (aka. terraforming) to make the planet habitable. However, there have also been suggestions as to how human beings could live on Venus without altering the environment substantially.
For instance, according to Inner Solar System: Prospective Energy and Material Resources, by Viorel Badescu, and Kris Zacny (eds), Soviet scientists have suggested that humans could colonize Venus’ atmosphere rather than attempting to live on its hostile surface since the 1970s.
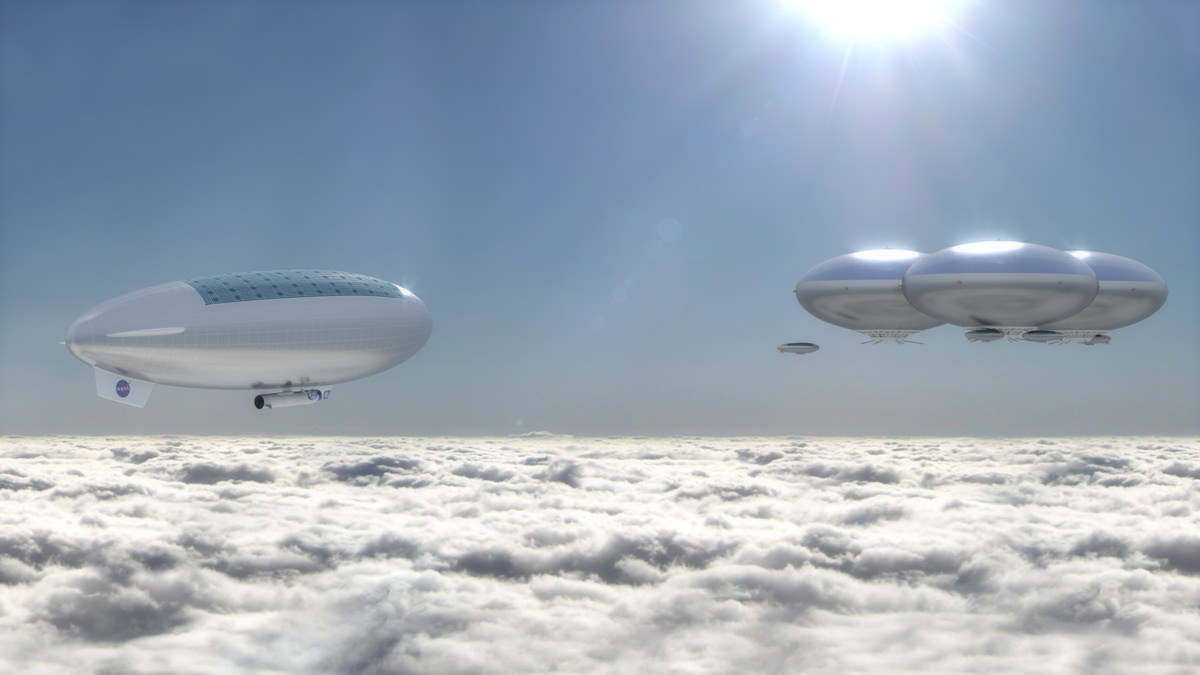
More recently, NASA scientist Geoffrey A. Landis wrote a paper titled “Colonization of Venus“, in which he proposed that cities could be built above Venus’ clouds. At an altitude of 50 km above the surface, he claimed, such cities would be safe from the harsh Venusian environment:
“[T]he atmosphere of Venus is the most earthlike environment (other than Earth itself) in the solar system. It is proposed here that in the near term, human exploration of Venus could take place from aerostat vehicles in the atmosphere, and that in the long term, permanent settlements could be made in the form of cities designed to float at about fifty kilometer altitude in the atmosphere of Venus.”
Artist’s concept of a Venus cloud city — a possible future outcome of the High Altitude Venus Operational Concept (HAVOC) plan. Credit: Advanced Concepts Lab/NASA Langley Research Center
At an altitude of 50 km above the surface, the environment has a pressure of approximately 100,000 Pa, which is slightly less than Earth’s at sea level (101,325 Pa). Temperatures in this regions also range from 0 to 50 °C (273 to 323 K; 32 to 122 °F), and protection against cosmic radiation would be provided by the atmosphere above, with a shielding mass equivalent to Earth’s.
The Venusian habitats, according to Landis’ proposal, would initially consists of aerostats filled with breathable air (a 21:79 oxygen-nitrogen mix). This is based on the concept that air would be a lifting gas in the dense carbon dioxide atmosphere, possessing over 60% of the lifting power that helium has on Earth.
These would provide initial living spaces for colonists, and could act as terraformers, gradually converting Venus’ atmosphere into something livable so the colonists could migrate to the surface. One way to do this would be to use these very cities as solar shades, since their presence in the clouds would prevent solar radiation from reaching the surface.
This would work particularly well if the floating cities were made of low-albedo materials. Alternately, reflective balloons and/or reflecting sheets of carbon nanotubes or graphene could be deployed from these. This offers the advance of in-situ resource allocation, since atmospheric reflectors could be built using locally-sourced carbon.
In addition, these colonies could serve as platforms where chemical elements were introduced into the atmosphere in large amounts. This could take the form of calcium and magnesium dust (which would sequester carbon in the form of calcium and magnesium carbonates), or a hydrogen aerosol (producing graphite and water, the latter of which would fall to the surface and cover roughly 80% of the surface in oceans).
NASA has begun exploring the possibility of mounting crewed missions to Venus as part of their High Altitude Venus Operational Concept (HAVOC), which was proposed in 2015. As outlined by Dale Arney and Chris Jones from NASA’s Langley Research Center, this mission concept calls for all crewed portions of the missions to be conducted from lighter than air craft or from orbit.
Potential Benefits:
The benefits of colonizing Venus are many. For starters, Venus it the closest planet to Earth, which means it would take less time and money and send missions there, compared to other planets in the Solar System. For example, the Venus Express probe took just over five months to travel from Earth to Venus, whereas the Mars Express probe took nearly six months to get from Earth to Mars.
In addition, launch windows to Venus occur more often, every 584 days when Earth and Venus experience an inferior conjunction. This is compared to the 780 days it takes for Earth and Mars to achieve opposition (i.e. the point in their orbits when they make their closest approach).
Compared to a mission to Mars, a mission to Venus’ atmosphere would also subject astronauts to less in the way of harmful radiation. This is due in part to Venus’ greater proximity, but also from Venus’ induced magnetosphere – which comes from the interaction of its thick atmosphere with solar wind.
Also, for floating settlements established in Venus’ atmosphere, there would be less risk of explosive decompression, since there would not be a significant pressure difference between the inside and outside of the habitats. As such, punctures would pose a lesser risk, and repairs would be easier to mount.
In addition, humans would not require pressurized suits to venture outside, as they would on Mars or other planets. Though they would still need oxygen tanks and protection against the acid rain when working outside their habitats, work crews would find the environment far more hospitable.
Venus is also close in size and mass to the Earth, resulting in a surface gravity that would be much easier to adapt to (0.904 g). Compared to gravity on the Moon, Mercury or Mars (0.165 and 0.38 g), this would likely mean that the health effects associated with weightlessness or microgravity would be negligible.
In addition, a settlement there would have access to abundant materials with which to grow food and manufacture materials. Since Venus’ atmosphere is made mostly out of carbon dioxide, nitrogen and sulfur dioxide, these could be sequestered to create fertilizers and other chemical compounds.
CO² could also be chemically separated to create oxygen gas, and the resulting carbon could be used to manufacture graphene, carbon nanotubes and other super-materials. In addition to being used for possible solar shields, they could also be exported off-world as part of the local economy.
Challenges:
Naturally, colonizing a planet like Venus also comes with its share of difficulties. For instance, while floating colonies would be removed from the extreme heat and pressure of the surface, there would still be the hazard posed by sulfuric acid rain. So addition to the need for protective shielding in the colony, work crews and airships would also need protection.
Second, water is virtually non-existent on Venus, and the composition of the atmosphere would not allow for synthetic production. As a result, water would have to be transported to Venus until it be produced onsite (i.e. bringing in hydrogen gas to create water form the atmosphere), and extremely strict recycling protocols would need to be instituted.
Solar shades placed in orbit of Venus are a possible means of terraforming the planet. Credit: IEEE Spectrum/John MacNeill
And of course, there is the matter of the cost involved. Even with launch windows occurring more often, and a shorter transit time of about five months, it would still require a very heavy investment to transport all the necessary materials – not to mention the robot workers needed to assemble them – to build even a single floating colony in Venus’ atmosphere.
Still, if we find ourselves in a position to do so, Venus could very become the home of “Cloud Cities”, where carbon dioxide gas is processed and turned into super-materials for export. And these cities could serve as a base for slowly introducing “The Big Rain” to Venus, eventually turning into the kind of world that could truly live up to the name “Earth’s sister planet”.
And if you liked the video posted above, come check out our Patreon page and find out how you can get these videos early while helping us bring you more great content!


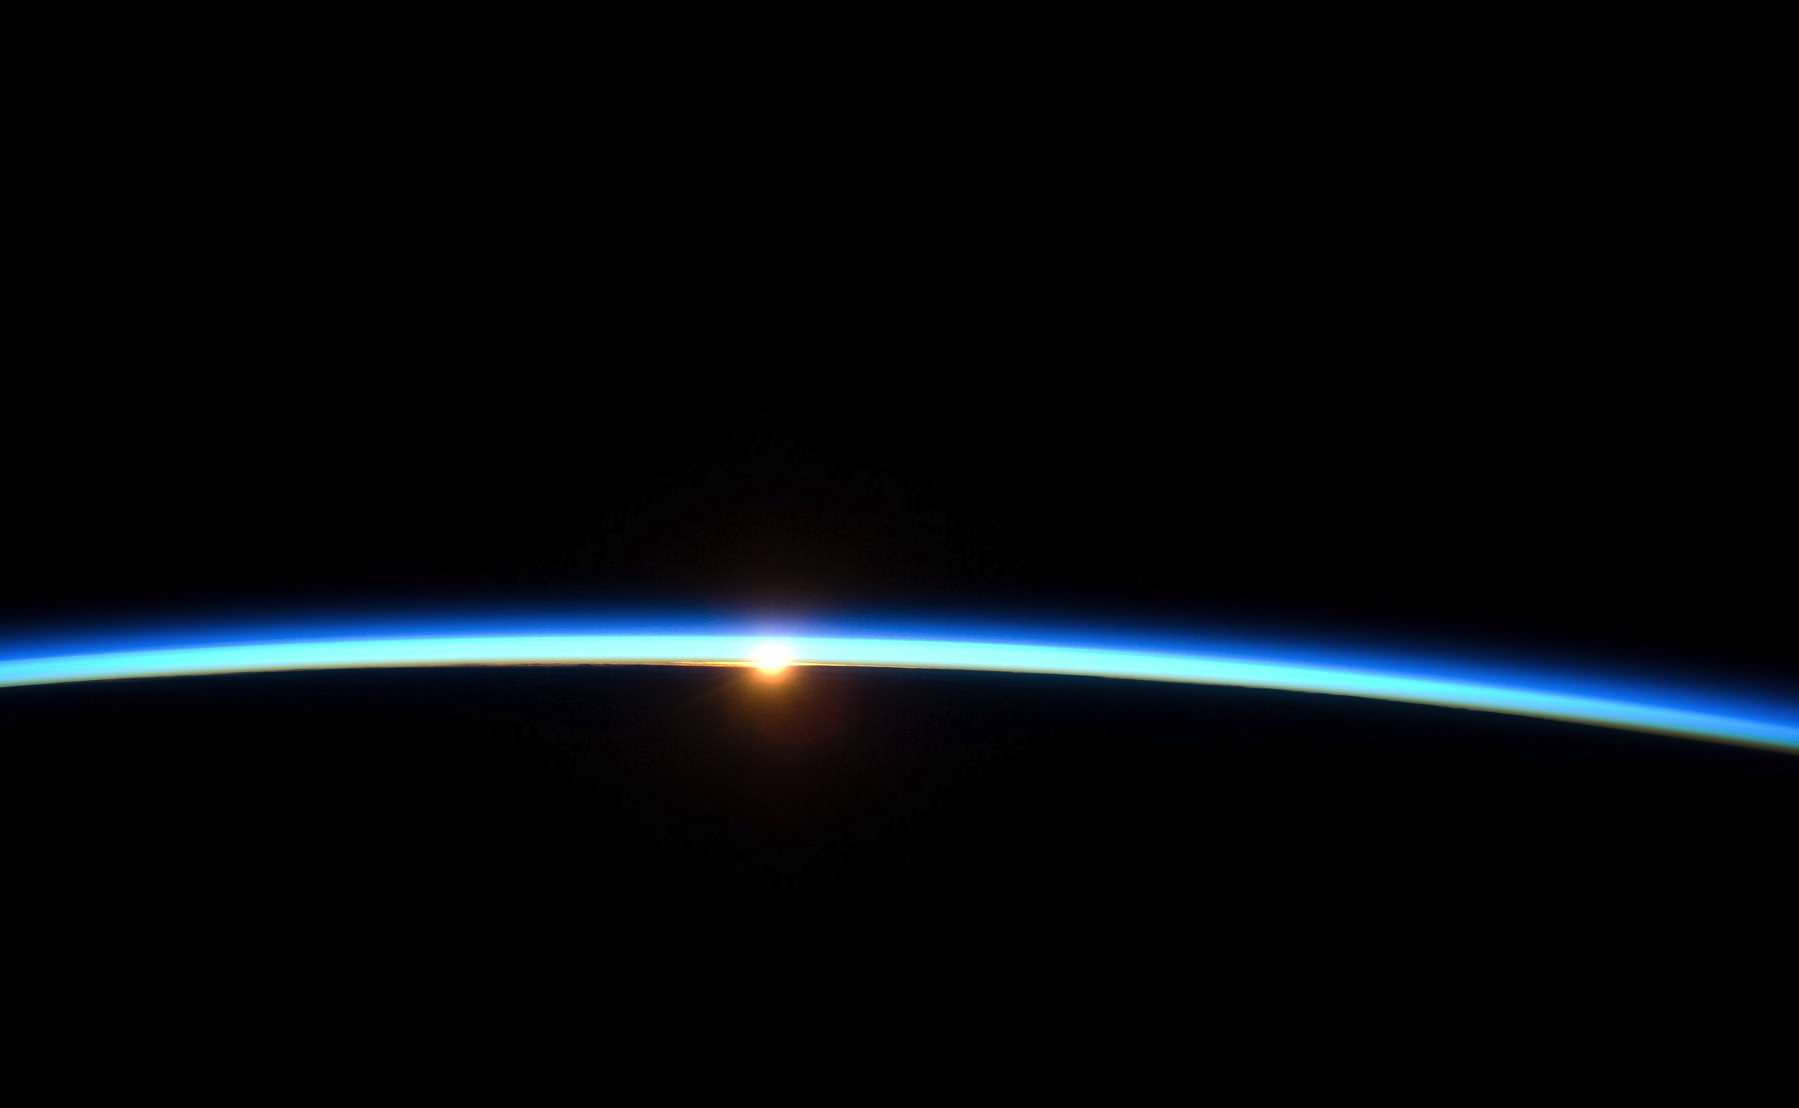

![Space Shuttle Endeavour sillouetted against the atmosphere. The orange layer is the troposphere, the white layer is the stratosphere and the blue layer the mesosphere.[1] (The shuttle is actually orbiting at an altitude of more than 320 km (200 mi), far above all three layers.) Credit: NASA](https://www.universetoday.com/wp-content/uploads/2012/03/Endeavour_silhouette_STS-130.jpg)