Falcon Heavy Vs. Saturn V

The Saturn V (left) and the Falcon Heavy (right). Credit: NASA/SpaceX

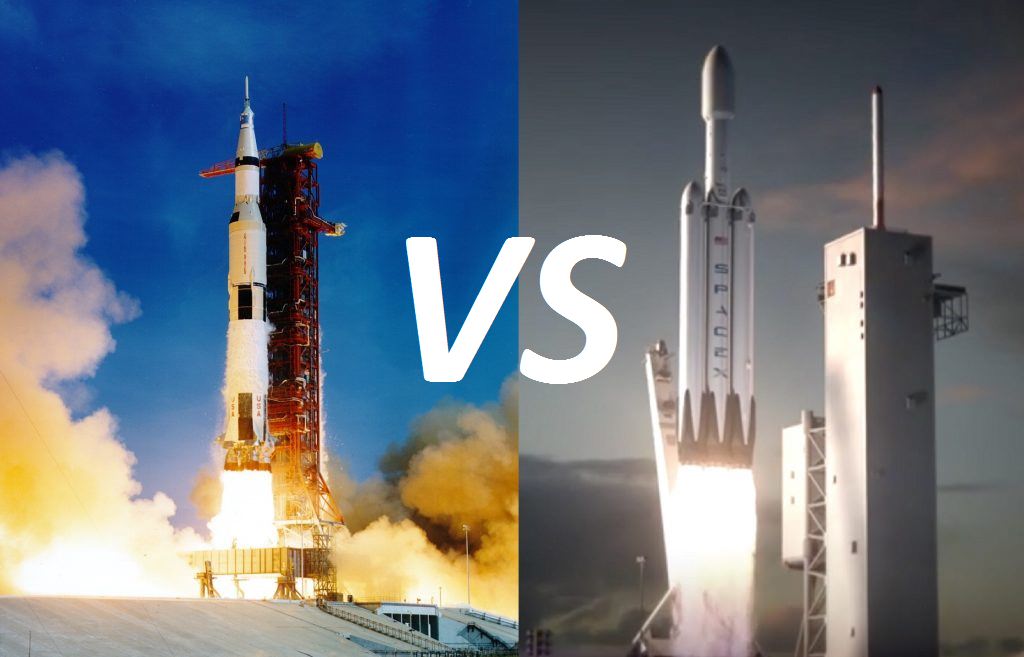
Its an Epic Rocket Battle! Or a Clash of the Titans, if you will. Except that in this case, the titans are the two of the heaviest rockets the world has ever seen. And the contenders couldn’t be better matched. On one side, we have the heaviest rocket to come out of the US during the Space Race, and the one that delivered the Apollo astronauts to the Moon. On the other, we have the heaviest rocket created by the NewSpace industry, and which promises to deliver astronauts to Mars.

And in many respects, the Falcon Heavy is considered to be the successor of the Saturn V. Ever since the latter was retired in 1973, the United States has effectively been without a super-heavy lifter. And with the Space Launch System still in development, the Falcon Heavy is likely to become the workhorse of both private space corporations and space agencies in the coming years.

So let’s compare these two rockets, taking into account their capabilities, specifications, and the history of their development and see who comes out on top. BEGIN!

Launch of the modified Saturn V rocket carrying the Skylab space station. Credit: NASA

Development History:

The development of the Saturn V began in 1946 with Operation Paperclip, a US government program which led to the recruitment of Wernher von Braun and several other World War II-era German rocket scientists and technicians. The purpose of this program was to leverage the expertise of these scientists to give the US an edge in the Cold War through the development of intercontinental ballistic missiles (ICBMs).

Between 1945 and the mid-to-late 50s von Braun acted as an advisor to US armed forces for the sake of developing military rockets only. It was not until 1957, with the Soviet launch of Sputnik-1 using an R-7 rocket – a Soviet ICBM also capable of delivering thermonuclear warheads –  that the US government began to consider the use of rockets for space exploration.

Thereafter, von Braun and his team began developing the Jupiter series of rockets –  a modified Redstone ballistic missile with two solid-propellant upper stages. These proved to be a major step towards the Saturn V, hence why the Jupiter series was later nicknamed “an infant Saturn”. Between 1960 and 1962, the Marshall Space Flight Center began designing the rockets that would eventually be used by the Apollo Program.

After several iterations, the Saturn C-5 design (later named the Saturn V) was created. By 1964, it was selected for NASA’s Apollo Program as the rocket that would conduct a Lunar Orbit Rendezvous (LRO). This plan called for a large rocket to launch a single spacecraft to the Moon, but only a small part of that spacecraft (the Lunar Module) would actually land on the surface. That smaller module would then rendezvous with the main spacecraft – the Command/Service Module (CSM) – in lunar orbit and the crew would return home.

A Saturn IV launching the historic Apollo 11 mission. Image: NASA/Michael Vuijlsteke. Public Domain image.
A Saturn V launching the historic Apollo 11 mission. Credit: NASA/Michael Vuijlsteke. Public Domain image.

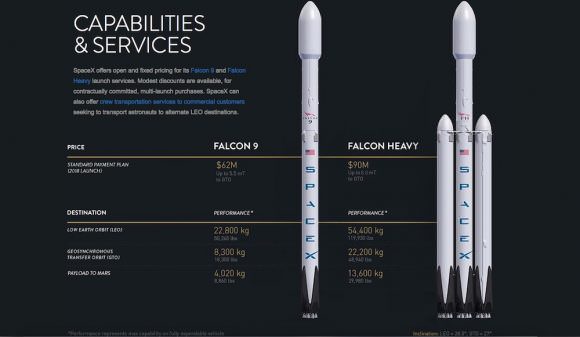
Development of the Falcon Heavy was first announced in 2011 at the National Press Club in Washington D.C. In a statement, Musk drew direct comparisons to the Saturn V, claiming that the Falcon Heavy would deliver “more payload to orbit or escape velocity than any vehicle in history, apart from the Saturn V moon rocket, which was decommissioned after the Apollo program.”

Consistent with this promise of a “super heavy-lift” vehicle, SpaceX’s original specifications indicated a projected payload of 53,000 kg (117,000 lbs) to Low-Earth Orbit (LEO), and 12,000 kgg (26,000 lbs) to Geosynchronous Transfer Orbit (GTO). In 2013, these estimates were revised to 54,400 kg (119,900 lb) to LEO and 22,200 kg (48,900 lb) to GTO, as well as 16,000 kilograms (35,000 lb) to translunar trajectory, and 13,600 kilograms (31,000 lb) on a trans-Martian orbit to Mars, and 2,900 kg (6,400 lb) to Pluto.

In 2015, the design was changed – alongside changes to the Falcon 9 v.1.1 – to take advantage of the new Merlin 1D engine and changes to the propellant tanks. The original timetable, proposed in 2011, put the rocket’s arrival at SpaceX’s west-coast launch location – Vandenberg Air Force Base in California – at before the end of 2012.

The first launch from Vandenberg was take place in 2013, while the first launch from Cape Canaveral was to take place in late 2013 or 2014. But by mid-2015, delays caused by failures with Falcon 9 test flights caused the first launch to be pushed to late 2016. The rocket has also been relocated to the Kennedy Space Center Launch Complex in Florida.

Artist's concept of the SpaceX Red Dragon spacecraft launching to Mars on SpaceX Falcon Heavy as soon as 2018. Credit: SpaceX
Artist’s concept of the SpaceX Red Dragon spacecraft launching to Mars on SpaceX Falcon Heavy as soon as 2018. Credit: SpaceX

SpaceX also announced in July 0f 2016 that it planned to expand its landing facility near Cape Canaveral to take advantage of the reusable technology. With three landing pads now planned (instead of one on land and a drone barge at sea), they hope to be able to recover all of the spent boosters that will be used for the launch of a Falcon Heavy.

Design:

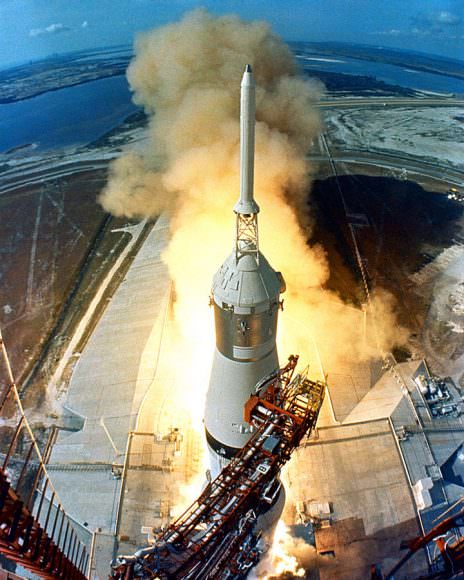
Both the Saturn V and Falcon Heavy were created to do some serious heavy lifting. Little wonder, since both were created for the sole purpose of “slipping the surly bonds” of Earth and putting human beings and cargo onto other celestial bodies. For its part, the Saturn V‘s size and payload surpassed all other previous rockets, reflecting its purpose of sending astronauts to the Moon.

With the Apollo spacecraft on top, it stood 111 meters (363 feet) tall and was 10 meters (33 feet) in diameter, without fins. Fully fueled, the Saturn V weighed 2,950 metric tons (6.5 million pounds), and had a payload capacity estimated at 118,000 kg (261,000 lbs) to LEO, but was designed for the purpose of sending 41,000 kg (90,000 lbs) to Trans Lunar Insertion (TLI).

Later upgrades on the final three missions boosted that capacity to 140,000 kg (310,000 lbs) to LEO and 48,600 kg (107,100 lbs) to the Moon. The Saturn V was principally designed by NASA’s Marshall Space Flight Center in Huntsville, Alabama, while numerous subsystems were developed by subcontractors. This included the engines, which were designed by Rocketdyne, a Los Angeles-based rocket company.

Diagram of Saturn V Launch Vehicle. Credit: NASA/MSFC

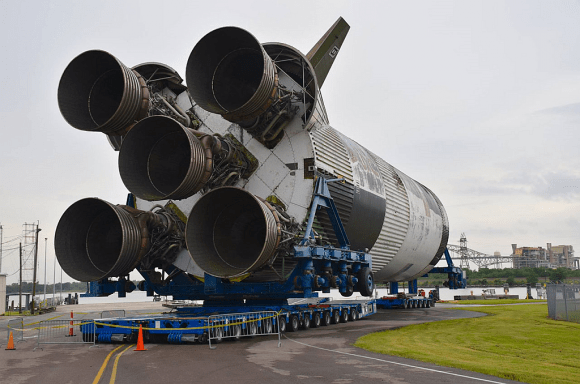
The first stage (aka. S-IC) measured 42 m (138 feet) tall and 10 m (33 feet) in diameter, and had a dry weight of 131 metric tons (289,000 lbs) and a total weight of over 2300 metric tons (5.1 million lbs) when fully fueled. It was powered by five Rocketdyne F-1 engines arrayed in a quincunx (four units arranged in a square, and the fifth in the center) which provided it with 34,000 kN (7.6 million pounds-force) of thrust.

The Saturn V consisted of three stages – the S-IC first stage, S-II second stage and the S-IVB third stage – and the instrument unit. The first stage used Rocket Propellant-1 (RP-1), a form of kerosene similar to jet fuel, while the second and third stages relied on liquid hydrogen for fuel. The second and third stage also used solid-propellant rockets to separate during launch.

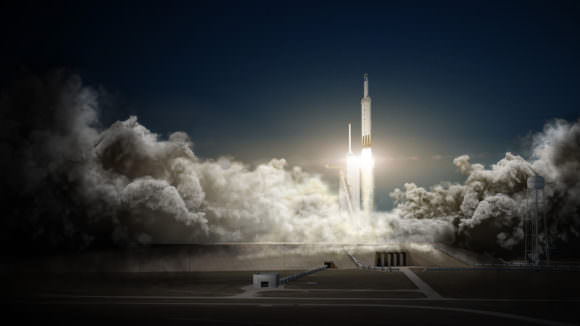
The Falcon Heavy is based around a core that is a single Falcon 9 with two additional Falcon 9 first stages acting as boosters. While similar in concept to the Delta IV Heavy launcher and proposals for the Atlas V HLV and Russian Angara A5V, the Falcon Heavy was specifically designed to exceed all current designs in terms of operational flexibility and payload. As with other SpaceX rockets, it was also designed to incorporate reusability.

The rocket relies on two stages, with the possibility of more to come, that measure 70 m (229.6 ft) in height and 12.2 m (39.9 ft) in width. The first stage is powered by three Falcon 9 cores, each of which is equipped with nine Merlin 1D engines. These are arranged in a circular fashion with eight around the outside and one in th middle (what SpaceX refers to as the Octaweb) in order to streamline the manufacturing process. Each core also includes four extensible landing legs and grid fins to control descent and conduct landings.

Chart comparing SpaceX's Falcon 9 and Falcon Heavy. Credit: SpaceX
Chart comparing SpaceX’s Falcon 9 and Falcon Heavy rocket. Credit: SpaceX

The first stage of the Falcon Heavy relies on Subcooled LOX (liquid oxygen) and chilled RP-1 fuel; while the upper stage also uses them, but under normal conditions. The Falcon Heavy has a total sea-level thrust at liftoff of 22,819 kN (5,130,000 lbf) which rises to 24,681 kN (5,549,000 lbf) as the craft climbs out of the atmosphere. The upper stage is powered by a single Merlin 1D engine which has a thrust of 34 kN (210,000 lbf) and has been modified for use in a vacuum.

Although not a part of the initial Falcon Heavy design, SpaceX has been extending its work with reusable rocket systems to ensure that the boosters and core stage can be recovered. Currently, no work has been announced on making the upper stages recoverable as well, but recent successes recovering the first stages of the Falcon 9 may indicate a possible change down the road.

The consequence of adding reusable technology will mean that the Falcon Heavy will have a reduced payload to GTO. However, it will also mean that it will be able to fly at a much lower cost per launch. With full reusability on all three booster cores, the GTO payload will be approximately 7,000 kg (15,000 lb). If only the two outside cores are reusable while the center is expendable, the GTO payload would be approximately 14,000 kg (31,000 lb).

Cost:

The Saturn V rocket was by no means a small investment. In fact, one of the main reasons for the cancellation of the last three Apollo flights was the sheer cost of producing the rockets and financing the launches. Between 1964 and 1973, a grand total of $6.417 billion USD was appropriated for the sake of research, development, and flights.

Looking at the business end of the Saturn V as it gets moved towards the barge that will transport it to Mississippi. Image: Infinity Science Center.
A Saturn V rocket viewed from the rear, showing its five Rocketdyne F-1 engines. Credit: Infinity Science Center

Adjusted to 2016 dollars, that works out to $41.4 billion USD. In terms of individual launches, the Saturn V would cost between $185 and $189 million USD, of which $110 million was spent on production alone. Adjusted for inflation, this works out to approximately $1.23 billion per launch, of which $710 million went towards production.

By contrast, when Musk appeared before the US Senate Committee on Commerce, Science and Transportation in May 2004, he stated that his ultimate goal with the development of SpaceX was to bring the total cost per launch down to $1,100 per kg ($500/pound). As of April 2016, SpaceX has indicated that a Falcon Heavy could lift 2268 kg (8000 lbs) to GTO for a cost of $90 million a launch – which works out to $3968.25 per kg ($1125 per pound).

No estimates are available yet on how a fully-reusable Falcon Heavy will further reduce the cost of individual launches. And again, it will vary depending on whether or not the boosters and the core, or just the external boosters are recoverable. Making the upper stage recoverable as well will lead to a further drop in costs, but will also likely impact performance.

Specifications:

So having covered their backgrounds, designs and overall cost, let’s move on to a side-by-side comparison of these two bad boys. Let’s see how they stack up, pound for pound, when all things are considered – including height, weight, lift payload, and thrust.

Saturn V: Falcon Heavy:
Height: 110.6 m (363 ft) 70 m (230 ft)
Diameter: 10.1 m (33 ft) 12.2 m (40 ft)
Weight: 2,970,000 kg
(6,540,000 lbs)
1,420,788 kg
(3,132,301 lb)
Stages:  3  2+
Engines
(1st Stage):
5 Rocketdyne F-1 3 x 9 Merlin 1D
   2nd stage 5 Rocketdyne J-2 1 Merlin 1D
   3rd stage 1 Rocketdyne J-2
Thrust
(1st stage):
34,020 kN

22,918 kN (sea level);
24,681 kN (vacuum)

   2nd stage 4,400 kN 934 kN
   3rd stage 1,000 kN
Payload (LEO): 140,000 kg
(310,000 lbs)
54,400 kg
(119,900 lbs)
Payload (TLI):  48,600 kg
(107,100 lbs)

 16,000 kg
(35,000 lbs)

When put next to each other, you can see that the Saturn V has the advantage when it comes to muscle. It’s bigger, heavier, and can deliver a bigger payload to space. On the other hand, the Falcon Heavy is smaller, lighter, and a lot cheaper. Whereas the Saturn V can put a heavier payload into orbit, or send it on to another celestial body, the Falcon Heavy could perform several missions for every one mounted by its competitor.

But whereas the contributions of the venerable Saturn V cannot be denied, the Falcon Heavy has yet to demonstrate its true worth to space exploration. In many ways, its like comparing a retired champion to an up-and-comer who, despite showing lots of promise and getting all the headlines, has yet to win a single bout.

But should the Falcon Heavy prove successful, it will likely be recognized as the natural successor to the Saturn V. Ever since the latter was retired in 1973, NASA has been without a rocket with which to mount long-range crewed missions. And while heavy-lift options have been available – such as the Delta IV Heavy and Atlas V – none have had the performance, payload capacity, or the affordability that the new era of space exploration needs.

In truth, this battle will take several years to unfold. Only after the Falcon Heavy is rigorously tested and SpaceX manages to deliver on their promises of cheaper space launches, a return to the Moon and a mission to Mars (or fail to, for that matter) will we be able to say for sure which rocket was the true champion of human space exploration! But in the meantime, I’m sure there’s plenty of smack talk to be had by fans of both! Preferably in a format that rhymes!

Further Reading: NASA, SpaceX

And a tip of the hat to ERB!

How Big is the Great Red Spot?

How Big is the Great Red Spot?

https://www.youtube.com/watch?v=_ABKMoWKHjo

When we used to do the Virtual Star Party (and I really need to start those up again, they were super fun), I had the worst luck with Jupiter’s Great Red Spot. Whenever Jupiter was in the sky, the Great Red Spot always eluded us. Even though we should have had a 50/50 shot at seeing the massive storm on Jupiter, it was always hiding. Why so shy Jovian storm?

Jupiter’s Great Red Spot is an enormous swirling storm located on a band of clouds just south of the planet’s equator. It’s been there as long as people have been observing Jupiter with good enough telescopes to resolve it.

Astronomers somewhat disagree exactly when that was. The first person to mention a spot on Jupiter was Robert Hooke, who described it in 1664, but he placed it in the northern hemisphere. Oops.

A more reliable account comes from Giovanni Cassini, best known for his observations of Saturn. He observed a permanent spot in roughly the same location from 1665 to 1713.

Drawings by Cassini of what is presumably the Great Red Spot in 1665

The strange part is that astronomers lost track of it until 1830, when the modern Spot we know today was clearly evident. Were they two different spots? Did the GRS disappear and the flare up again? We’ll never know.

But really, isn’t that just splitting hairs? The thought that there’s been an enormous Jovian hurricane swirling away for hundreds of years is awesome and terrifying.

Here on Earth, we classify hurricanes as Category 1 when the wind speed crosses 119 km/h. A Category 4 hurricane can hit more than 250 km/h. That’s scary fast wind speed that can tear apart buildings. The Great Red Spot, on the other hand, can reach almost 650 km/h.

How big is this thing, anyway? Trust me, it’s big, but it used to be bigger. When astronomers first started keeping accurate measurements in the late 1800s, the Great Red Spot was about 40,000 kilometers wide and 14,000 kilometers tall.

Since that time, it’s been steadily shrinking. When the Voyager spacecraft flew past in the late 1970s, the spot had shrunk to 23,000 kilometers across. In 1995 Hubble measured it as 21,000 kilometers across, and then again in 2009, it was 18,000 kilometers across. About a year ago, Hubble did another measurement, and now it’s only 16,500 kilometers wide.

I say “only”, but keep in mind that the Earth measures 12,742 kilometers across. In other words, the Great Red Spot could still swallow up an Earth with room to spare.

The Juno spacecraft isn't the first one to visit Jupiter. Galileo went there in the mid 90's, and Voyager 1 snapped a nice picture of the clouds on its mission. Image: NASA
The Juno spacecraft isn’t the first one to visit Jupiter. Galileo went there in the mid 90’s, and Voyager 1 snapped a nice picture of the clouds on its mission. Image: NASA

But this shrinking is continuing by about 930 kilometers per year. And as it shrinks, it’s changing from an oval to a more circular shape. At the same time, the color is changing too, lightening up – perhaps because the storm doesn’t dig too deeply into the lower atmospheric layers.

It’s possible that the Great Red Spot could completely disappear within our generation. And then every astronomer would fail to be able to see the Spot, just like me.

The Great Red Spot isn’t the only long lived storm on Jupiter, and this could be the reason why the Spot is disappearing.

If you look at images of Jupiter from Hubble, you can see other cyclonic storms; the biggest of which is known as Oval BA. It was first observed in 2000, after a few smaller storms collided and merged into a little red spot.

The formation of Oval BA. Credit: NASA/JPL/WFPC2

Over time, Oval BA has been getting larger and stronger, now it’s about the size of the Earth, and wind speeds have reached more than 600 km/h rivalling the Great Red Spot.

Because the bands on Jupiter alternate in directions, astronomers think that storms on the nearby bands are sapping the strength of the Great Red Spot. And perhaps they’re boosting Oval BA. There might be a time when the two spots are roughly the same size. And when the Great Red Spot finally disappears, Oval BA will be there to assume the mantle.

Since these storms can clearly grow and shrink over hundreds of years, I wonder what some of the strangest configurations of storms have ever been. I guess future robot-body Fraser will be the one to find out.

Good news! At the time that you’re watching this, NASA’s Juno spacecraft arrived at Jupiter on July 4, 2016. For the first time in more than a decade, we have a dedicated spacecraft at Jupiter, mapping, probing and analyzing the giant planet.

We should be getting more close up measurements and observations of the Great Red Spot and everything Jovian, so stay tuned, it’s going to be exciting.

How Fast Does Venus Rotate?

The planet Venus, as imaged by the Magellan 10 mission. Credit: NASA/JPL
The planet Venus, as imaged by the Magellan 10 mission. The planet's inhospitable surface makes exploration extremely difficult. Credit: NASA/JPL

Venus is often refereed to as “Earth’s sister planet”, thanks to the number of things it has in common with our planet. As a terrestrial planet, it is similarly composed of silicate rock and metals – which are differentiated between a metal core and a silicate crust and mantle. It also orbits within our Sun’s habitable zone, and had a similarly violent volcanic past.

But of course, there are also some major differences between our two planets. For one, Venus has an atmosphere that is incredibly dense (92 times that of Earth, in fact) and reaches temperatures that are hot enough to melt lead. In addition, the planet’s rotation is immensely slow by comparison, taking 243.025 days to complete a single rotation, and rotating backwards relative to Earth.

When discussing Venus’ rotation, it is important to note certain distinctions. Rotation is the time it takes for a planet to spin once on its axis. This is different from a planet’s revolution, which is the time it takes for a planet to orbit around another object (i.e. the Sun).  So while it takes the Earth one day (24 hours) to rotate once on its axis, it takes one year (365.256 days) to revolve once around the Sun.

Earth and Venus' orbit compared. Credit: Sky and Telescope
Earth and Venus’ orbit compared. Credit: Sky and Telescope

Orbital Period:

In Venus’ case, things work a little differently. For starters, it orbits the Sun at an average distance of about 0.72 AU (108,000,000 km; 67,000,000 mi) with almost no eccentricity. In fact, with its farthest orbit (aphelion) of 0.728 AU (108,939,000 km) and closest orbit (perihelion) of 0.718 AU (107,477,000 km), it has the most circular orbit of any planet in the Solar System.

The planet completes a revolution around the Sun every 224.65 Earth days, which means that a year on Venus last about 61.5% as long as a year on Earth. Evey 584 days, Venus completes an interior conjunction, where it lies between Earth and the Sun. It is at this point that Venus makes the closest approach to Earth of any planet, at an average distance of 41 million km.

Rotational Period:

Unlike most other planets in the Solar System, which rotate on their axes in an counter-clockwise direction, Venus rotates clockwise (called “retrograde” rotation). It also rotates very slowly, taking 243.025 Earth days to complete a single rotation. This is not only the slowest rotation period of any planet, it also means that a single day on Venus lasts longer than a Venusian year.

Phases of Venus during 2004 photographed through a telescope. When very close to inferior conjunction (bottom right) the crescent is seen to extend fully around the planet. Credit: Statis Kalyva / Wikipedia

And, as noted earlier, Venus’ rotation is backwards, relative to Earth and the other bodies in the Solar System. Technically, this means that its rotational period is -243,025 days. It also means that if you could view the Solar System from the position above its celestial north pole, all of the planets (except for Uranus, which rotates on its side!) would appear to be rotating clockwise.

Venus, however, would appear to be rotating in a clockwise direction. Because of this, if you could stand on the surface of Venus, you would witness the Sun rising in the west and setting in the east. But you would be waiting a very long time to see this happen! Read on to find out why…

Sidereal vs. Solar Day:.

Another important thing to consider is the difference between a sidereal day and a solar day. A sidereal day corresponds to the amount of time it takes for a planet to rotate once on its axis, which in Venus’ case takes 243.025 Earth days. A solar day, by contrast, refers to the amount of time it takes for the Sun to reappear at the same point in the sky (i.e. between one sunrise/sunset and the next).

A Venusian (aka. Cytherean) Solar Day is the equivalent to 116.75 days on Earth, which means that it takes almost 117 days for the sun to rise, set, and return to the same place in the sky. Doing the math, we then see that a single year on Venus (224.65 Earth days) works out to just 1.92 Venusian (solar) days. Not exactly the basis for a good calendar system, is it?

Another view from the Solar Dynamics Observatory as Venus moves across the face of the Sun. Credit: NASA/SDO
View of Venus from the Solar Dynamics Observatory. If viewed from the surface of Venus, the Sun would be moving from west to east in the sky. Credit: NASA/SDO

Yes, when it comes to the planet Venus, things work quite differently than they do here on Earth. Not only does a day last over half a year on our “Sister Planet”, but the Sun rises and sets on the opposite horizons, and travels across the sky in the opposite direction. The reason for this, according to astronomers, is that billions of years ago (early in the planet’s history) Venus was impacted by another large planet.

The combined momentum between the two objects averaged out to the current rotational speed and direction, causing Venus to spin very slowly in its current retrograde motion. Someday, if human beings colonize there (perhaps in floating cities) they will have to learn to get used to a day that lasts over 2800 Earth hours, not to mention sunrises and sunsets happening on the wrong horizon!

We have written many interesting articles about Venus here at Universe Today. Here’s Interesting Facts About Venus, How Long is a Day on Venus?, How Long is a Year on Venus?, What is the Average Surface Temperature on Venus?, New Map Hints at Venus’ Wet, Volcanic Past and Venus Compared to Earth.

Want more information on Venus? Here’s a link to Hubblesite’s News Releases about Venus, and here’s a link to NASA’s Solar System Exploration Guide on Venus.

We have recorded a whole episode of Astronomy Cast that’s only about planet Venus. Listen to it here, Episode 50: Venus.

What Does the Universe Do When We’re Not Looking?

What Does the Universe Do When We're Not Looking?

If you follow some of my other shows, like Astronomy Cast and the Weekly Space Hangout. Of course you do, what a ridiculous thing to say… “if”. Anyway, since you follow those other shows, you know I’m currently obsessed with an upcoming observatory called the Large Synoptic Survey Telescope.

Obsessions are best when they’re shared. So today, I invite you to become as obsessed as I am about the LSST.

In the past, astronomers focused on building bigger telescopes at more remote locations so they could peer more deeply into the past, to resolve the faintest objects, to see right to the edge of the observable Universe.

But there’s a whole other dimension to the Universe: time. And by taking advantage of time, astronomers have made some of the most momentous discoveries in the history of astronomy.

The Large Synoptic Survey Telescope is all about time. Watching the sky over and over, night after night, watching for anything that changes.

 Credit: Large Synoptic Survey Telescope (CC-SA 4.0)
Credit: Large Synoptic Survey Telescope (CC-SA 4.0)

First, let’s talk about some of the kinds of discoveries that can be made when you’re watching the sky for changes.

Perhaps the best example of this is the Mira Variable. These are red giants at the very end of their stellar evolution, almost out of usable hydrogen to burn in their cores. As their stellar flame flickers out, the light pressure can no longer hold against the gravity pulling the star inward. The star compresses in on itself, raising the temperature and pressure, allowing more fusion. It flares up again, and brightens in our sky.

Astronomers discovered that there’s a very specific relationship to the brightness and rate that this brightening happens. In other words, if you know how often a Mira variable flares up, you know how intrinsically bright it is. And if you know how bright it is, you can calculate how far away it is. Even in other galaxies.

That’s what Edwin Hubble did when he surveyed Mira variables in other galaxies. He discovered that most galaxies are actually speeding away from us in all directions, leading to the theory of the Big Bang.

Thanks to time, we understand that we life in an expanding Universe that originated from a single point, 13.8 billion years ago.

Let me give you another example: the discovery of gamma ray bursts. In the 1960s, the US launched a group of satellites as part of the Vela Mission. They had no astronomical purpose, they were designed to watch for the specific gamma ray signature from an unauthorized nuclear weapons test. But instead of nuclear explosions, they detected massive blasts of gamma radiation coming from deep space. These blasts only last for a few seconds and then fade away, leaving a faint afterglow that also fades.

Artist’s impression of a gamma-ray burst. Credit: ESO/A. Roquette

We now know that gamma ray bursts mark the deaths of the largest stars in the Universe, and the formations of new black holes. Other gamma ray bursts signal the collisions of exotic stellar remnants, like neutron stars and white dwarfs.

I can give you many more examples, where the dimension of time lead to a discovery in astronomy:

In 1930, Clyde Tombaugh compared pairs of photographic plates, switching back and forth over and over, looking for any object that moved position. This was how he discovered Pluto. In fact, this same technique is used by astronomers to find other dwarf planets, asteroids and comets to this day.

Astronomers return again and again to galaxies in the night sky, looking for any that have a new star in them. This is a tell tale sign of a supernova, the explosion of a star much more massive than our Sun. Some of these supernovae allowed astronomers to discover dark energy, that the expansion of the Universe is accelerating.

This is what time can help us discover.

Artist rendering of the LSST observatory (foreground) atop Cerro Pachón in Chile. Credit: Large Synoptic Survey Telescope Project Office.

Now, on to the Large Synoptic Survey Telescope. The observatory is currently under construction in north-central Chile, where many of the world’s most powerful telescopes are located.

Its main mirror is 8.4 meters across. Just for comparison, ESO’s Very Large Telescopes are 8.2 metres across. The Gemini Observatories are 8.1 metres across. The Keck Observatory is 10 metres wide. What I’m saying here, is that the LSST is plenty big.

But that’s not its most important feature. LSST is fast. When I say fast, I’m saying this in the astronomical sense, which means that it can gather a lot of light over a wide area on the sky in a very short amount of time. While Keck, for example, can focus incredibly deeply at a tiny spot in the sky, LSST gulps light across a huge region of the sky.

It’ll be able to see 3.5-degrees of the sky, every time it takes a picture. The Sun and the Moon are about 0.5-degrees across in the sky, so imagine a grid 7 moons across and 7 moons high.

Suzanne Jacoby with the LSST focal plane array scale model. The image of the moon (30 arcminutes) is placed there for scale of the Field of View. Credit: Large Synoptic Survey Telescope (CC-SA 4.0)

It’ll take a 15-second exposure every 20 seconds. In the amount of time you’ll spend watching this video, the LSST could have taken dozens of high resolution images of the sky.

In fact, it’ll completely image the available sky every few nights. And then petabytes of data will be released onto the internet, available for astronomers to pore over.

Want to find asteroids, just look through the LSST records. Want to know how fast the Universe is expanding, dig through the data. LSST is going to look everywhere and anywhere every couple of nights, and then provide this data to scientists to make discoveries.

Assuming the construction isn’t delayed, the Large Synoptic Survey Telescope should see first light in 2019. Shortly after that, it’ll be disgorging mountains of astronomical data onto the internet.

And shortly after that, I suspect, we’ll start to hear everything the Universe was doing when we weren’t watching before. Because now, thanks to LSST, we’ll be watching all the time.

Messier 19 (M19) – The NGC 6273 Globular Cluster

Messier Object 19, as imaged with an amateur telescope.Credit: Hewholooks/Wikipedia Commons

Welcome back to Messier Monday! In our ongoing tribute to the great Tammy Plotner, we take a look at the Messier 19 globular star cluster. Enjoy!

In the 18th century, while searching the night sky for comets, French astronomer Charles Messier began noticing a series of “nebulous objects” in the night sky. Hoping to ensure that other astronomers did not make the same mistake, he began compiling a list of these objects,. Known to posterity as the Messier Catalog, this list has come to be one of the most important milestones in the research of Deep Sky objects.

One of these objects is Messier 19, a globular star cluster located in the constellation Ophiuchus. Of all the known globular clusters, M19 appears to be one of the most oblate (i.e. flattest) in the night sky. Discovered by William Herschel, this cluster is relatively difficult to spot with the naked eye, and appears as a fuzzy point of light with the help of magnification.

Description:

Speeding away from us at a rate of 146 kilometers per second, this gravitationally bound ball of stars measuring 140 light years in diameter, is one of the Messier globular clusters that has the distinction of being closest to the center of the Milky Way. At a little more than 5000 light-years from the intense gravitation of our own galactic core, it has played havoc on M19’s round shape.

In essence, Milky Way’s gravity has caused M19 to become one of the most oblate of all globular clusters, with twice as many stars along the major axis as along the minor. And, although it is 28,000 light-years from Earth, it’s actually on the opposite side of the galactic core. For all of its rich, dense mass, four RR Lyrae variable stars have been found in M19.

The constellation Ophiuchis. Credit: iau.org

Is Messier 19 unique? It has some stellar branch properties that are difficult to pinpoint. And even its age (though estimated at around 11.9 billion years old) is indeterminate. Says F. Meissner and A. Weiss in their 2006 study, “Global fitting of globular cluster age indicators“:

“The determination of globular cluster (GC) ages rests on the fact that colour-magnitude diagrams (CMDs) of single-age single composition stellar populations exhibit specific time-dependent features. Most importantly, this is the location of the turn-off (TO), which – together with the cluster’s distance – serves as the most straightforward and widely used age indicator. However, there are other parts of the CMD that change their colour or brightness with age, too. Since the sensitivity to time is different for the various parts of the cluster CMD, it is possible to use either the various indicators independently, or the differences in colour and brightness between pairs of them; these latter methods have the advantage of being independent of distance.”

What’s occurring is a horizontal branch gap – an not-quite explainable difference in the way the stars inside M19 are aging. However, science is looking for the answer. As G. Busso et al. explained in their 2008 paper titled “The Peculiar Horizontal Branch Morphology of the Galactic Globular Clusters NGC 6388 and NGC 6441“:

“I show that a possible solution of the puzzle is to assume that a small fraction of the stellar population in the two clusters is strongly helium enriched. The presence of two distinct stellar populations characterized by two different initial He contents can help in explaining the brightness difference between the red portion of the HB and the blue component.”

The Messier 19 globular cluster, as viewed by the Two Micron All-Sky Survey (2MASS). Credit: 2MASS/ipac.caltech.edu

Is helium the answer? Quite probably so. M. Salaris Astrophysics Research Institute and an international team of researchers explained in their 2004 study “The initial helium abundance of the Galactic globular cluster system“:

“Based on a recently updated set of stellar evolution models, we performed an accurate statistical analysis in order to assess whether GGCs show a statistically significant spread in their initial He abundances, and whether there is a correlation with the cluster metallicity. As in previous works on the subject, we do not find any significant dependence of the He abundance on the cluster metallicity; this provides an important constraint for models of Galaxy formation and evolution. Apart from GGCs with the bluest Horizontal Branch morphology, the observed spread in the individual helium abundances is statistically compatible with the individual errors. This means that either there is no intrinsic abundance spread among the GGCs, or that this is masked by the errors. In the latter case we have estimated a firm upper limit of 0.019 to the possible intrinsic spread. In case of the GGCs with the bluest Horizontal Branch morphology we detect a significant spread towards higher abundances inconsistent with the individual errors; this can be fully explained by additional effects not accounted for in our theoretical calibrations, which do not affect the abundances estimated for the clusters with redder Horizontal Branch morphology.”

History of Observation:

M19 was one of Charles Messier’s original discoveries, which he first observed on June 5th, 1764. In his notes, he wrote:

“I have discovered a nebula, situated on the parallel of Antares, between Scorpius and the right foot of Ophiuchus: that nebula is round & doesn’t contain any star; I have examined it with a Gregorian telescope which magnified 104 times, it is about 3 minutes of arc in diameter: one sees it very well with an ordinary refractor of 3 feet and a half. I have observed its passage of the Medirian, and compared it with that of the star Antares; I have determined the right ascension of that nebula of 252d 1′ 45″, and its declination of 25d 54′ 46″ south. The known star closest to that nebula is the 28th of the constellation Ophiuchus, after the catalog of Flamsteed, of sixth magnitude.”

Messier 19 and Antares. Credit: Wikisky
The Messier 19 globular cluster, relative to M4, M80 and Antares. Credit: Wikisky

While Charles didn’t resolve it, we must give him due credit for discovery, for its size wouldn’t make it a particularly easy object given his optics. Later, in 1784, William Herschel would become the first to open up its true identity:

“When the 19th of the Connoiss. is viewed with a magnifying power of 120, the stars are visible; the cluster is insulated; some of the small stars scattered in the neighborhood are near it; but they are larger than those belonging to the cluster. With 240 it is better resolved, and is much condensed in the centre. With 300 no nucleus or central body can be seen. The diameter with the 10 feet is 3’16”, and the stars in the centre are too accumulated to be separately seen. It will not be necessary to add that the two last mentioned globular clusters, viewed with more powerful instruments, are of equal beauty with the rest; and from what has been said it is obvious that here the exertion of a clustering power has brought the accumulation and artificial construction of these wonderful celestial objects to the highest degree of mysterious perfection.”

While you may – or may not – resolve Messier 19’s individual stars, even small telescopes can pick up on some of its ellipticity and larger telescopes will make out a definite blue tinge to its coloration. Before you yawn at viewing another globular cluster, remember that you are looking at the other side of our galactic center and think on the words about M19 from Admiral Symth.

“The whole vicinity,” he wrote, “afford a grand conception of the grandeur and richness even of the exterior creation; and indicate the beautious gradation and variety of the heaven of heavens. Truly has it been said, “Stars teach us as well as shine.” This is near the large opening or hole, about 4deg broad, in the Scorpion’s body, which WH [William Herschel] found almost destitute of stars.”

en:Messier 19 globular cluster by en:Hubble Space Telescope; 2.5? view en:NASA, en:STScI, en:WikiSky - en:WikiSky's
The Messier 19 globular cluster, as imaged by the Hubble Space Telescope. Credit:NASA/STSc /HST/WikiSky

Locating Messier 19:

Finding M19’s location in binoculars is quite easy – it’s less than a fistwidth (8 degrees) east of Antares (Alpha Scorpi). However, ‘seeing’ M19 in binoculars (especially smaller ones) is a little more problematic. The steadier the binoculars are, the better your chances, since it will appear almost stellar at first glance. A good indicator is to have optical double 26 Ophiuchi in the field at the 2:00 position and look for the star that won’t quite come to focus in the 8:00 position.

Star 26 also makes for a great finderscope lead when locating M19 in a telescope as well. Even for aperture sizes as small as 114mm, this globular cluster will show quite easily in a telescope and reveal its oblate nature. When aperture size increase to the 8″ range, it will begin resolution and as it nears 12″ or more, you’ll pick up on blue stars.

And for your convenience, here are the quick facts of M19:

Object Name: Messier 19
Alternative Designations: M19, NGC 6273
Object Type: Class VIII Globular Star Cluster
Constellation: Ophiuchus
Right Ascension: 17 : 02.6 (h:m)
Declination: -26 : 16 (deg:m)
Distance: 28.0 (kly)
Visual Brightness: 6.8 (mag)
Apparent Dimension: 17.0 (arc min)

We have written many interesting articles about Messier Objects here at Universe Today. Here’s Tammy Plotner’s Introduction to the Messier Objects, , M1 – The Crab Nebula, M8 – The Lagoon Nebula, and David Dickison’s articles on the 2013 and 2014 Messier Marathons.

Be to sure to check out our complete Messier Catalog. And for more information, check out the SEDS Messier Database.

Jupiter Compared to Earth

Rough visual comparison of Jupiter, Earth, and the Great Red Spot. Approximate scale is 44 km/px. Credit: NASA/Brian0918/ Wikipedia Commons

Ever since Galileo Galilei first observed Jupiter closely in 1610 using a telescope of his own design, scientists and astronomers have been immensely fascinated by the Jovian planet. Not only is it the Solar System’s largest planet, but there are still things about this world – despite centuries of research and numerous exploration missions – that continue to mystify even our greatest minds.

One of the main reasons for this is because Jupiter is so starkly different from what we Earth-dwellers consider to be normal. Between its incredible size, mass, composition, the mysteries of its magnetic and gravitational fields, and its impressive system of moons, its existence has shown us just how diverse planets can truly be.

Size, Mass and Density:

Earth’s has a mean radius of 6,371 km (3,958.8 mi), and a mass of 5.97 × 1024 kg, whereas Jupiter has a mean radius of 69,911 ± 6 km (43441 mi) and a mass of 1.8986×1027 kg. In short, Jupiter is almost 11 times the size of Earth, and just under 318 times as massive. However, Earth’s density is significantly higher, since it is a terrestrial planet – 5.514 g/cm3 compared to 1.326 g/cm³.

Because of this, Jupiter’s “surface” gravity is significantly higher than Earth normal – i.e. 9.8 m/s² or 1 g. While, as a gas giant, Jupiter has no surface per se, astronomers believe that within Jupiter’s atmosphere where the atmospheric pressure is equal to 1 bar (which is equal to Earth’s at sea level), Jupiter experiences a gravitational force of 24.79 m/s2 (which is the equivalent of 2.528 g).

Jupiter/Earth comparison. Credit: NASA/SDO/Goddard/Tdadamemd

Composition and Structure:

Earth is a terrestrial planet, which means it is composed of silicate minerals and metal that are differentiated between a metal core and a silicate mantle and crust. The core itself is also differentiated, between an inner core and outer core (which spins in the opposite direction of Earth’s rotation). As one descends from the crust to the interior, temperatures and pressure increase.

The shape of Earth approximates that of an oblate spheroid, a sphere flattened along the axis from pole to pole such that there is a bulge around the equator. This bulge results from the rotation of Earth, and causes the diameter at the equator to be 43 kilometers (27 mi) larger than the pole-to-pole diameter.

In contrast, Jupiter is composed primarily of gaseous and liquid matter which is divided between a gaseous outer atmosphere and a denser interior. It’s upper atmosphere is composed of about 88–92% hydrogen and 8–12% helium by volume of gas molecules, and approx. 75% hydrogen and 24% helium by mass, with the remaining one percent consisting of other elements.

The atmosphere contains trace amounts of methane, water vapor, ammonia, and silicon-based compounds as well as trace amounts of benzene and other hydrocarbons. There are also traces of carbon, ethane, hydrogen sulfide, neon, oxygen, phosphine, and sulfur. Crystals of frozen ammonia have also been observed in the outermost layer of the atmosphere.

upiter's structure and composition. (Image Credit: Kelvinsong CC by S.A. 3.0)
Jupiter’s structure and composition. (Image Credit: Kelvinsong CC by S.A. 3.0)

The denser interior is composed of roughly 71% hydrogen, 24% helium and 5% other elements by mass. It is believed that Jupiter’s core is a dense mix of elements – a surrounding layer of liquid metallic hydrogen with some helium, and an outer layer predominantly of molecular hydrogen. The core has also been inferred as being rocky, but this remains unknown as well.

And much like Earth, temperatures and pressures inside Jupiter increase dramatically toward the core. At the “surface”, the pressure and temperature are believed to be 10 bars and 340 K (67 °C, 152 °F). In the region where hydrogen becomes metallic, it is believed that temperatures reach 10,000 K (9,700 °C; 17,500 °F) and pressures 200 GPa. The temperature at the core boundary is estimated to be 36,000 K (35,700 °C; 64,300 °F) and the interior pressure at roughly 3,000–4,500 GPa.

Also like Earth, Jupiter’s shape is that of an oblate spheroid. In fact, Jupiter’s polar flattening is greater than that of Earth’s  – 0.06487 ± 0.00015 compared to 0.00335. This is due to Jupiter’s rapid rotation on its axis, and is why the planet’s equatorial radius is approximately 4600 km larger than its polar radius.

Orbital Parameters:

Earth has a very minor orbital eccentricity (approx. 0.0167) and ranges in distance from 147,095,000 km (0.983 AU) from the Sun at perihelion to 151,930,000 km (1.015 AU) at aphelion. This works out to an average distance (aka. semi-major axis) of 149,598,261 km, which is the basis of a single Astronomical Unit (AU).

The asteroids of the inner Solar System and Jupiter: The donut-shaped asteroid belt is located between the orbits of Jupiter and Mars. Credit: Wikipedia Commons
The orbits of the inner planets of the Solar System, with Jupiter and the donut-shaped asteroid belt is located between them. Credit: Wikipedia Commons

The Earth has an orbital period of 365.25 days, which is the equivalent of 1.000017 Julian years. This means that every four years (in what is known as a Leap Year), the Earth calendar must include an extra day. Though technically a full day is considered to be 24 hours long, our planet takes precisely 23h 56m and 4 s to complete a single sidereal rotation (0.997 Earth days). But combined with its orbital period around the Sun, the time between one sunrise and another (a Solar Day) is 24 hours.

Viewed from the celestial north pole, the motion of Earth and its axial rotation appear counterclockwise. From the vantage point above the north poles of both the Sun and Earth, Earth orbits the Sun in a counterclockwise direction. Earth’s axis is tilted also 23.4° towards the ecliptic of the Sun, which is responsible for producing seasonal variations on the planet’s surface. In addition to producing variations in temperature, this also results in variations in the amount of sunlight a hemisphere receives during the course of a year.

Meanwhile, Jupiter orbits the Sun at an average distance (semi-major axis) of 778,299,000 km (5.2 AU), ranging from 740,550,000 km (4.95 AU) at perihelion and 816,040,000 km (5.455 AU) at aphelion. At this distance, Jupiter takes 11.8618 Earth years to complete a single orbit of the Sun. In other words, a single Jovian year lasts the equivalent of 4,332.59 Earth days.

The Juno spacecraft isn't the first one to visit Jupiter. Galileo went there in the mid 90's, and Voyager 1 snapped a nice picture of the clouds on its mission. Image: NASA
The banded appearance of Jupiter’s upper atmopshere, which is partly due to its rapid rotation. Credit: NASA

However, Jupiter’s rotation is the fastest of all the Solar System’s planets, completing a single rotation on its axis in slightly less than ten hours (9 hours, 55 minutes and 30 seconds). Therefore, a single Jovian year lasts 10,475.8 Jovian solar days.

Atmospheres:

Earth’s atmosphere is made up of five main layers – the Troposphere, the Stratosphere, the Mesosphere, the Thermosphere, and the Exosphere. As a rule, air pressure and density decrease the higher one goes into the atmosphere and the farther one is from the surface. However, the relationship between temperature and altitude is more complicated, and may even rise with altitude in some cases.

The troposphere contains roughly 80% of the mass of Earth’s atmosphere, with some 50% located in the lower 5.6 km (3.48 mi), making it denser than all its overlying atmospheric layers. It is primarily composed of nitrogen (78%) and oxygen (21%) with trace concentrations of water vapor, carbon dioxide, and other gaseous molecules.

Nearly all atmospheric water vapor or moisture is found in the troposphere, so it is the layer where most of Earth’s meteorological phenomena (clouds, rain, snow, lightning storms) take place. The one exception is the Thermoposphere, where the phenomena known as Aurora Borealis and Aurara Australis (aka. The Northern and Southern Lights) are known to take place.

As already noted, Jupiter’s atmosphere is composed primarily of hydrogen and helium, with trace amounts of other elements. Much like Earth, Jupiter experiences auroras near its northern and southern poles. But on Jupiter, the auroral activity is much more intense and rarely ever stops. The intense radiation, Jupiter’s magnetic field, and the abundance of material from Io’s volcanoes that react with Jupiter’s ionosphere create a light show that is truly spectacular.

Jupiter also experiences violent weather patterns. Wind speeds of 100 m/s (360 km/h) are common in zonal jets, and can reach as high as 620 kph (385 mph). Storms form within hours and can become thousands of km in diameter overnight. One storm, the Great Red Spot, has been raging since at least the late 1600s. The storm has been shrinking and expanding throughout its history; but in 2012, it was suggested that the Giant Red Spot might eventually disappear.

Jupiter is perpetually covered with clouds composed of ammonia crystals and possibly ammonium hydrosulfide. These clouds are located in the tropopause and are arranged into bands of different latitudes, known as “tropical regions”. The cloud layer is only about 50 km (31 mi) deep, and consists of at least two decks of clouds: a thick lower deck and a thin clearer region.

Composite images from the Chandra X-Ray Observatory and the Hubble Space Telescope show the hyper-energetic x-ray auroras at Jupiter. The image on the left is of the auroras when the coronal mass ejection reached Jupiter, the image on the right is when the auroras subsided. The auroras were triggered by a coronal mass ejection from the Sun that reached the planet in 2011. Image: X-ray: NASA/CXC/UCL/W.Dunn et al, Optical: NASA/STScI
Composite images from the Chandra X-Ray Observatory and the Hubble Space Telescope show the hyper-energetic x-ray auroras at Jupiter. Credit: NASA/CXC/UCL/W.Dunn et al/STScI

There may also be a thin layer of water clouds underlying the ammonia layer, as evidenced by flashes of lightning detected in the atmosphere of Jupiter, which would be caused by the water’s polarity creating the charge separation needed for lightning. Observations of these electrical discharges indicate that they can be up to a thousand times as powerful as those observed here on the Earth.

Moons:

Earth has only one orbiting satellite, The Moon. It’s existence has been known of since prehistoric times, and it has played a major role in the mythological and astronomical traditions of all human cultures and has a significant effect on Earth’s tides. In the modern era, the Moon has continued to serve as a focal point for astronomical and scientific research, as well as space exploration.

In fact, the Moon is the only celestial body outside of Earth that humans have actually walked on. The first Moon landing took place on July 20th, 1969, and Neil Armstrong was the first person to set foot on the surface. Since that time, a total of 13 astronauts have been to the Moon, and the research that they carried out has been instrumental in helping us to learn about its composition and formation.

Thanks to examinations of Moon rocks that were brought back to Earth, the predominant theory states that the Moon was created roughly 4.5 billion years ago from a collision between Earth and a Mars-sized object (known as Theia). This collision created a massive cloud of debris that began circling our planet, which eventually coalesced to form the Moon we see today.

Illustration of Jupiter and the Galilean satellites. Credit: NASA

The Moon is one of the largest natural satellites in the Solar System and is the second-densest satellite of those whose densities are known (after Jupiter’s satellite Io). It is also tidally locked with Earth, meaning that one side is constantly facing towards us while the other is facing away. The far side, known as the “Dark Side”, remained unknown to humans until probes were sent to photograph it.

The Jovian system, on the other hand, has 67 known moons. The four largest are known as the Galilean Moons, which are named after their discoverer, Galileo Galilei. They include: Io, the most volcanically active body in our Solar System; Europa, which is suspected of having a massive subsurface ocean; Ganymede, the largest moon in our Solar System; and Callisto, which is also thought to have a subsurface ocean and features some of the oldest surface material in the Solar System.

Then there’s the Inner Group (or Amalthea group), which is made up of four small moons that have diameters of less than 200 km, orbit at radii less than 200,000 km, and have orbital inclinations of less than half a degree. This groups includes the moons of Metis, Adrastea, Amalthea, and Thebe. Along with a number of as-yet-unseen inner moonlets, these moons replenish and maintain Jupiter’s faint ring system.

Jupiter also has an array of Irregular Satellites, which are substantially smaller and have more distant and eccentric orbits than the others. These moons are broken down into families that have similarities in orbit and composition, and are believed to be largely the result of collisions from large objects that were captured by Jupiter’s gravity.

In just about every way imaginable, Earth and Jupiter could not be more different. And there are still many things about the Jovian planet that we do not yet fully understand. Speaking of which, be sure to stay tuned to Universe Today for the latest updates from NASA’s Juno mission.

We have written many interesting articles about the planets of the Solar System here at Universe Today. Here’s Earth Compared to Mercury, Earth Compared to Venus, The Moon Compared to Earth, Earth Compared to Mars, Saturn Compared to Earth, and Neptune Compared to Earth.

Want more information on Jupiter? Here’s a link to Hubblesite’s News Releases about Jupiter, and here’s NASA’s Solar System Exploration Guide.

We have recorded a podcast just about Jupiter for Astronomy Cast. Click here and listen to Episode 56: Jupiter.

The Constellation Boötes

The northern constellation of Bootes, one of the 88 modern constellations recognized by the IAU. Credit: smokymtnastro.org

Welcome back to Constellation Friday! Today, in honor of our dear friend and contributor, Tammy Plotner, we examine the Bootes constellation. Enjoy!

In the 2nd century CE, Greek-Egyptian astronomer Claudius Ptolemaeus (aka. Ptolemy) compiled a list of the then-known 48 constellations. Until the development of modern astronomy, his treatise (known as the Almagest) would serve as the authoritative source of astronomy. This list has since come to be expanded to include the 88 constellation that are recognized by the International Astronomical Union (IAU) today.

The constellation Boötes (pronounced Bu-Oh-Tays) is one of these constellations, and was also among those listed in the Almagest. It is frequently called the “Watcher of the Bear”, guarding over the northern constellations of both Ursa Major and Ursa Minor (the Greater and Lesser Bears). It is bordered by Canes Venatici, Coma Berenices, Corona Borealis, Draco, Hercules, Serpens Caput, Virgo and Ursa Major.

Name and Meaning:

According to myth, Boötes is credited for inventing the plough, which prompted the goddess Ceres – a goddess of agriculture, grain crops, fertility and motherly love – to place him in the heavens. There are also versions where Bootes represents a form of Atlas, holding up the weight of the world as it turns on its axis (yet another of Hercules’ labors).

Most commonly, Boötes is taken to represent Arcas, the son of Zeus and Callisto. In this source, Arcas was brought up by Callisto father, the Arcadian king Lycaon. One day, Lycaon decided to test Zeus by serving him his own son for a meal. Zeus saw through Lycaon’s intentions and transformed the king into a wolf, killed his sons, and brought Arcas back to life.

Boötes as depicted in Urania's Mirror, a set of constellation cards published in London c.1825. In his left hand he holds his hunting dogs, Canes Venatici. Below them is the constellation Coma Berenices. Above the head of Boötes is Quadrans Muralis, now obsolete, but which lives on as the name of the early January Quadrantid meteor shower. Mons Mænalus can be seen at his feet. Credit: Wikipedia Commons/Sidney Hall
Boötes as depicted in Urania’s Mirror, a set of constellation cards published in London c.1825. Credit: Wikipedia Commons/Sidney

Having heard of her husband’s infidelity, Zeus’ wife Hera transformed Callisto into a bear. For years, she roamed the woods until she met her son, who was now grown up. Arcas didn’t recognize his mother and began to chase her. To avoid a tragic end, Zeus intervened by placing them both in the sky, where Callisto became Ursa Major (aka. The Big Dipper, or “Great Bear”) and Arcas became Boötes.

In another story, Boötes is taken to represent Icarius, a grape grower who was given the secret of wine-making by Dionysus. Icarius used this to create a wonderful wine that he shared with all his neighbors. After overindulging, they woke up the next day with terrible hangovers and believed Icarius had tried to poison them. They killed him in his sleep, and a saddened Dionysus placed his friend among the stars.

Notable Features:

Bootes contains the third brightest star in the night sky – Arcturus (aka. alpha Boötis) – whose Greek name “Arktos” also means “bear”, and is associated with all things northern (including the aurora). Arcturus is quite important, being a type K1.5 IIIpe red giant star. The letters “pe” stand for “peculiar emission,” which indicates the spectrum of the star is unusual and full of emission lines. This is not uncommon in red giants, but Arcturus is particularly strong.

The Bootes contellation. Credit: IAU/Sky and Telescope
The location of the Bootes contellation. Credit: IAU/Sky and Telescope

Arcturus is about 110 times more luminous than our nearest star, but the total power output is about 180 times that of the Sun (when infrared radiation is considered). Arcturus is also notable for its high proper motion, larger than any first magnitude star in the stellar neighborhood other than Alpha Centauri. It is now almost at its closest and is moving rapidly (122 km/s) relative to the Solar System.

Arcturus is also thought to be an old disk star, and appears to be moving with a group of 52 others of its type. Its mass is hard to determine exactly, but it may have the same mass as Sol, or perhaps 1.5 times as much. Arcturus may also be older than the Sun, and much like what the Sun will be in its Red Giant Phase.

Arcturus achieved fame when its light was used to open the 1933 Chicago World’s Fair. The star was chosen because it was thought that light from the star had started its journey at about the same time of the previous Chicago World’s Fair (1893). Technically the star is 36.7 light years away, so the light would have started its journey in 1896. Arcturus’ light was still focused onto a cell that powered the switch for the lights that eventually shined so bright that Arcturus was no longer visible.

Arcturus, along with its neighboring stars, also form the curious “Colonial Viper” formation, a triangular asterism invented by dedicated SkyWatcher, Ed Murray. It is so-named because it resembles a Colonial Viper being launched from a tube on the TV series Battlestar Galactica. The “Launch Tube” is formed by the intersection of Arcturus, Alphekka (Alpha Corona Borealis) and Gamma Bootis, while Izar (Epsilon Bootes) is the Viper.

A Colonial Viper leaving the Launch Tube aboard the Battlestar Galactica. Credit: battlestararies-bsr26.net

Other notable stars include Nekkar (Beta Boötis), a yellow G-type giant that is 219 light years from Earth. It is a flare star, which is a type of variable star that shows dramatic increases in luminosity for a few minutes. The name Nekkar derives from the Arabic word for “cattle driver”. Then there’s Seginus (Gamma Boötis), a Delta-Scuti type variable star that is approximately 85 light years from Earth. It shows variations in its brightness due to both radial and non-radial pulsations on its surface.

Izar (Epislon Boötis) is a binary star located approximately 300 light years away which consists of a bright orange giant and a smaller and fainter main sequence star. Epsilon Boötis is also sometimes knows as Pulcherrima, which means “the lovieliest” in Latin. The name Izar comes from the Arabic word for “veil.” The star’s other traditional names are Mirak (“the loins” in Arabic) and Mizar.

Muphrid (Eta Boötis) is a spectroscopic binary star that is 37 light years from Earth and close to Arcturus in the sky. The star’s traditional name is Muphrid, derived from the Arabic phrase for “the single one of the lancer.” It belongs to the spectral class G0 IV and has a significant excess of elements heavier than hydrogen.

Boötes is also home to many Deep Sky Objects. This includes the Boötes void (aka. the Great Void, the Supervoid). This sphere-shaped region of the sky is almost 250 million light years in diameter and contains 60 galaxies. The void was originally discovered by Robert P. Kirshner – a Harvard College Professor of Astronomy – in 1981, as part of a survey of galactic redshifts.

The very loose globular cluster NGC 5466, Credit: NASA, ESA
The very loose globular cluster NGC 5466 located in the Boots consetllation, Credit: NASA, ESA/Wikisky

Then there is the Boötes Dwarf Galaxy (Boötes I), a dwarf spheroidal galaxy located approximately 197,000 light years from Earth that measures about 720 light years across. It was only discovered in 2006, owing to the fact that it is one of the faintest galaxies known (with an absolute magnitude of -5.8 and apparent magnitude of 13.1). Boötes I orbits the Milky Way and is believed to be tidally disrupted by its gravity, as evidenced by its shape.

And there’s also NGC 5466, a globular cluster approximately 51,800 light years from Earth and 52,800 light years from the Galactic center. The cluster was first discovered by the German-born British astronomer William Herschel in 1784. It is believed that this cluster is the source of a star stream called the 45 Degree Tidal Stream, which was discovered in 2006.

History of Observation:

The earliest recorded mentions of the stars associated with Boötes come from ancient Babylonia, where it was listed as SHU.PA. These stars were apparently depicted as the god Enlil, who was the leader of the Babylonian pantheon and special patron of farmers. It is likely that this is the source of mythological representations of Bootes as “the ploughman” in Greco-Roman astronomy.

The name Boötes was first used by Homer in The Odyssey as a celestial reference point for navigation. The name literally means “ox-driver” or “herdsman”, and the ancient Greeks saw the asterism now called the “Big Dipper” or “Plough” as a cart with oxen. His dogs, Chara and Asterion, were represented by the constellation of Canes Venatici (the Hunting Dogs) who drove the oxen on and kept the wheels of the sky turning.

Phecda
The Big Dipper, the asterism that neighbors the Bootes constellation. Credit: Jerry Lodriguss

In traditional Chinese astronomy, many of the stars in Boötes were associated with different Chinese constellations. Arcturus was one of the most prominent, variously designated as the celestial king’s throne (Tian Wang) or the Blue Dragon’s horn (Daijiao). Arcturus was also very important in Chinese celestial mythology because it is the brightest star in the northern sky, and marked the beginning of the lunar calendar.

Flanking Daijiao were the constellations of Yousheti on the right and Zuosheti on the left, which represented the companions that orchestrated the seasons. Dixi, the Emperor’s ceremonial banquet mat, was north of Arcturus. Another northern constellation was Qigong, the Seven Dukes, which was mostly across the Boötes-Hercules border.

The other Chinese constellations made up of the stars of Boötes existed in the modern constellation’s north. These are all representations of weapons –  Tianqiang, the spear; Genghe, variously representing a lance or shield; Xuange, the halberd; and Zhaoyao, either the sword or the spear.

Finding Bootes:

Bootes can be found south of Ursa Major, just off the handle of the Big Dipper. Because the Big Dipper is easy for most observers to find, the handle is used to point to other important stars. Bootes’ brightest star, Arcturus, is also part of a mnemonic device used to orient people, which goes: “Arc to Arcturus, speed on to Spica.” This means you follow the curve in the Dipper’s handle away from Ursa Major until you run into Arcturus. The other star – Spica – is part of the neighboring Virgo constellation.

Arcturus, the brightest star in the Boötes constellation. Credit: astropixels.com

For those using binoculars, check out Tau Bootis, a yellow-white dwarf approximately 51 light-years from Earth. It is a binary star system, with the secondary star being a red dwarf. In 1999, an extrasolar planet was confirmed to be orbiting the primary star by a team of astronomers led by Geoff Marcy and R. Paul Butler. Maybe you’d like to look at long term variable star R Boötis? It ranges from 6.2 to 13.1 every 223.4 days.

For those using telescopes, there are plenty of excellent binary star systems to be seen. Pi Boötis is located approximately 317 light years from our solar system and the primary component, P¹ Boötis, is a blue-white B-type main sequence dwarf with an apparent magnitude of +4.49. It’s companion, P² Boötis, is a white A-type main sequence dwarf with an apparent magnitude of +5.88.

Now try looking at Xi Boötis, a binary star system which lies 21.8 light years away. The primary star, Xi Boötis A, is a BY Draconis variable, yellow G-type main sequence dwarf with an apparent magnitude that varies from +4.52 to +4.67. with a period just over 10 days long. Small velocity changes in the orbit of the companion star, Xi Boötis B – an orange K-type main sequence dwarf – indicate the presence of a small companion with less than nine times the mass of Jupiter.

The AB binary can be resolved even through smaller telescopes. The primary star (A) has been identified as a candidate for possessing a Kuiper-like belt, based on infrared observations. The estimated minimum mass of this dust disk is 2.4 times the mass of the Earth’s Moon.

The location of Mu Bootis (Alkalurops) in the Bootes constllation. Credit: universeguide.com
The location of Mu Bootis (Alkalurops) in the Bootes constellation. Credit: universeguide.com

Then there’s the triple system, Mu Boötis. The primary component, Mu¹ Boötis, is a yellow-white F-type sub giant with an apparent magnitude of +4.31. Separated from the primary by 108 arc seconds is the binary star Mu² Boötis, which has a combined spectral type of G1V and a combined brightness of +6.51 magnitudes. The components of Mu² Boötis have apparent magnitudes of +7.2 and +7.8 and are separated by 2.2 arc seconds.

They complete one orbit about their common center of mass every 260 years. How about colorful yellow and blue Kappa Boötis? Kappa2 Boötis is classified as a Delta Scuti type variable star and its brightness varies from magnitude +4.50 to +4.58 with a period of 1.83 hours. The companion star, Kappa¹ Boötis, has magnitude +6.58 and spectral class F1V.

For deep sky observers with large telescopes, try checking out the globular cluster NGC 5466, which is about a fist’s width north of Arcturus. This class XII, 9th magnitude globular was discovered in 1784 by Sir William Herschel and presents an nice challenge for experienced stargazers and amateur astronomers.

Or try compact spiral galaxy NGC 5248. It’s about a fist width south of Arcturus and about a finger width southwest. It’s part of the Virgo cluster of galaxies and could be as far as 50 million light years away. It’s another great grand design spiral which shows spiral galaxy structure when viewed in long exposure photographs. You can mark it on your list as Caldwell 45.

The NGC 5248 spiral galaxy, as imaged with a 32-inch telescope. Credit and Copyright: Adam Block/Mount Lemmon SkyCenter/University of Arizona

But if you’d just like to have some fun, then why not try picking out the aforementioned “Colonial Viper and Launch Tube” asterism. If you’re a longstanding Battlestar Galactica fan, then you’ll recognize this ultra-cool spaceship as it sits in its triangular shaped launch tube. To find it, just draw a line between Arcturus, Alphekka (Alpha Corona Borealis) and Gamma Bootis which make up the “Launch Tube”, while Izar (Epsilon Bootes) is the Viper.

We have written many interesting articles about the constellation here at Universe Today. Here is What Are The Constellations?What Is The Zodiac?, and Zodiac Signs And Their Dates.

Be sure to check out The Messier Catalog while you’re at it!

For more information, check out the IAUs list of Constellations, and the Students for the Exploration and Development of Space page on Bootes and Constellation Families.

What is Galileo’s Telescope?

The original Galileo telescope, which is preserved today at the Museo Galileo in Italy. Credit: museogalileo.it

In 1610, Italian astronomer Galileo Galilei looked up at the heavens using a telescope of his making. And what he saw would forever revolutionize the field of astronomy, our understanding of the Universe, and our place in it. Centuries later, Galileo’s is still held in such high esteem; not only for the groundbreaking research he conducted, but because of his immense ingenuity in developing his own research tools.

And at the center of it all is Galileo’s famous telescope, which still inspires curiosity centuries later. How exactly did he invent it. How exactly was it an improvement on then-current designs? What exactly did he see with it when he looked up at the night sky? And what has become of it today? Luckily, all of these are questions we are able to answer.

Description:

Galileo’s telescope was the prototype of the modern day refractor telescope. As you can see from this diagram below, which is taken from Galileo’s own work – Sidereus Nuncius (“The Starry Messenger”) – it was a simple arrangement of lenses that first began with optician’s glass fixed to either end of a hollow cylinder.

Diagram of Galileo's telescope, taken from Sidereus Nuncius. Credit: hps.cam.ac.uk
Diagram of Galileo’s refractor telescope, taken from Sidereus Nuncius (1610). Credit: hps.cam.ac.uk

Galileo had no diagrams to work from, and instead relied on his own system of trial and error to achieve the proper placement of the lenses. In Galileo’s telescope the objective lens was convex and the eye lens was concave (today’s telescopes make use of two convex lenses). Galileo knew that light from an object placed at a distance from a convex lens created an identical image on the opposite side of the lens.

He also knew that if he used a concave lens, the object would appear on the same side of the lens where the object was located. If moved at a distance, it appeared larger than the object. It took a lot of work and different arrangements to get the lens the proper sizes and distances apart, but Galileo’s telescope remained the most powerful and accurately built for a great many years.

History of Galileo’s Telescope:

Naturally, Galileo’s telescope had some historical antecedents. In the late summer of 1608, a new invention was all the rage in Europe – the spyglass. These low power telescopes were likely made by almost all advanced opticians, but the very first was credited to Hans Lippershey of Holland. These primitive telescopes only magnified the view a few times over.

Much like our modern times, the manufacturers were quickly trying to corner the market with their invention. But Galileo Galilei’s friends convinced his own government to wait – sure that he could improve the design. When Galileo heard of this new optical instrument he set about engineering and making improved versions, with higher magnification.

Galileo Galilei showing the Doge of Venice how to use the telescope by Giuseppe Bertini (1858). Credit: gabrielevanin.it

Galileo’s telescope was similar to how a pair of opera glasses work – a simple arrangement of glass lenses to magnify objects. His first versions only improved the view to the eighth power, but Galileo’s telescope steadily improved. Within a few years, he began grinding his own lenses and changing his arrays. Galileo’s telescope was now capable of magnifying normal vision by a factor of 10, but it had a very narrow field of view.

However, this limited ability didn’t stop Galileo from using his telescope to make some amazing observations of the heavens. And what he saw, and recorded for posterity, was nothing short of game-changing.

What Galileo Observed:

One fine Fall evening, Galileo pointed his telescope towards the one thing that people thought was perfectly smooth and as polished as a gemstone – the Moon. Imagine his surprise when found that it, in his own words, was “uneven, rough, full of cavities and prominences.” Galileo’s telescope had its flaws, such as a narrow field of view that could only show about one quarter of the lunar disk without repositioning.

Nevertheless, a revolution in astronomy had begun! Months passed, and Galileo’s telescope improved. On January 7th, 1610, he turned his new 30 power telescope towards Jupiter, and found three small, bright “stars” near the planet. One was off to the west, the other two were to the east, and all three were in a straight line. The following evening, Galileo once again took a look at Jupiter, and found that all three of the “stars” were now west of the planet – still in a straight line!

Cardinal Bellarmine had written in 1615 that the Copernican system could not be defended without "a true physical demonstration that the sun does not circle the earth but the earth circles the sun". Galileo considered his theory of the tides to provide the required physical proof of the motion of the earth. This theory was so important to him that he originally intended to entitle his Dialogue on the Two Chief World Systems the Dialogue on the Ebb and Flow of the Sea. For Galileo, the tides were caused by the sloshing back and forth of water in the seas as a point on the Earth's surface sped up and slowed down because of the Earth's rotation on its axis and revolution around the Sun. He circulated his first account of the tides in 1616, addressed to Cardinal Orsini. His theory gave the first insight into the importance of the shapes of ocean basins in the size and timing of tides; he correctly accounted, for instance, for the negligible tides halfway along the Adriatic Sea compared to those at the ends. As a general account of the cause of tides, however, his theory was a failure. If this theory were correct, there would be only one high tide per day. Galileo and his contemporaries were aware of this inadequacy because there are two daily high tides at Venice instead of one, about twelve hours apart. Galileo dismissed this anomaly as the result of several secondary causes including the shape of the sea, its depth, and other factors. Against the assertion that Galileo was deceptive in making these arguments, Albert Einstein expressed the opinion that Galileo developed his "fascinating arguments" and accepted them uncritically out of a desire for physical proof of the motion of the Earth. Galileo dismissed the idea, held by his contemporary Johannes Kepler, that the moon caused the tides. He also refused to accept Kepler's elliptical orbits of the planets, considering the circle the "perfect" shape for planetary orbits.Cardinal Bellarmine had written in 1615 that the Copernican system could not be defended without "a true physical demonstration that the sun does not circle the earth but the earth circles the sun". Galileo considered his theory of the tides to provide the required physical proof of the motion of the earth. This theory was so important to him that he originally intended to entitle his Dialogue on the Two Chief World Systems the Dialogue on the Ebb and Flow of the Sea. For Galileo, the tides were caused by the sloshing back and forth of water in the seas as a point on the Earth's surface sped up and slowed down because of the Earth's rotation on its axis and revolution around the Sun. He circulated his first account of the tides in 1616, addressed to Cardinal Orsini. His theory gave the first insight into the importance of the shapes of ocean basins in the size and timing of tides; he correctly accounted, for instance, for the negligible tides halfway along the Adriatic Sea compared to those at the ends. As a general account of the cause of tides, however, his theory was a failure. If this theory were correct, there would be only one high tide per day. Galileo and his contemporaries were aware of this inadequacy because there are two daily high tides at Venice instead of one, about twelve hours apart. Galileo dismissed this anomaly as the result of several secondary causes including the shape of the sea, its depth, and other factors. Against the assertion that Galileo was deceptive in making these arguments, Albert Einstein expressed the opinion that Galileo developed his "fascinating arguments" and accepted them uncritically out of a desire for physical proof of the motion of the Earth. Galileo dismissed the idea, held by his contemporary Johannes Kepler, that the moon caused the tides. He also refused to accept Kepler's elliptical orbits of the planets, considering the circle the "perfect" shape for planetary orbits.
Galileo’s Sidereus Nuncius (“Starry Messenger”) shared the discoveries he made of Jupiter with his telescope. Credit and Copyright: brunelleschi.imss.fi.it

And there were more discoveries awaiting Galileo’s telescope: the appearance of bumps next to the planet Saturn (the edges of Saturn’s rings), spots on the Sun’s surface (aka. Sunspots), and seeing Venus change from a full disk to a slender crescent. Galileo Galilei published all of these findings in a small book titled Sidereus Nuncius (“The Starry Messenger”) in 1610.

While Galileo was not the first astronomer to point a telescope towards the heavens, he was the first to do so scientifically and methodically. Not only that, but the comprehensive notes he took on his observations, and the publication of his discoveries, would have a revolutionary impact on astronomy and many other fields of science.

Galileo’s Telescope Today:

Today, over 400 years later, Galileo’s Telescope still survives under the constant care of the Istituto e Museo di Storia della Scienza (renamed the Museo Galileo in 2010) in Italy. The Museum holds exhibitions on Galileo’s telescope and the observations he made with it. The displays consist of these rare and precious instruments – including the objective lens created by the master and the only two existing telescopes built by Galileo himself.

Thanks to Galileo’s careful record keeping, craftsmen around the world have recreated Galileo’s telescope for museums and replicas are now sold for amateurs and collectors as well. Despite the fact that astronomers now have telescopes of immense power at their disposal, many still prefer to go the DIY route, just like Galileo!

A replica of the earliest surviving telescope attributed to Galileo Galilei, on display at the Griffith Observatory. Credit: Wikipedia Commons/Mike Dunn

Few scientists and astronomers have had the same impact Galileo had. Even fewer are regarded as pioneers in the sciences, or revolutionary thinkers who forever changed humanity’s perception of the heavens and their place within it. Little wonder then why his most prized instrument is kept so well preserved, and is still the subject of study over four centuries later.

We have written many interesting articles on Galileo here at Universe Today. Here’s

Astronomy Cast also has an interesting episode on telescope making – Episode 327: Telescope Making, Part I

For more information, be sure to check out the Museo Galileo‘s website.

Where is Earth in the Milky Way?

Artist's impression of The Milky Way Galaxy. Based on current estimates and exoplanet data, it is believed that there could be tens of billions of habitable planets out there. Credit: NASA

For thousand of years, astronomers and astrologers believed that the Earth was at the center of our Universe. This perception was due in part to the fact that Earth-based observations were complicated by the fact that the Earth is embedded in the Solar System. It was only after many centuries of continued observation and calculations that we discovered that the Earth (and all other bodies in the Solar System) actually orbits the Sun.

Much the same is true about our Solar System’s position within the Milky Way. In truth, we’ve only been aware of the fact that we are part of a much larger disk of stars that orbits a common center for about a century. And given that we are embedded within it, it has been historically difficult to ascertain our exact position. But thanks to ongoing efforts, astronomers now know where our Sun resides in the galaxy.

Size of the Milky Way:

For starters, the Milky Way is really, really big! Not only does it measure some 100,000–120,000 light-years in diameter and about 1,000 light-years thick, but up to 400 billion stars are located within it (though some estimates think there are even more). Since one light year is about 9.5 x 10¹² km (9.5 trillion km) long, the diameter of the Milky Way galaxy is about 9.5 x 10¹⁷ to 11.4 x 10¹⁷ km, or 9,500 to 11,400 quadrillion km.

It became its current size and shape by eating up other galaxies, and is still doing so today. In fact, the Canis Major Dwarf Galaxy is the closest galaxy to the Milky Way because its stars are currently being added to the Milky Way’s disk. And our galaxy has consumed others in its long history, such as the Sagittarius Dwarf Galaxy.

And yet, our galaxy is only a middle-weight when compared to other galaxies in the local Universe. Andromeda, the closest major galaxy to our own, is about twice as large as our own. It measures 220,000 light years in diameter, and has an estimated 400-800 billion stars within it.

Structure of the Milky Way:

If you could travel outside the galaxy and look down on it from above, you’d see that the Milky Way is a barred spiral galaxy. For the longest time, the Milky Way was thought to have 4 spiral arms, but newer surveys have determined that it actually seems to just have two spiral arms, called Scutum–Centaurus and Carina–Sagittarius.

The spiral arms are formed from density waves that orbit around the Milky Way – i.e. stars and clouds of gas clustered together. As these density waves move through an area, they compress the gas and dust, leading to a period of active star formation for the region. However, the existence of these arms has been determined from observing parts of the Milky Way – as well as other galaxies in our universe.

The Milky Way's basic structure is believed to involve two main spiral arms emanating from opposite ends of an elongated central bar. But only parts of the arms can be seen - gray segments indicate portions not yet detected. Other known spiral arm segments--including the Sun's own spur--are omitted for clarity. Credit: T. Dame
The Milky Way’s basic structure is believed to involve two main spiral arms emanating from opposite ends of an elongated central bar. Credit: T. Dame

In truth, all the pictures that depict our galaxy are either artist’s renditions or pictures of other spiral galaxies, and not the result of direct observation of the whole. Until recently, it was very difficult for scientists to gauge what the Milky Way really looks like, mainly because we’re inside it. It has only been through decades of observation, reconstruction and comparison to other galaxies that they have been to get a clear picture of what the Milky Way looks like from the outside.

From ongoing surveys of the night sky with ground-based telescopes, and more recent missions involving space telescopes, astronomers now estimate that there are between 100 and 400 billion stars in the Milky Way. They also think that each star has at least one planet, which means there are likely to be hundreds of billions of planets in the Milky Way – billions of which are believed to be the size and mass of the Earth.

As noted, much of the Milky Way’s arms is made up of dust and gas. This matter makes up a whopping 10-15% of all the “luminous matter” (i.e. that which is visible) in our galaxy, with the remainder being the stars. Our galaxy is roughly 100,000 light years across, and we can only see about 6,000 light years into the disk in the visible spectrum.

Still, when light pollution is not significant, the dusty ring of the Milky Way can be discerned in the night sky. What’s more, infrared astronomy and viewing the Universe in other, non-visible wavelengths has allowed astronomers to be able to see more of it.

The Milky Way, like all galaxies, is also surrounded by a vast halo of dark matter, which accounts for some 90% of its mass. Nobody knows precisely what dark matter is, but its mass has been inferred by observations of how fast the galaxy rotates and other general behaviors. More importantly, it is believed that this mass helps keep the galaxy from tearing itself apart as it rotates.

The Solar System:

The Solar System (and Earth) is located about 25,000 light-years to the galactic center and 25,000 light-years away from the rim. So basically, if you were to think of the Milky Way as a big record, we would be the spot that’s roughly halfway between the center and the edge.

Astronomers have agreed that the Milky Way probably has two major spiral arms – Perseus arm and the Scutum-Centaurus arm – with several smaller arms and spurs. The Solar System is located in a region in between the two arms called the Orion-Cygnus arm. This arm measures 3,500 light-years across and is 10,000 light-years in length, where it breaks off from the Sagittarius Arm.

our location in the Orion Spur of the Milky Way galaxy. image credit: Roberto Mura/Public Domain
The location of our Solar Systemin the Orion Spur of the Milky Way galaxy. Credit: Roberto Mura/Public Domain

The fact that the Milky Way divides the night sky into two roughly equal hemispheres indicates that the Solar System lies near the galactic plane. The Milky Way has a relatively low surface brightness due to the gases and dust that fills the galactic disk. That prevents us from seeing the bright galactic center or from observing clearly what is on the other side of it.

You might be surprised to learn that it takes the Sun 250 million years to complete one rotation around the Milky Way – this is what is known as a “Galactic Year” or “Cosmic Year”. The last time the Solar System was in this position in the Milky Way, there were still dinosaurs on Earth. The next time, who knows? Humanity might be extinct, or it might have evolved into something else entirely.

As you can see, the Milky Way alone is a very big place. And discerning our location within it has been no simple task. And as our knowledge of the Universe has expanded, we’ve come to learn two things. Not only is the Universe much larger than we could have ever imagined, but our place within in continues to shrink! Our Solar System, it seems, is both insignificant in the grand scheme of things, but also extremely precious!

We have written many articles about the Milky Way for Universe Today. Here’s 10 Interesting Facts about the Milky Way, How Big is the Milky Way?, What is the Closest Galaxy to the Milky Way?, and How Many Stars Are There in the Milky Way?

If you’d like more info on the Milky Way, check out Hubblesite’s News Releases on Galaxies, and here’s NASA’s Science Page on Galaxies.

We’ve also recorded an episode of Astronomy Cast all about the Milky Way. Listen here, Episode 99: The Milky Way.

How Fast Can Stars Spin?

How Fast Can Stars Spin?

Everything in the Universe is spinning. Spinning planets and their spinning moons orbit around spinning stars, which orbit spinning galaxies. It’s spinning all the way down.

Consider that fiery ball in the sky, the Sun. Like all stars, our Sun rotates on its axis. You can’t tell because staring at the Sun long enough will permanently damage your eyeballs. Instead you can use a special purpose solar telescope to observe sunspots and other features on the surface of the Sun. And if you track their movements, you’ll see that the Sun’s equator takes 24.47 days to turn once on its axis. Unlike its slower poles which take 26.24 days to turn.

The Sun isn’t a solid ball of rock, it’s a sphere of hot plasma, so the different regions can complete their rotation at different rates. But it rotates so slowly that it’s an almost perfect sphere.

If you were standing on the surface of the Sun, which you can’t, of course, you would be whipping around at 7,000 km/h. That sounds fast, but just you wait.

How does that compare to other stars, and what’s the fastest that a star can spin?

Achenar is located at the lower right of the constellation Eridanus.
Achenar rotates much faster than our Sun. It is located at the lower right of the constellation Eridanus.

A much faster spinning star is Achenar, the tenth brightest star in the sky, located 139 light-years away in the constellation of Eridanus. It has about 7 times the mass of the Sun, but it spins once on its axis every 2 days. If you could see Achenar up close, it would look like a flattened ball. If you measured it from pole to pole, it would be 7.6 Suns across, but if you measured across the equator, it would be 11.6 Suns across.

If you were standing on the surface of Achenar, you’d be hurtling through space at 900,000 km/h.

The very fastest spinning star we know of is the 25 solar mass VFTS 102, located about 160,000 light-years away in the Large Magellanic Cloud’s Tarantula Nebula – a factory for massive stars.

If you were standing on the surface of VFTS 102, you’d be moving at 2 million km/h.

In fact, VFTS 102 is spinning so quickly, it can just barely keep itself together. Any faster, and the outward centripetal force would overcome the gravity holding its guts in, and it would tear itself apart. Perhaps that’s why we don’t see any spinning faster; because they couldn’t handle the speed. It appears that this is the fastest that stars can spin.

This is an artist's concept of the fastest rotating star found to date. The massive, bright young star, called VFTS 102, rotates at a million miles per hour, or 100 times faster than our Sun does. Centrifugal forces from this dizzying spin rate have flattened the star into an oblate shape and spun off a disk of hot plasma, seen edge on in this view from a hypothetical planet. The star may have "spun up" by accreting material from a binary companion star. The rapidly evolving companion later exploded as a supernova. The whirling star lies 160,000 light-years away in the Large Magellanic Cloud, a satellite galaxy of our Milky Way.  Credit: NASA, ESA, and G. Bacon (STScI)
This is an artist’s concept of VFTS 102, the fastest rotating star found to date. Credit: NASA, ESA, and G. Bacon (STScI)

One other interesting note about VFTS 102 is that it’s also hurtling through space much faster than the stars around it. Astronomers think it was once in a binary system with a partner that detonated as a supernova, releasing it into space like a catapult.

Not only stars can spin. Dead stars can spin too, and they take this to a whole other level.

Neutron stars are what you get when a star with much more mass than the Sun detonates as a supernova. Suddenly you’ve got a stellar remnant with twice the mass of the Sun compressed down into a tiny ball about 20 km across. All that angular momentum of the star is retained, and so the neutron star spins at an enormous speed.

The fastest neutron star ever recorded spins around 700 times a second. We know it’s turning this quickly because it’s blasting out beams of radiation that sweep towards us like an insane lighthouse. This, of course, is a pulsar, and we did a whole episode on them.

A regular star would be torn apart, but neutron stars have such intense gravity, they can rotate this quickly. Over time, the radiation streaming from the neutron star strips away its angular momentum, and it slows down.

A black hole with an accretion disk. Credit: (NASA/Dana Berry/SkyWorks Digital)

Black holes can spin even faster than that. In fact, when a black hole is actively feeding from a binary companion, or a supermassive black hole is gobbling up stars, it can rotate at nearly the speed of light. The laws of physics prevent anything in the Universe spinning faster than the speed of light, and black holes go right up to the edge of the law without breaking it.

Astronomers recently found a supermassive black hole spinning up to 87% the maximum speed permitted by relativity.

If you were hoping there are antimatter lurking out there, hoarding all that precious future energy, I’m sorry to say, but astronomers have looked and they haven’t found it. Just like the socks in your dryer, we may never discover where it all went.