Astronomers from UC Berkeley used the massive W.M. Keck Observatory in Hawaii to capture this infrared image of Jupiter and its two massive storms: the Great Red Spot and the smaller Oval BA. The image was taken on July 20, using the telescope’s adaptive optics system to sharpen the image. Scientists still aren’t sure why the spots have turned red, but they think it might be that they dredge darker material up from deeper in the planet’s atmosphere; when exposed to ultraviolet light from the Sun, this material turns red.
Continue reading “Jupiter’s Great Red Spots”
Red Spots Brush Past Each Other
Astronomers have been predicting the meetup for months; Jupiter’s Great Red Spot and its newly formed “Red Spot Jr.” were bound to have a close encounter. This high-resolution photo from the Gemini Observatory shows how they looked July 13, 2006. Although both are red in visible light, they look white because the image was captured in the near-infrared wavelength, which can reveal more details. Astronomers don’t think anything dramatic is going to happen as the storms slip past each other this time around.
Continue reading “Red Spots Brush Past Each Other”
Gas Giants Gobbled Up Most of Their Moons
Even though our Solar System’s gas giants vary widely in size and mass, they do have something in common. Each planet is roughly 10,000 times more massive than the combined mass of all their moons. During planetary formation, rocky moons grew out of the solid material surrounding each planet. As these moons grew larger, leftover gas slowed them down, and they fell into the planet to be consumed. The moons we see today were the last ones to form around their parent planets, after the gas had dissipated.
Continue reading “Gas Giants Gobbled Up Most of Their Moons”
Jupiter’s Red Spots Are Nearing Each Other
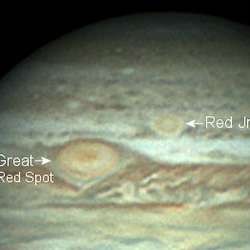
Jupiter’s two red spots. Image credit: Christopher Go. Click to enlarge
Jupiter’s well known Great Red Spot storm, and its newly formed Oval BA (aka Red Jr.) are about to sweep past each other, and astronomers aren’t quite sure what’s going to happen. The storms probably won’t merge or tear each other apart, but their outer bands will rub against each other. Oval BA recently turned red, signifying its larger size and strength compared to the smaller white storms on Jupiter. Some astronomers think the encounter with the Great Red Spot will slow it down again, returning it to white.
The two biggest storms in the solar system are about to go bump in the night, in plain view of backyard telescopes.
Storm #1 is the Great Red Spot, twice as wide as Earth itself, with winds blowing 350 mph. The behemoth has been spinning around Jupiter for hundreds of years.
Storm #2 is Oval BA, also known as “Red Jr.,” a youngster of a storm only six years old. Compared to the Great Red Spot, Red Jr. is half-sized, able to swallow Earth merely once, but it blows just as hard as its older cousin.
The two are converging. Closest approach: the 4th of July, according to Amy Simon-Miller of the Goddard Space Flight Center who has been monitoring the storms using the Hubble Space Telescope.
“There won’t be a head-on collision,” she says. “The Great Red Spot is not going to ‘eat’ Oval BA or anything like that.” But the storms’ outer bands will pass quite close to one another-and no one knows exactly what will happen.
Amateur astronomers are already monitoring the event. Christopher Go of the Philippines took the picture above using his 11-inch telescope on May 28th. “The distance between the storms is shrinking visibly every night,” he says.
Similar encounters have happened before, notes JPL’s Glenn Or ton, a colleague of Simon-Miller. “Oval BA and the Great Red Spot pass each other approximately every two years.” Previous encounters in 2002 and 2004 were anti-climatic. Aside from some “roughing” around the edges, both storms survived apparently unaltered.
This time might be different. Simon-Miller and Orton think Red Jr. could lose its red color, ironically, by passing too close to the Great Red Spot.
Red Jr./Oval BA wasn’t always red. For five years, 2000 to 2005, the storm was pure white like many other small “white ovals” circling the planet. In 2006 astronomers noticed a change: a red vortex formed inside the storm, the same color as the powerful Great Red Spot. This was a sign, researchers believed, that Oval BA was intensifying.
The color of the Great Red Spot itself is a mystery. A popular theory holds that the storm dredges up material from deep inside Jupiter’s atmosphere, lifting it above the highest clouds where solar ultraviolet rays turn “chromophores” (color-changing compounds) red. A beefed-up Oval BA could suddenly do the same.
Bumping up against the Great Red Spot, however, could weaken Oval BA, turning it white again. Simon-Miller explains: “We believe the Great Red Spot will push Oval BA toward a southern jet stream, which is blowing against the oval’s counterclockwise rotation.” This would slow Oval BA’s spin, possibly reversing the process that reddened it in the first place.
What will actually happen? “We’ll see,” she says. That’s what telescopes are for.
Note to sky watchers: Jupiter is easy to find. It pops out of the evening twilight before any other star, surprisingly bright. Look for it halfway up the southeastern sky at sunset: sky map.
Original Source: NASA News Release
Hubble Pictures of Red Spot Jr.
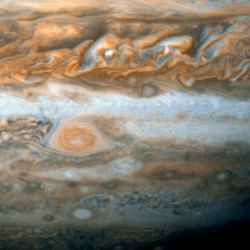
Jupiter’s junior red spot. Image credit: NASA/ESA. Click to enlarge
The Hubble Space Telescope has snapped a picture of “Red Spot Jr.”, the newly forming storm on Jupiter. This new spot is half the size of Jupiter’s Great Red Spot, and formed after three white storms merged together. But when viewed in near-infrared wavelengths, the spot is as prominent as the Great Red Spot, so this is a big storm too. Scientists think that Jupiter might be in the midst of a global climate change, warming up a few degrees in some latitudes.
NASA’s Hubble Space Telescope is giving astronomers their most detailed view yet of a second red spot emerging on Jupiter. For the first time in history, astronomers have witnessed the birth of a new red spot on the giant planet, which is located half a billion miles away. The storm is roughly one-half the diameter of its bigger and legendary cousin, the Great Red Spot. Researchers suggest that the new spot may be related to a possible major climate change in Jupiter’s atmosphere.
Dubbed by some astronomers as “Red Spot Jr.,” the new spot has been followed by amateur and professional astronomers for the past few months. But Hubble’s new images provide a level of detail comparable to that achieved by NASA’s Voyager 1 and 2 spacecraft as they flew by Jupiter a quarter-century ago.
Before it mysteriously changed to the same color as the Great Red Spot, the smaller spot was known as the White Oval BA. It formed after three white oval-shaped storms merged during 1998 to 2000. At least one or two of the progenitor white ovals can be traced back to 90 years ago, but they may have been present earlier. A third spot appeared in 1939. (The Great Red Spot has been visible for the past 400 years, ever since earthbound observers had telescopes to see it).
When viewed at near-infrared wavelengths (specifically 892 nanometers – a methane gas absorption band) Red Spot Jr. is about as prominent in Jupiter’s cloudy atmosphere as the Great Red Spot. This may mean that the storm rises miles above the top of the main cloud deck on Jupiter just as its larger cousin is thought to do. Some astronomers think the red hue could be produced as the spots dredge up material from deeper in Jupiter’s atmosphere, which is then chemically altered by the Sun’s ultraviolet light.
Researchers think the Hubble images may provide evidence that Jupiter is in the midst of a global climate change that will alter its average temperature at some latitudes by as much as 10 degrees Fahrenheit. The transfer of heat from the equator to the planet’s south pole is predicted to nearly shut off at 34 degrees southern latitude, the latitude where the second red spot is forming. The effects of the shut-off were predicted by Philip Marcus of the University of California, Berkeley (UCB) to become apparent approximately seven years after the White Oval collisions in 1998 to 2000.
Two teams of astronomers were given discretionary time on Hubble to observe the new red spot.
Original Source: HubbleSite News Release
Jupiter Will Be Closest on May 6th
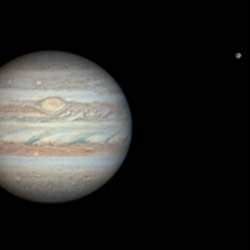
Jupiter and its moon Ganymede. Image credit: Alan Friedman. Click to enlarge
Look east in the early evening and you’ll see a very bright star. Well, that’s not a star, it’s Jupiter – and now’s the best time to go take a look at it. Jupiter will reach its closest approach to the Earth on May 6th. Even in small backyard telescopes, many features of the planet are visible, including its bands and 4 larger moons. If you’ve got a larger telescope, you might be able to pick out the newly formed storm dubbed “Red Spot Jr.”.
If you feel the urge to look up at the sky this month, you might be feeling the pull of Jupiter.
The giant planet is having a close encounter with Earth all month long. On May 6th, the date of closest approach, Jupiter will be 410 million miles away, which is almost 200 million miles closer than it was just six months ago in October. This makes Jupiter unusually big and bright.
Look for it rising in the east at sunset. Jupiter is unmistakable, shining ten times brighter than any star around it. The view through a backyard telescope is dynamite. You can see Jupiter’s cloud belts, the Great Red Spot and four large moons (Io, Europa, Ganymede and Callisto) circling the planet.
When you look at Jupiter through a telescope, you might notice something odd: the planet looks squashed. Your eyes are okay. Jupiter truly bulges around the middle because it spins so fast. One complete turn of the planet takes only 10 hours. That’s more than 300 Earth masses (almost enough to make a star) spinning like a nimble asteroid.
This spinning allows you to see the entire planet in a single night. On May 6th, Jupiter is “up” for more than 10 hours, or one complete turn. Judo astronomers will attempt a Jupiter marathon: In 10 hours you can see the innermost moons of Jupiter move from one side of the planet to the other. You can watch the Great Red Spot, a hurricane twice as wide as Earth, churn across Jupiter’s cloudtops. You might even see “Red Jr.,” a baby Great Red Spot trailing the original by about 2 hours: full story.
Although closest approach is May 6th, the best night to look is May 11th when the full Moon and Jupiter appear side by side. The pair will rise in tandem at sunset and remain beautifully close together all night long. With a telescope you can quickly scan back and forth: The lunar Alps. The moons of Jupiter. The Sea of Tranquillity. The Great Red Spot.
This is a sky map.
Do you feel the pull yet?
Let’s calculate: Jupiter is 318 times more massive than Earth and 410 million miles away. According to Newton’s Law of Universal Gravitation, Jupiter pulls you up 34 million times less than Earth pulls you down. Jupiter’s “pull” is utterly feeble.
So it’s all in your mind. But don’t let that stop you: give in to the pull!
Original Source: NASA News Release
Cassini’s View of Jupiter’s South Pole
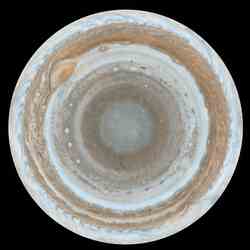
Jupiter as mapped by Cassini. Image credit: NASA/JPL/SSI Click to enlarge
Cassini took many photographs of Jupiter on the way to Saturn, including this unusual montage of its southern pole. This photograph was made up of 36 separate images, stitched together on computer. The planet looks strange because the photo is a polar stereographic projections, which shows the southern pole in the middle, and the equator at the edges. The original images were captured on December 11th and 12th, 2000.
These color maps of Jupiter were constructed from images taken by the narrow-angle camera onboard NASA’s Cassini spacecraft on Dec. 11 and 12, 2000, as the spacecraft neared Jupiter during its flyby of the giant planet. Cassini was on its way to Saturn. They are the most detailed global color maps of Jupiter ever produced; the smallest visible features are about 120 kilometers (75 miles) across. For other maps see PIA07782 and PIA07783. (Related thumbnail images available here.)
The maps are composed of 36 images: a pair of images covering Jupiter’s northern and southern hemispheres was acquired in two colors every hour for nine hours as Jupiter rotated beneath the spacecraft. Although the raw images are in just two colors, 750 nanometers (near-infrared) and 451 nanometers (blue), the map’s colors are close to those the human eye would see when gazing at Jupiter.
The maps show a variety of colorful cloud features, including parallel reddish-brown and white bands, the Great Red Spot, multi-lobed chaotic regions, white ovals and many small vortices. Many clouds appear in streaks and waves due to continual stretching and folding by Jupiter’s winds and turbulence. The bluish-gray features along the north edge of the central bright band are equatorial “hot spots,” meteorological systems such as the one entered by NASA’s Galileo probe. Small bright spots within the orange band north of the equator are lightning-bearing thunderstorms. The polar regions shown here are less clearly visible because Cassini viewed them at an angle and through thicker atmospheric haze.
The round maps are polar stereographic projections that show the north or south pole in the center of the map and the equator at the edge.
The Cassini-Huygens mission is a cooperative project of NASA, the European Space Agency and the Italian Space Agency. The Jet Propulsion Laboratory, a division of the California Institute of Technology in Pasadena, manages the mission for NASA’s Science Mission Directorate, Washington, D.C. The Cassini orbiter and its two onboard cameras were designed, developed and assembled at JPL. The imaging operations center is based at the Space Science Institute in Boulder, Colo.
For more information about the Cassini-Huygens mission visit http://saturn.jpl.nasa.gov . The Cassini imaging team homepage is at http://ciclops.org .
Original Source: NASA/JPL/SSI News Release
Jupiter’s Next Great Red Spot
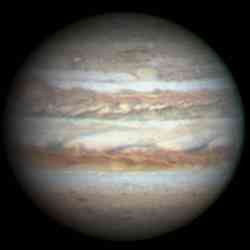
Red spots on Jupiter. Image credit: Christopher Go. Click to enlarge
If you’re an amateur astronomer with a reasonably good telescope, you might be able to see a new red spot on Jupiter. Its official name is Oval BA, and it’s half the size the of the famous Great Red Spot. It first appeared in 2000 when three smaller storms collided and merged together. It started out white, then changed to brown, and now it’s the same colour as the Great Red Spot. It’s possible that huge storms like this dredge material from deep beneath Jupiter’s cloud tops, and then ultraviolet light from the Sun changes it red.
Backyard astronomers, grab your telescopes. Jupiter is growing a new red spot.
Christopher Go of the Philippines photographed it on February 27th using an 11-inch telescope and a CCD camera:
The official name of this storm is “Oval BA,” but “Red Jr.” might be better. It’s about half the size of the famous Great Red Spot and almost exactly the same color.
Oval BA first appeared in the year 2000 when three smaller spots collided and merged. Using Hubble and other telescopes, astronomers watched with great interest. A similar merger centuries ago may have created the original Great Red Spot, a storm twice as wide as our planet and at least 300 years old.
At first, Oval BA remained white?the same color as the storms that combined to create it. But in recent months, things began to change:
“The oval was white in November 2005, it slowly turned brown in December 2005, and red a few weeks ago,” reports Go. “Now it is the same color as the Great Red Spot!”
“Wow!” says Dr. Glenn Orton, an astronomer at JPL who specializes in studies of storms on Jupiter and other giant planets. “This is convincing. We’ve been monitoring Jupiter for years to see if Oval BA would turn red – and it finally seems to be happening.” (Red Jr? Orton prefers “the not-so-Great Red Spot.”)
Why red?
Curiously, no one knows precisely why the Great Red Spot itself is red. A favorite idea is that the storm dredges material from deep beneath Jupiter’s cloudtops and lifts it to high altitudes where solar ultraviolet radiation–via some unknown chemical reaction?produces the familiar brick color.
“The Great Red Spot is the most powerful storm on Jupiter, indeed, in the whole solar system,” says Orton. The top of the storm rises 8 km above surrounding clouds. “It takes a powerful storm to lift material so high,” he adds.
Oval BA may have strengthened enough to do the same. Like the Great Red Spot, Red Jr. may be lifting material above the clouds where solar ultraviolet rays turn “chromophores” (color-changing compounds) red. If so, the deepening red is a sign that the storm is intensifying.
“Some of Jupiter’s white ovals have appeared slightly reddish before, for example in late 1999, but not often and not for long,” says Dr. John Rogers, author of the book “Jupiter: The Giant Planet,” which recounts telescopic observations of Jupiter for the last 100+ years. “It will indeed be interesting to see if Oval BA becomes permanently red.”
See for yourself: Jupiter is easy to find in the dawn sky. Step outside before sunrise, look south and up: sky map. Jupiter outshines everything around it. Small telescopes have no trouble making out Jupiter’s cloudbelts and its four largest moons. Telescopes 10-inches or larger with CCD cameras should be able to track Red Jr. with ease.
What’s next? Will Red Jr. remain red? Will it grow or subside? Stay tuned for updates.
Original Source: NASA News Release
Researchers mimic high-pressure form of ice found in giant icy moons
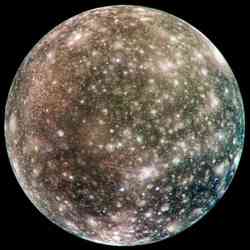
Jupiter’s icy moon Callisto. Image credit: NASA Click to enlarge
As scientists learn more about our Solar System, they’ve found water ice in some unusual situations. One of the most intriguing of these environments is on icy moons, like Jupiter’s Europa, and Uranus’ Triton. Researchers at the Lawrence Livermore National Laboratory have recreated this kind of ice in their laboratory; ice that probably mimics the conditions of pressure, temperature, stress, and grain size found on these moons. This ice can slowly creep and swirl around depending on the temperature of the moons’ interiors.
That everyday ice you use to chill your glass of lemonade has helped researchers better understand the internal structure of icy moons in the far reaches of the solar system.
A research team has demonstrated a new kind of “creep,” or flow, in a high-pressure form of ice by creating in a laboratory the conditions of pressure, temperature, stress, and grain size that mimic those in the deep interiors of large icy moons.
High-pressure phases of ice are major components of the giant icy moons of the outer solar system: Jupiter’s Ganymede and Callisto, Saturn’s Titan, and Neptune’s Triton. Triton is roughly the size of our own moon; the other three giants are about 1.5 times larger in diameter. Accepted theory says that most of the icy moons condensed as “dirty snowballs” from the dust cloud around the sun (the solar nebula) about 4.5 billion years ago. The moons were warmed internally by this accretionary process and by radioactive decay of their rocky fraction.
The convective flow of ice (much like the swirls in a hot cup of coffee) in the interiors of the icy moons controlled their subsequent evolution and present-day structure. The weaker the ice, the more efficient the convection, and the cooler the interiors. Conversely, the stronger the ice, the warmer the interiors and the greater the possibility of something like a liquid internal ocean appearing.
The new research reveals in one of the high-pressure phases of ice (“ice II”) a creep mechanism that is affected by the crystallite or “grain” size of the ice. This finding implies a significantly weaker ice layer in the moons than previously thought. Ice II first appears at pressures of about 2,000 atmospheres, which corresponds to a depth of about 70 km in the largest of the icy giants. The ice II layer is roughly 100 km thick. The pressure levels at the centers of the icy giant moons eventually reach the equivalent of 20,000 to 40,000 Earth atmospheres.
Researchers from Lawrence Livermore National Laboratory (LLNL), Kyushu University in Japan and the U.S. Geological Survey conducted creep experiments using a low-temperature testing apparatus in the Experimental Geophysics Laboratory at LLNL. They then observed and measured ice II grain size using a cryogenic scanning electron microscope. The group found a creep mechanism that dominates flow at lower stresses and finer grain sizes. Earlier experiments at higher stresses and larger grain size activated flow mechanisms that did not depend on grain size.
The experimentalists were able to prove that the new creep mechanism was indeed related to the size of the ice grains, something that previously had only been examined theoretically.
But the measurement was no easy feat. First, they had to create ice II of very fine grain size (less than 10 micrometers, or one-tenth the thickness of a human hair). A technique of rapid cycling of pressure above and below 2,000 atmospheres eventually did the trick. Adding to that, the team maintained a very steady 2,000 atmospheres of pressure within the testing apparatus to run a low-stress deformation experiment for weeks on end. Finally, to delineate the ice II grains and make them visible in the scanning electron microscope, the team developed a method of marking the grain boundaries with the common form of ice (“ice I”), which appeared different from ice II in the microscope. Once the boundaries were identified, the team could measure ice II’s grain size.
“These new results show that the viscosity of a deep icy mantle is much lower than we previously thought,” said William Durham, a geophysicist in Livermore’s Energy and Environment Directorate.
Durham said the high-quality behavior of the test apparatus at 2,000 atmospheres pressure, the collaboration with Tomoaki Kubo of Kyushu University, and success in overcoming serious technical challenges made for a fortuitous experiment.
Using the new results, the researchers conclude that it is likely the ice deforms by the grain size-sensitive creep mechanism in the interior of icy moons when the grains are up to a centimeter in size.
“This newly discovered creep mechanism will change our thinking of the thermal evolution and internal dynamics of medium- and large-size moons of the outer planets in our solar system,” Durham said. “The thermal evolution of these moons can help us explain what was happening in the early solar system.”
The research appears in the March 3 issue of the journal Science.
Founded in 1952, Lawrence Livermore National Laboratory has a mission to ensure national security and apply science and technology to the important issues of our time. Lawrence Livermore National Laboratory is managed by the University of California for the U.S. Department of Energy’s National Nuclear Security Administration.
Original Source: LLNL News Release
What’s Inside a Gas Giant?
University of Minnesota researchers Renata Wentzcovitch and Koichiro Umemoto and Philip B. Allen of Stony Brook University have modeled the properties of rocks at the temperatures and pressures likely to exist at the cores of Jupiter, Saturn and two exoplanets far from the solar system. They show that rocks in these environments are different from those on Earth and have metallic-like electric and thermal conductivity. These properties can produce different terrestrial-type planets, with longer-lasting magnetic fields, enhanced heat flow to the planetary surfaces and, consequently, more intense “planetquake” and volcanic activity.
This work builds on the authors’ recent work on Earth’s inner layers and represents a step toward understanding how all planets, including Earth, come to acquire their individual characteristics. The research is published in the Feb. 17 issue of Science. In the previous work, Wentzcovitch and her colleagues studied the D” (“Dee double prime”) layer deep in the Earth.
D” runs from zero to 186 miles thick and surrounds the iron core of our planet. It lies just below Earth’s mantle, which is largely composed of a mineral called perovskite, consisting of magnesium, silicon and oxygen. Wentzcovitch and her team calculated that in D” the great temperatures and pressures changed the structure of perovskite crystals, transforming the mineral into one called “post-perovskite.”
In the new work, the researchers turned their attention to the cores of the giant planets of our solar system – Jupiter, Saturn, Uranus and Neptune – and two recently discovered extrasolar planets, or exoplanets, found elsewhere in the Milky Way. One, referred to as Super-Earth, is about seven times the mass of Earth and orbits a star 15 light-years away in the constellation Aquarius. The other, Dense-Saturn, has about the same mass as Saturn and orbits a star 257 light-years away in the constellation Hercules.
The researchers calculated what would happen at temperatures and pressures likely near the cores of the two exoplanets, Jupiter and Saturn, where temperatures run close to 18,000 F and pressures 10 million bars (a bar is essentially atmospheric pressure at sea level). They found that even post-perovskite could not withstand such conditions, and its crystals would dissociate into two new forms. Focusing on one of those crystals, the researchers discovered that they would behave almost like metals.
That is, electrons in the crystals would be very mobile and carry electric current. This would have the effect of supporting the planet’s magnetic field (if it has one) and inhibiting reversals of the field. The increased electrical activity would also help transport energy out of the core and toward the planet surface. This could result in more severe activities such as quakes and volcanoes on the surface. The effect would be much stronger in Dense-Saturn than in Super-Earth.
The interiors of the icy giants Uranus and Neptune don’t exhibit such extremes of temperature and pressure, and so post-perovskite would survive in their cores, she said. “We want to understand how planets formed and evolved and how they are today. We need to understand how their interiors behave under these extreme pressure and temperatures conditions. Only then it will be possible to model them. This will advance the field of comparative planetology,” said Wentzcovitch. “We will understand Earth better if we can see it in the context of a variety of different kinds of planets.”

