Another Monster Black Hole Found in the Milky Way

Molecular clouds scattered by an intermediate black hole show very wide velocity dispersion in this artist’s impression. This scenario well explains the observational features of a peculiar molecular cloud CO-0.40-0.22. Credit: Keio University

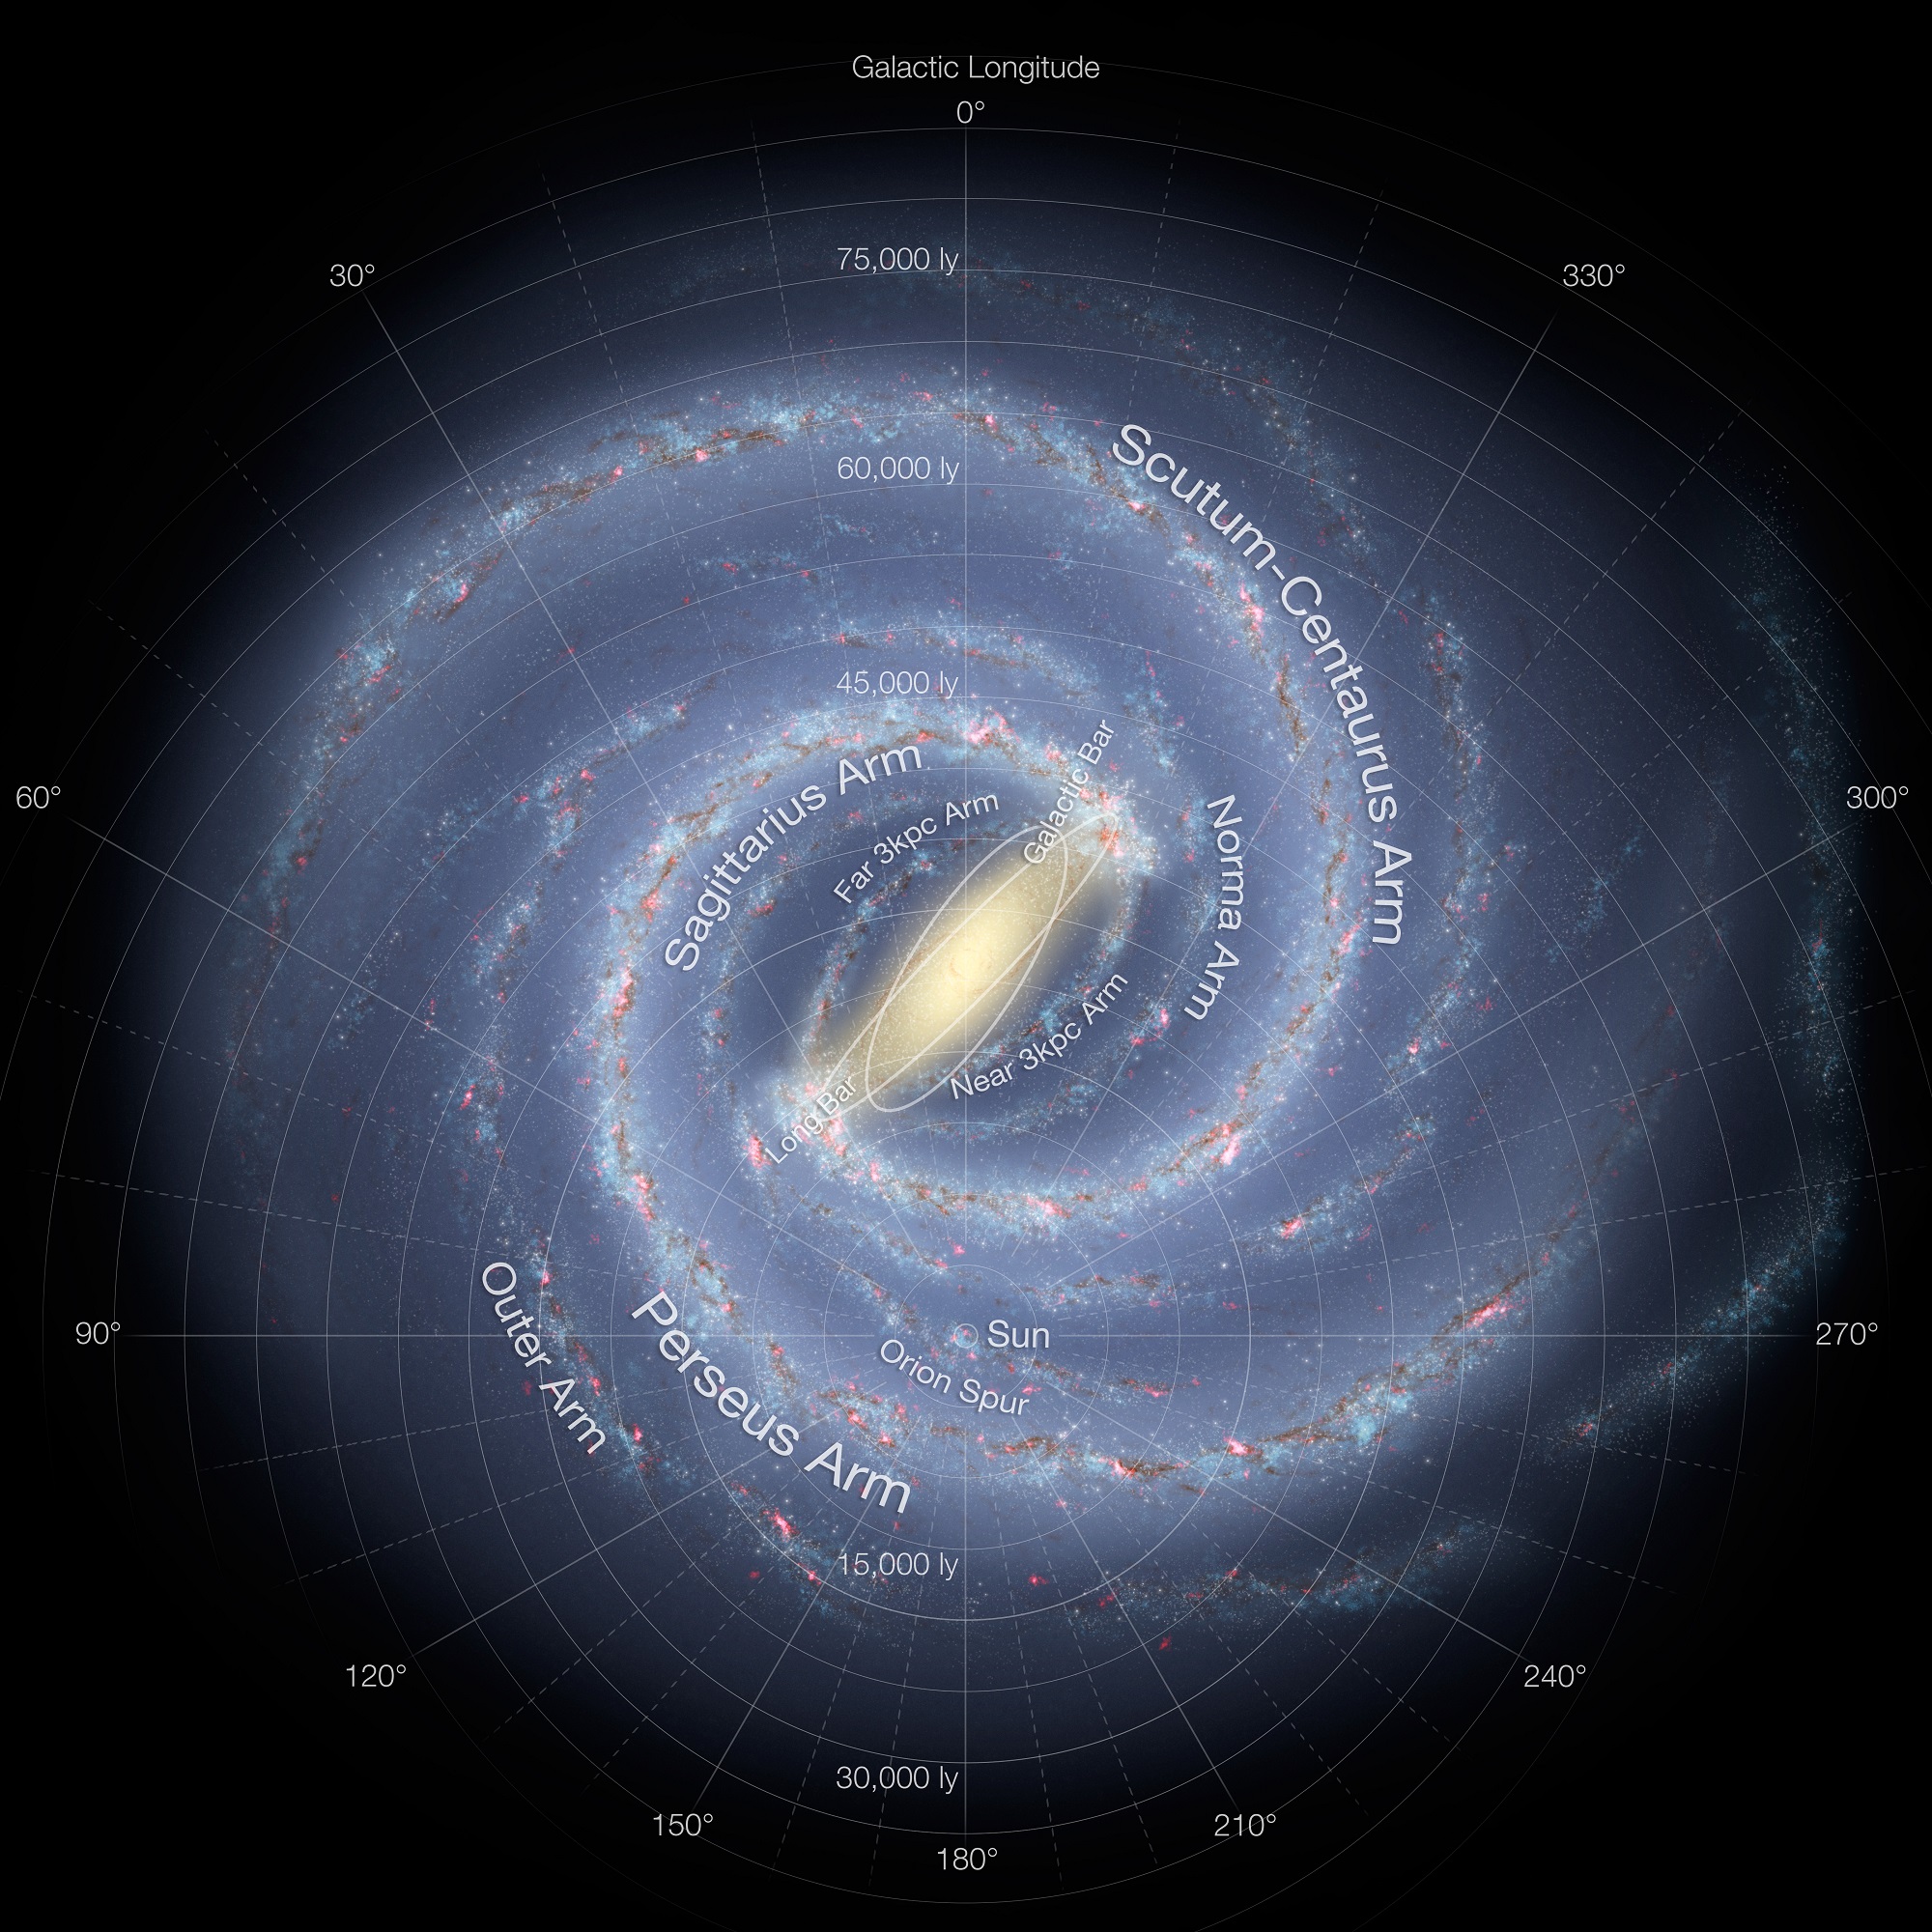
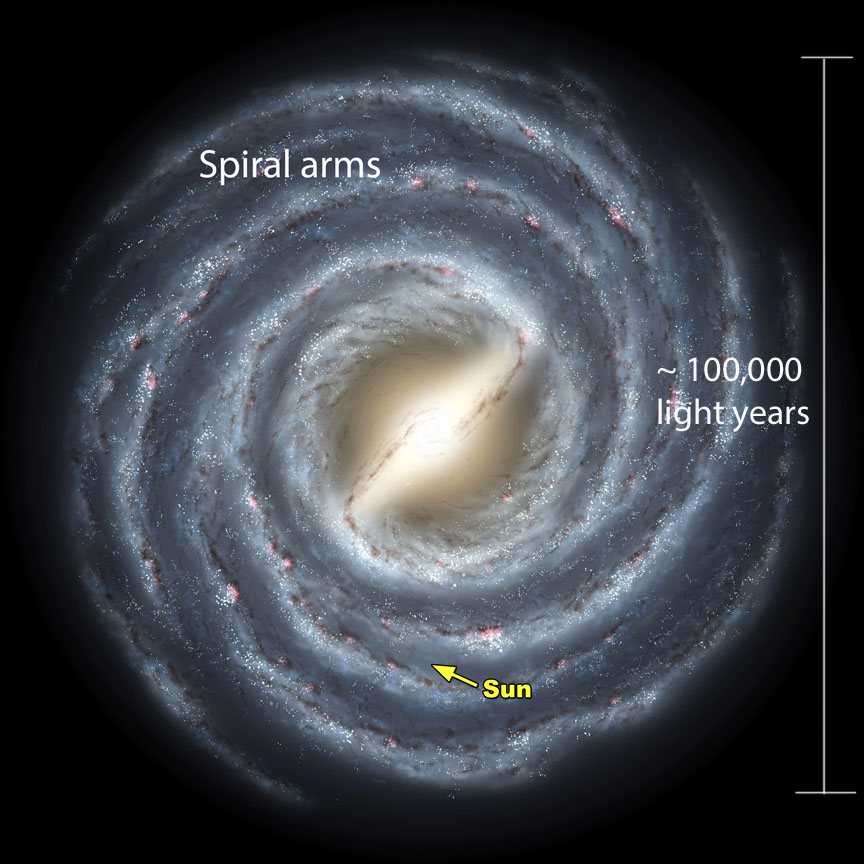
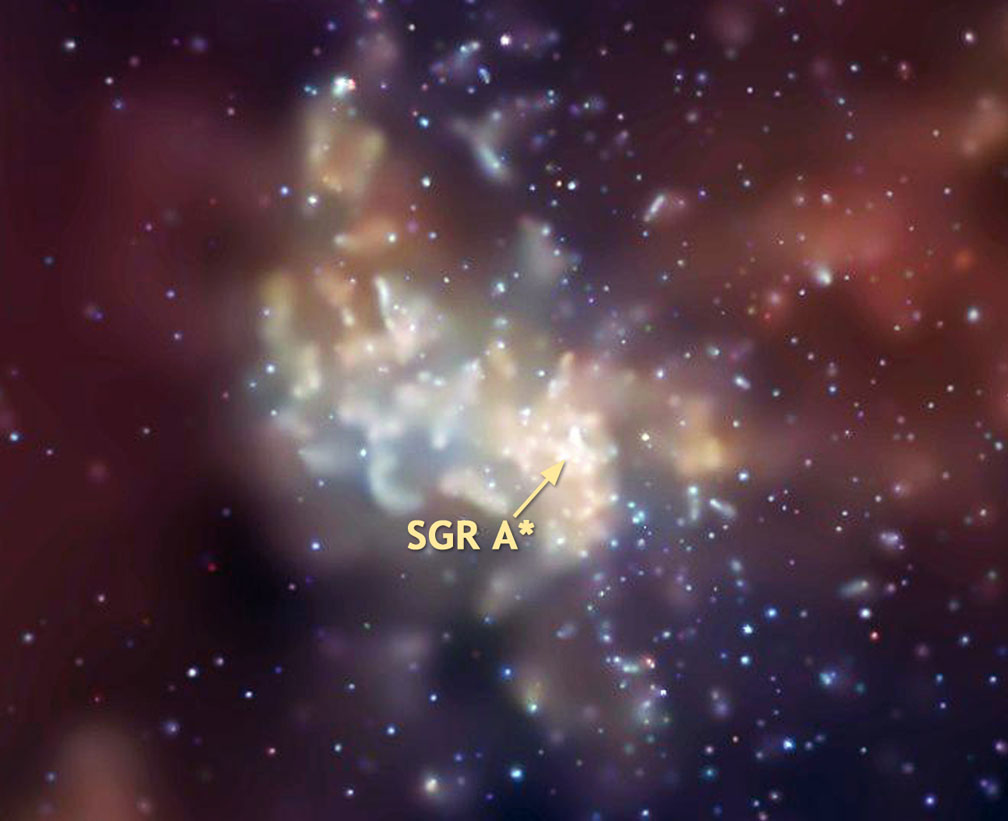
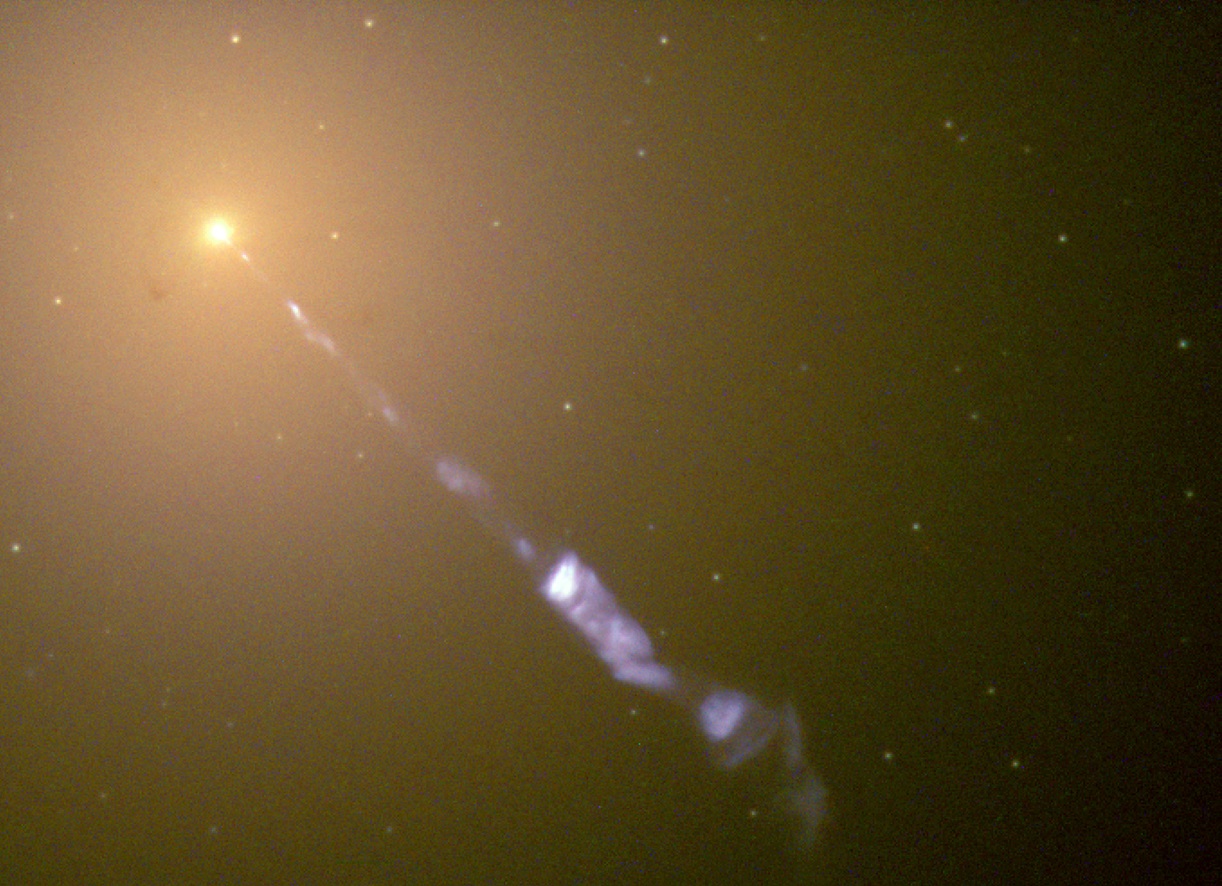
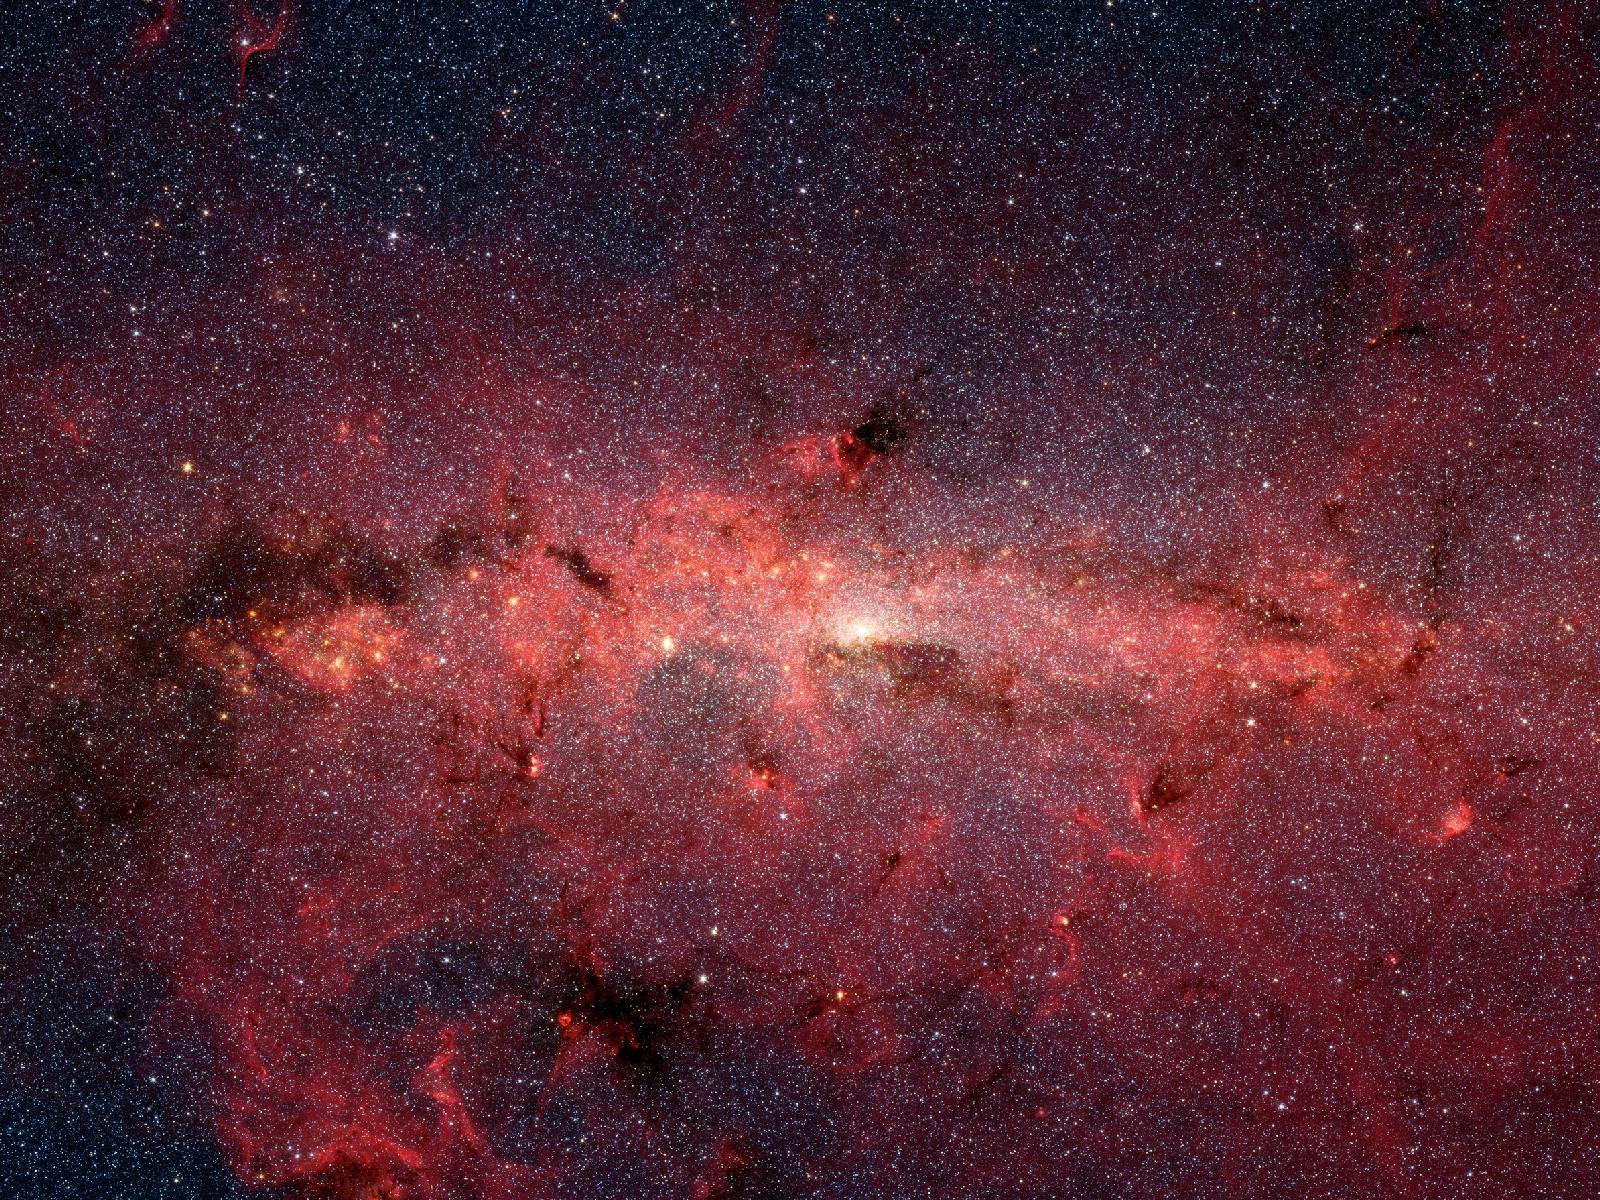
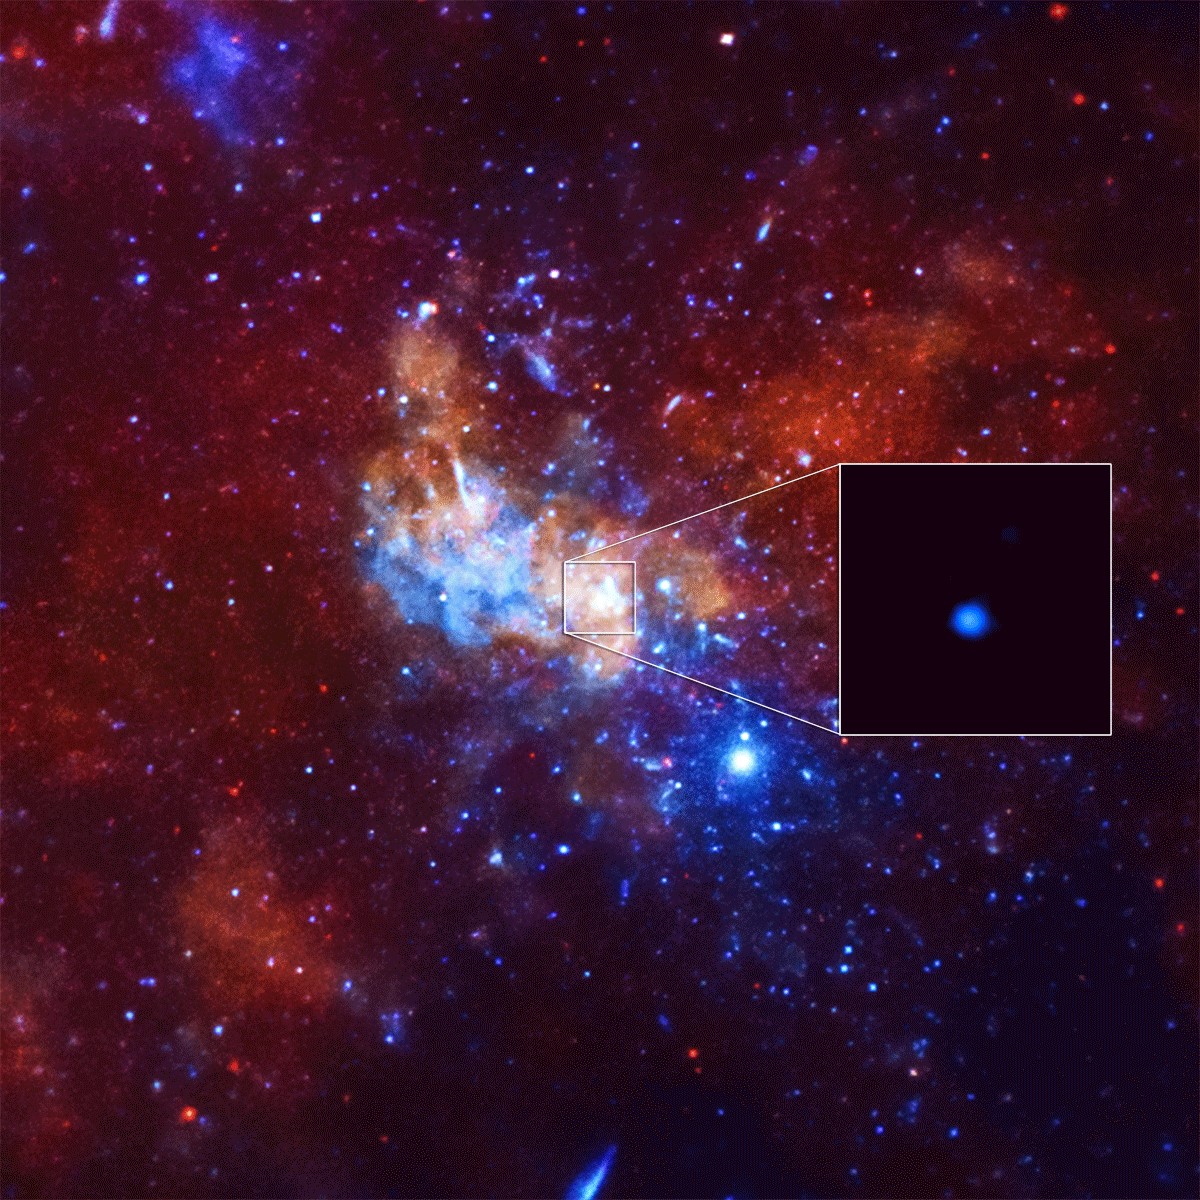
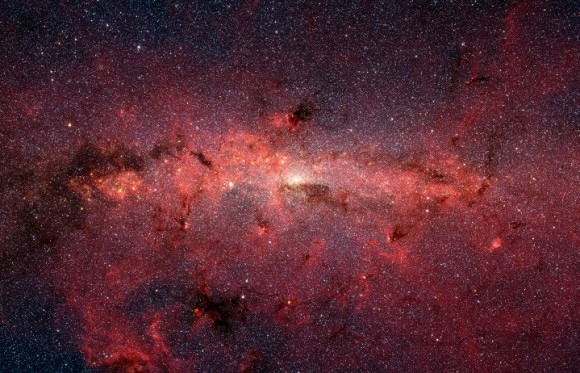
At the center of the Milky Way Galaxy resides the Supermassive Black Hole (SMBH) known as Sagittarius A*. This tremendous black hole measures an estimated 44 million km in diameter, and has the mass of over 4 million Suns. For decades, astronomers have understood that most larger galaxies have an SMBH at their core, and that these range from hundreds of thousands to billions of Solar Masses.

However, new research performed by a team of researchers from Keio University, Japan, has made a startling find. According to their study, the team found evidence of a mid-sized black hole in a gas cluster near the center of the Milky Way Galaxy. This unexpected find could offer clues as to how SMBHs form, which is something that astronomers have been puzzling over for some time.

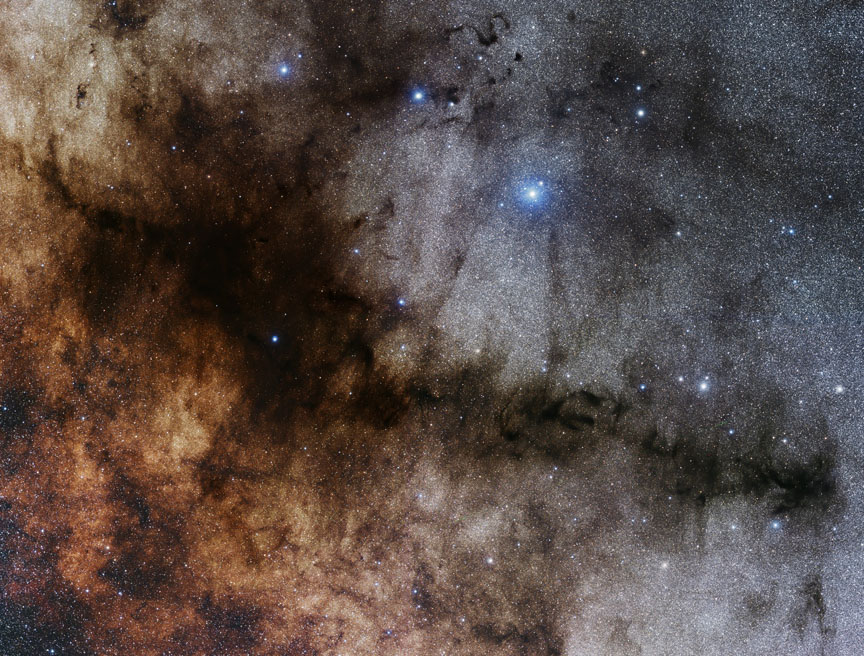
The study, titled “Millimetre-wave Emission from an Intermediate-mass Black Hole Candidate in the Milky Way“, recently appeared in the journal Nature Astronomy. Led by Tomoharu Oka, a researcher from the Department of Physics and the School of Fundamental Science and Technology at Keio University, the team studied CO–0.40–0.22, a high-velocity compact gas cloud near the center of our galaxy.

This artist’s concept shows a galaxy with a supermassive black hole at its core. The black hole is shooting out jets of radio waves.Image credit: NASA/JPL-Caltech

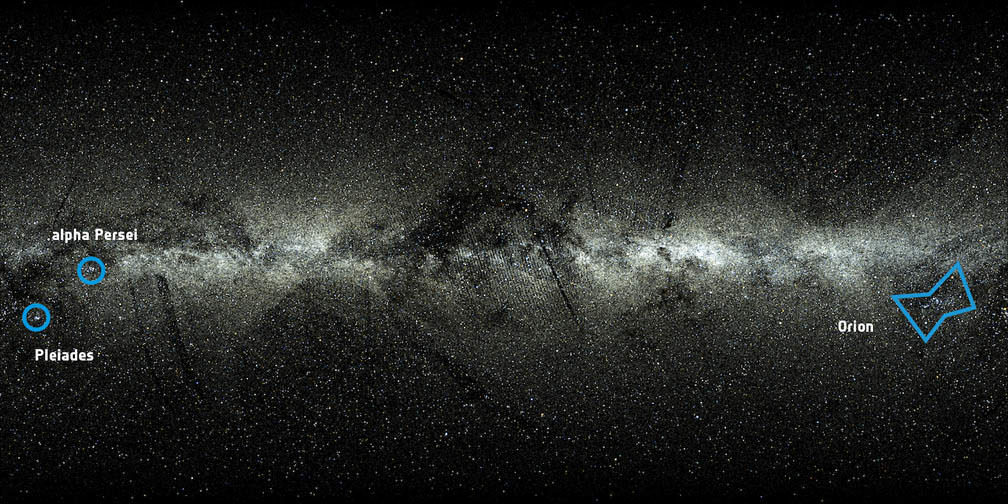
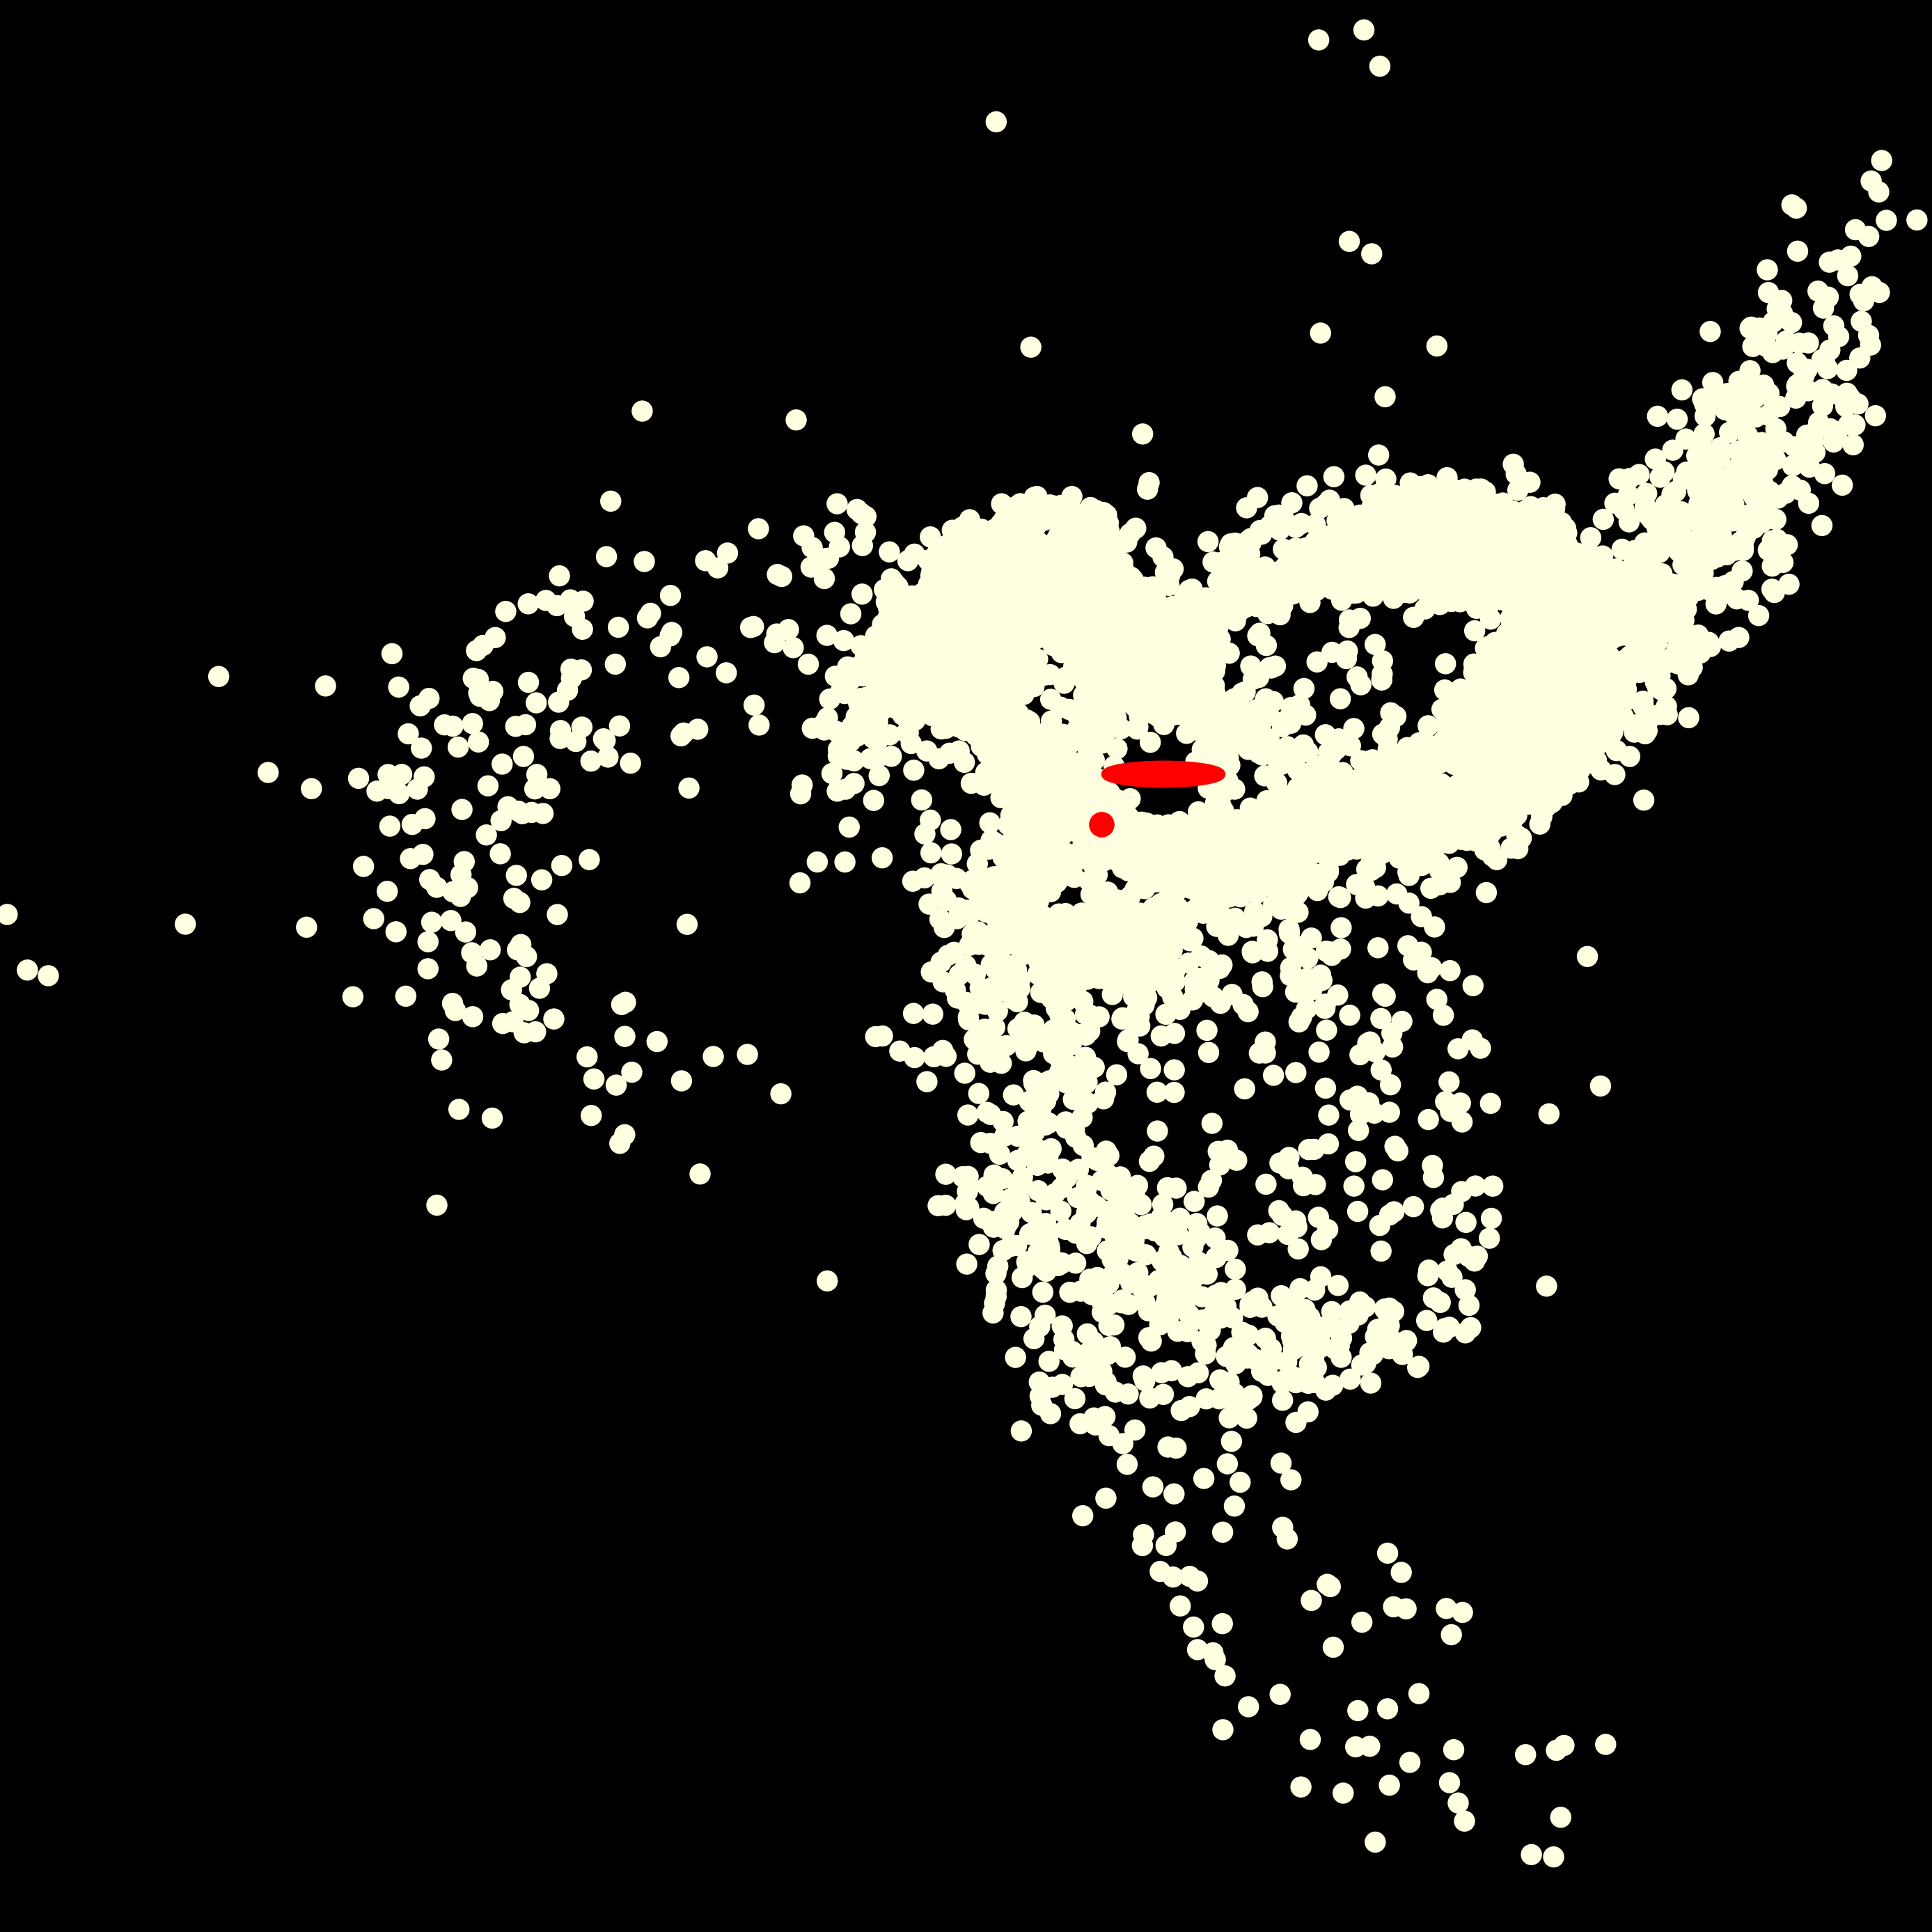
This compact dust cloud, which has been a source of fascination to astronomers for years, measures over 1000 AU in diameter and is located about 200 light-years from the center of our galaxy. The reason for this interest has to do with the fact that gases in this cloud – which include hydrogen cyanide and carbon monoxide – move at vastly different speeds, which is something unusual for a cloud of interstellar gases.

In the hopes of better understanding this strange behavior, the team originally observed CO–0.40–0.22 using the 45-meter radio telescope at the Nobeyama Radio Observatory in Japan. This began in January of 2016, when the team noticed that the cloud had an elliptical shape that consisted of two components. These included a compact but low density component with varying velocities, and a dense component (10 light years long) with little variation.

After conducting their initial observations, the team then followed up with observations from the Atacama Large Millimeter/submillimeter Array (ALMA) in Chile. These confirmed the structure of the cloud and the variations in speed that seemed to accord with density. In addition, they observed the presence of radio waves (similar to those generated by Sagittarius A*) next to the dense region. As they state in their study:

“Recently, we discovered a peculiar molecular cloud, CO–0.40–0.22, with an extremely broad velocity width, near the center of our Milky Way galaxy. Based on the careful analysis of gas kinematics, we concluded that a compact object with a mass of about 105 [Solar Masses] is lurking in this cloud.”

Change image showing the area around Sgr A*, where low, medium, and high-energy X-rays are red, green, and blue, respectively. The inset box shows X-ray flares from the region close to Sgr A*. NASA: NASA/SAO/CXC

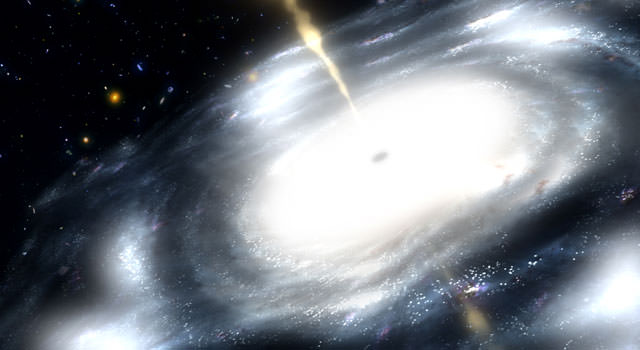
The team also ran a series of computer models to account for these strange behaviors, which indicated that the most likely cause was a black hole. Given its mass – 100,000 Solar Masses, or roughly 500 times smaller than that of Sagittarius A* – this meant that the black hole was intermediate in size. If confirmed, this discovery will constitute the second-largest black hole to be discovered within the Milky Way.

This represents something of a first for astronomers, since the vast majority of black holes discovered to date have been either small or massive. Studies that have sought to locate Intermediate Black Holes (IMBHs), on the other hand, have found very little evidence of them. Moreover, these findings could account for how SMBHs form at the center of larger galaxies.

In the past, astronomers have conjectured that SMBHs are formed by the merger of smaller black holes, which implied the existence of intermediate ones. As such, the discovery of an IMBH would constitute the first piece of evidence for this hypothesis. As Brooke Simmons, a professor at the University of California in San Diego, explained in an interview with The Guardian:

“We know that smaller black holes form when some stars die, which makes them fairly common. We think some of those black holes are the seeds from which the much larger supermassive black holes grow to at least a million times more massive. That growth should happen in part by mergers with other black holes and in part by accretion of material from the part of the galaxy that surrounds the black hole.

“Astrophysicists have been collecting observational evidence for both stellar mass black holes and supermassive black holes for decades, but even though we think the largest ones grow from the smallest ones, we’ve never really had clear evidence for a black hole with a mass in between those extremes.”

Artist’s impression of two merging black holes, which has been theorized to be a source of gravitational waves. Credit: Bohn, Throwe, Hébert, Henriksson, Bunandar, Taylor, Scheel/SXS

Further studies will be needed to confirm the presence of an IMBH at the center of CO–0.40–0.22. Assuming they succeed, we can expect that astrophyiscists will be monitoring it for some time to determine how it formed, and what it’s ultimate fate will be. For instance, it is possible that it is slowly drifting towards Sagittarius A* and will eventually merge with it, thus creating an even more massive SMBH at the center of our galaxy!

Assuming human beings are around to detect that merger, its fair to say that it won’t go unnoticed. The gravitational waves alone are sure to be impressive!

Further Reading: Nature Astronomy

What Is the Name Of Our Galaxy?

The band of light (the Milky Way) that is visible in the night sky, showing the stellar disk of our galaxy. Credit: Bob King

Since prehistoric times, human beings have looked up at at the night sky and pondered the mystery of the band of light that stretches across the heavens. And while theories have been advanced since the days of Ancient Greece as to what it could be, it was only with the birth of modern astronomy that scholars have come come to know precisely what it is – i.e. countless stars at considerable distances from Earth.

The term “Milky Way”, a term which emerged in Classical Antiquity to describe the band of light in the night sky, has since gone on to become the name for our galaxy. Like many others in the known Universe, the Milky Way is a barred, spiral galaxy that is part of the Local Group – a collection of 54 galaxies. Measuring 100,000 – 180,000 light-years in diameter, the Milky Way consists of between 100 and 400 billion stars.

Structure:

The Milky Way consists of a Galactic Center that is shaped like a bar and a Galactic Disk made up of spiral arms, all of which is surrounded by the Halo – which is made up of old stars and globular clusters. The Center, also known as “the bulge”,  is a dense concentration of mostly old stars that measures about 10,000 light years in radius. This region is also the rotational center of the Milky Way.

Illustration of the supermassive black hole at the center of the Milky Way. Credit: NRAO/AUI/NSF

The Galactic Center is also home to an intense radio source named Sagittarius A*, which is believed to have a supermassive black hole (SMBH) at its center. The presence of this black hole has been discerned due to the apparent gravitational influence it has on surrounding stars. Astronomers estimate that it has a mass of between 4.1. and 4.5 million Solar masses.

Outside the barred bulge at the Galactic Center is the Galactic Disk of the Milky Way. This consists of stars, gas and dust which is organized into four spiral arms. These arms typically contain a higher density of interstellar gas and dust than the Galactic average, as well as a greater concentration of star formation. While there is no consensus on the exact structure or extent of these spiral arms, they are commonly grouped into two or four different arms.

In the case of four arms, this is based on the traced paths of gas and younger stars in our galaxy, which corresponds to the Perseus Arm, the Norma and Outer Arm, the Scutum-Centaurum Arm, and the Carina-Sagittarius Arm. There are also at least two smaller arms, which include the Cygnus Arm and the Orion Arm. Meanwhile, surveys based on the presence of older stars show only two major spirals arms – the Perseus arm and the Scutum–Centaurus arm.

Beyond the Galactic Disk is the Halo, which is made up of old stars and globular clusters – 90% of which lie within 100,000 light-years (30,000 parsecs) from the Galactic Center. Recent evidence provided by X-ray observatories indicates that in addition to this stellar halo, the Milky way also has a halo of hot gas that extends for hundreds of thousands of light years.

Artist’s conception of the spiral structure of the Milky Way with two major stellar arms and a bar. Credit: NASA/JPL-Caltech/ESO/R. Hurt

Size and Mass:

The Galactic Disk of the Milky Way Galaxy is approximately 100,000 light years in diameter and about 1,000 light years thick. It is estimated to contain between 100 and 400 billion stars, though the exact figure depends on the number of very low-mass M-type (aka. red dwarf) stars. This is difficult to determine because these stars also have low-luminosity compared to other class.

The distance from the Sun to the Galactic Center is estimated to be between 25,000 to 28,000 light years (7,600 to 8,700 parsecs). The Galactic Center’s bar (aka. its “bulge”)  is thought to be about 27,000 light-years in length and is composed primarily of red stars, all of which are thought to be ancient. The bar is surrounded by the ‘5-kpc ring’, a region that contains much of the galaxy’s molecular hydrogen and where star-formation is most intense.

The Galactic Disk has a diameter of between 70,000 and 100,000 light-years. It does not have a sharp edge, a radius beyond which there are no stars. However, the number of stars drops slowly with distance from the center. Beyond a radius of roughly 40,000 light years, the number of stars drops much faster the farther you get from the center.

Location of the Solar System:

The Solar System is located near the inner rim of the Orion Arm, a minor spiral arm located between the Carina–Sagittarius Arm and the Perseus Arm. This arm measures some 3,500 light-years (1,100 parsecs) across,  approximately 10,000 light-years (3,100 parsecs) in length, and is at a distance of about 25,400 to 27,400 light years (7.78 to 8.4 thousand parsecs) from the Galactic Center.

History of Observation:

Our galaxy was named because of the way the haze it casts in the night sky resembled spilled milk. This name is also quite ancient. It is translation from the Latin “Via Lactea“, which in turn was translated from the Greek for Galaxias, referring to the pale band of light formed by stars in the galactic plane as seen from Earth.

Persian astronomer Nasir al-Din al-Tusi (1201–1274) even spelled it out in his book Tadhkira: “The Milky Way, i.e. the Galaxy, is made up of a very large number of small, tightly clustered stars, which, on account of their concentration and smallness, seem to be cloudy patches. Because of this, it was likened to milk in color.”

Astronomers had long suspected the Milky Way was made up of stars, but it wasn’t proven until 1610, when Galileo Galilei turned his rudimentary telescope towards the heavens and resolved individual stars in the band across the sky. With the help of telescopes, astronomers realized that there were many, many more stars in the sky, and that all of the ones that we can see are a part of the Milky Way.

In 1755, Immanuel Kant proposed that the Milky Way was a large collection of stars held together by mutual gravity. Just like the Solar System, this collection would be rotating and flattened out as a disk, with the Solar System embedded within it. Astronomer William Herschel (discoverer of Uranus) tried to map its shape in 1785, but he didn’t realize that large portions of the galaxy are obscured by gas and dust, which hide its true shape.

It wasn’t until the 1920s, when Edwin Hubble provided conclusive evidence that the spiral nebulae in the sky were actually whole other galaxies, that the true shape of our galaxy was known. Thenceforth, astronomers came to understand that the Milky Way is a barred, spiral galaxy, and also came to appreciate how big the Universe truly is.

The Milky Way is appropriately named, being the vast and cloudy mass of stars, dust and gas it is. Like all galaxies, ours is believed to have formed from many smaller galaxies colliding and combining in the past. And in 3 to 4 billion years, it will collide with the Andromeda Galaxy to form an even larger mass of stars, gas and dust. Assuming humanity still exists by then (and survives the process) it should make for some interesting viewing!

We have written many interesting articles about the Milky Way here at Universe Today. Here’s 10 Interesting Facts About the Milky Way, How Big is the Milky Way?, Why is our Galaxy Called the Milky Way?, What is the Closest Galaxy to the Milky Way?, Where is the Earth in the Milky Way?, The Milky Way has Only Two Spiral Arms, and It’s Inevitable: Milky Way, Andromeda Galaxy Heading for Collision.

If you’d like more info on galaxies, check out Hubblesite’s News Releases on Galaxies, and here’s NASA’s Science Page on Galaxies.

We’ve also recorded an episode of Astronomy Cast about the Milky Way. Listen here, Episode 99: The Milky Way.

Sources:

Saturn Rides Bareback On The Galactic Dark Horse

Credit: Bob King
The bright dot is Saturn and it shines on the back of the Galactic Dark Horse, a collection of dark nebulae in the constellation Ophiuchus that resembles a prancing horse. The head is to the right with a wisp of a tail to the left. The photo, taken on June 20, 2017, has been turned 90° to the right, so the horse stands upright. Credit: Bob King

I didn’t notice it with the naked eye, but as soon as the time exposure ended and I looked at the camera’s back display, there it was — Saturn riding barebacked on the Galactic Dark Horse! The horse, more of a prancing pony, is a collection of dark nebulae in the southern sky beautifully placed for viewing on late June evenings. The Dark Horse is part of the Great Rift, a dark gap that splits the band of the Milky Way in half, starting at the Northern Cross and extending all the way down to the “Teapot” of Sagittarius in the south.

The Great Rift appears to unzip the summer Milky Way right down the middle. Saturn and the Dark Horse are seen at lower right. Credit: Bob King

While appearing to be little more than empty, starless space, in reality the Rift consists of enormous clouds of cosmic dust and gas in the plane of the galaxy called dark nebulae that blot out the light of more distant stars. If you could suck it all up with a monster vacuum cleaner and expose the billions of stars otherwise hidden, the Milky Way would cast obvious shadows — even suburban skywatchers would routinely see it.

Saturn dominates the scene at left center in this photo taken on June 20. To its right you can see the prancing pony standing on its tail with legs sticking out to the right. Several bright Milky Way star clouds are also visible including the Small Sagittarius Star Cloud (left) and the Large Sagittarius Star Cloud below and left of Saturn. Antares in Scorpius is at upper right. Can you find the firefly that flashed during the exposure? Credit: Bob King

Tiny dust particles spewed by older, evolved stars and exploding supernovas have been settling in the plane of the galaxy since its birth 13.2 billion years ago. While the dust is sparse, it adds up over the light years to form a thick, dark band silhouetted against the more distant stars. Gravity has been at work on the dust since the earliest days, compressing the denser clumps into new stars and star clusters. But much raw material remains. Within the curdles of dark nebulae, astronomers use dust-penetrating infrared and radio telescopes to watch new stars in the process of incubation.

Dense cores of dust within the Pipe Nebula are collapsing to form new stars. We can’t see them yet because of obscuring dust. The left end of the Pipe forms the long back leg and rump of the Dark Horse. The much smaller Snake Nebula (shaped like the letter “S”) is visible at top center. Credit and copyright: Yuri Beletsky

There are more obvious parts of the Rift to the naked eye but few conjure up as striking an image as the Dark Horse, located about one outstretched fist to the left of the Scorpius’ brightest star, Antares. Saturn sits astride the horse’s back or eastern side. While it’s fun to see the horse as a single figure, astronomers catalog the various body parts as individual dark nebulae with separate numbers and even names. The largest part of the horse, the hind leg, is nicknamed the Pipe Nebula and lies 600-700 light years away. The Pipe is further subdivided into B59, B72, B77 and B78, from a survey of dark nebulae by early 20th century American astronomer E.E. Barnard.

You’ll need dark skies and averted vision to spot the Dark Horse. Let Saturn and Antares be your guides. The nebula is highest in the sky around 12:30 a.m. in late June as shown in the map above. Latitude shown is 40° North. Created with Stellarium

While the dark horse shows up well in time-exposure photos, you’ll need dark, rural skies to view it with the naked eye. It’s only a couple fists high for those of us living in the northern U.S. and southern Canada, but considerably higher up from the southern states and points south. The figure is large but faint, about 10° long by 7° wide, and stands due south and highest in the sky around 12:30 a.m. in late June. Allow your eyes time to fully dark adapt beforehand. Try for the dark rump and hind leg first then work from there to fill in the rest of the horse.

If we could see the Milky Way galaxy edge-on from afar, it would look similar to NGC 891 in Andromeda. Both have long bands of interstellar dust along their equators that appear dark against the bright, starry backdrop. Credit: Hunter Wilson

Once I knew what to look for, I could fleetingly see the entire horse with its various protrusions as a subtle darkness against the brighter Milky Way. Averted vision, the technique of playing your eye around the subject rather than staring directly at it, helped make it happen. Wide-field binoculars will show it easily and in greater detail against a fabulously rich star field.

The best time to horse around under the Milky Way happens from now till the end of the month, when the bright Moon sends the critter into hiding.

Star-travel 5 Million Years Into The Milky Way’s Future

Credit: ESA/Gaia/DPAC


Two Million Stars on the Move

Gaze into Gaia’s crystal ball and you will see the future. This video shows the motion of 2,057,050 stars in the coming 5 million years from the Tycho-Gaia Astrometric Solution sample, part of the first data release of European Space Agency’s Gaia mission.

Gaia is a space observatory parked at the L2 Lagrange Point, a stable place in space a million miles behind Earth as viewed from the Sun. Its mission is astrometry: measuring the precise positions, distances and motion of 1 billion astronomical objects (primarily stars) to create a three-dimensional map of the Milky Way galaxy. Gaia’s radial velocity measurements — the motion of stars toward or away from us —  will provide astronomers with a stereoscopic and moving-parts picture of about 1% of the galaxy’s stars.

Think about how slowly stars move from the human perspective. Generations of people have lived and died since the days of ancient Greece and yet the constellations outlines and naked eye stars appear nearly identical today as they did then. Only a few stars — Arcturus, Sirius, Aldebaran — have moved enough for a sharp-eyed observer of yore to perceive their motion.

Given enough time, stars do change position, distorting the outlines of the their constellations. This view shows the sky looking north in 91,000 A.D. Both Lyra and the Big Dipper are clearly bent out of shape! Created with Stellarium

We know that stars are constantly on the move around the galactic center. The Sun and stars in its vicinity orbit the core at some half-million miles an hour, but nearly all are so far away that their apparent motion has barely moved the needle over the time span of civilization as we know it.

This video shows more than 2 million stars from the TGAS sample, with the addition of 24,320 bright stars from the Hipparcos Catalogue that weren’t included in Gaia’s first data release back in September 2016. The video starts from the positions of stars as measured by Gaia between 2014 and 2015, and shows how these positions are expected to evolve in the future, based on the stars’ proper motions or direction of travel across space.

This frame will help you get your footing as you watch the video. Orion (at right) and the Alpha Persei stellar association and Pleiades (at left) are shown. Credit: ESA/Gaia/DPAC

Watching the show

The frames in the video are separated by 750 years, and the overall sequence covers 5 million years. The dark stripes visible in the early frames reflect the way Gaia scans the sky (in strips) and the early, less complete database. The artifacts are gradually washed out as stars move across the sky.

Using the map above to get oriented, it’s fun to watch Orion change across the millennia. Betelgeuse departs the constellation heading north fairly quickly, but Orion’s Belt hangs in there for nearly 2 million years even if it soon develops sag! The Pleiades drift together to the left and off frame and then reappear at right.

Stars seem to move with a wide range of velocities in the video, with stars in the galactic plane moving quite slow and faster ones speeding across the view. This is a perspective effect: most of the stars we see in the plane are much farther from us, and thus seem to be moving slower than the nearby stars, which are visible across the entire sky.

Artist’s impression of The Milky Way Galaxy to provide context for the video. The Sun and solar system are located in the flat plane of the galaxy, so when we look into the Milky Way (either toward the center or toward the edge), the stars pile up across the light years to form a band in the sky. If we could rise above the disk and see the galaxy from the halo, we’d be able to look down (or up) and see the galaxy as a disk with winding spiral arms. Credit: NASA

Some of the stars that appear to zip in and out of view quickly are passing close to the Sun. But motion of those that trace arcs from one side of the sky to the other while passing close to the galactic poles (top and bottom of the frame) as they speed up and slow down, is spurious. These stars move with a constant velocity through space.

Stars located in the Milky Way’s halo, a roughly spherical structure centered on the galaxy’s spiral disk, also appear to move quite fast because they slice through the galactic plane with respect to the Sun. In reality, halo stars move very slowly with respect to the center of the galaxy.

Early in the the visualization, we see clouds of interstellar gas and dust that occupy vast spaces within the galaxy and block the view of more distant suns. That these dark clouds seem to disappear over time is also a spurious effect.

After a few million years, the plane of the Milky Way appears to have shifted towards the right as a consequence of the motion of the Sun with respect to that of nearby stars in the Milky Way. Regions that are depleted of stars in the video will not appear that way to future stargazers but will instead be replenished by stars not currently sampled by Gaia. So yes, there are a few things to keep in mind while watching these positional data converted into stellar motions, but the overall picture is an accurate one.

I find the video as mesmerizing as watching fireflies on a June night. The stars seem alive. Enjoy your ride in the time machine!

Watch Stars Orbit The Milky Way’s Supermassive Black Hole

Stars circle 'round the Milky Way central supermassive black hole. Credit: ESO
The Milky Way’s supermassive black hole, called Sagittarius A* (or Sgr A*), is arrowed in the image made of the innermost galactic center in X-ray light by NASA’s Chandra Observatory. To the left or east of Sgr A* is Sgr A East, a large cloud that may be the remnant of a supernova. Centered on Sgr A* is a spiral shaped group of gas streamers that might be falling onto the hole. Credit: NASA/CXC/MIT/Frederick K. Baganoff et al.

When your ordinary citizen learns there’s a supermassive black hole with a mass of 4 million suns sucking on its teeth in the center of the Milky Way galaxy, they might kindly ask exactly how astronomers know this. A perfectly legitimate question. You can tell them that the laws of physics guarantee their existence or that people have been thinking about black holes since 1783. That year, English clergyman John Michell proposed the idea of “dark stars” so massive and gravitationally powerful they could imprison their own light.

This time-lapse movie in infrared light shows how stars in the central light-year of the Milky Way have moved over a period of 14 years. The yellow mark at the image center represents the location of Sgr A*, site of an unseen supermassive black hole.
Credit: A. Eckart (U. Koeln) & R. Genzel (MPE-Garching), SHARP I, NTT, La Silla Obs., ESO

Michell wasn’t making wild assumptions but taking the idea of gravity to a logical conclusion. Of course, he had no way to prove his assertion. But we do. Astronomers  now routinely find bot stellar mass black holes — remnants of the collapse of gas-guzzling supergiant stars — and the supermassive variety in the cores of galaxies that result from multiple black hole mergers over grand intervals of time.

Some of the galactic variety contain hundreds of thousands to billions of solar masses, all of it so to speak “flushed down the toilet” and unavailable to fashion new planets and stars. Famed physicist Stephen Hawking has shown that black holes evaporate over time, returning their energy to the knowable universe from whence they came, though no evidence of the process has yet been found.

On September 14, 2013, astronomers caught the largest X-ray flare ever detected from Sgr A*, the supermassive black hole at the center of the Milky Way, using NASA’s Chandra X-ray Observatory.  This event was 400 times brighter than the usual X-ray output from the source and was possibly caused when Sgr A*’s strong gravity tore apart an asteroid in its neighborhood, heating the debris to X-ray-emitting temperatures before slurping down the remains.The inset shows the giant flare. Credit: NASA

So how do we really know a massive, dark object broods at the center of our sparkling Milky Way? Astronomers use radio, X-ray and infrared telescopes to peer into its starry heart and see gas clouds and stars whirling about the center at high rates of speed. Based on those speeds they can calculate the mass of what’s doing the pulling.

The Hubble Space Telescope took this photo of the  5000-light-year-long jet of radiation ejected from the active galaxy M87’s supermassive black hole, which is aboutt 1,000 times more massive than the Milky Way’s black hole. Although black holes are dark, matter whirling into their maws at high speed is heated to high temperature, creating a bright disk of material and jets of radiation. Credit: NASA/The Hubble Heritage Team (STScI/AURA)

In the case of the galaxy M87 located 53.5 million light years away in the Virgo Cluster, those speeds tell us that something with a mass of 3.6 billion suns is concentrated in a space smaller than our Solar System. Oh, and it emits no light! Nothing fits the evidence better than a black hole because nothing that massive can exist in so small a space without collapsing in upon itself to form a black hole. It’s just physics, something that Mr. Scott on Star Trek regularly reminded a panicky Captain Kirk.

So it is with the Milky Way, only our black hole amounts to a piddling 4 million-solar-mass light thief confined within a spherical volume of space some 27 million miles in diameter or just shy of Mercury’s perihelion distance from the Sun. This monster hole resides at the location of Sagittarius A* (pronounced A- star), a bright, compact radio source at galactic center about 26,000 light years away.


Video showing a 14-year-long time lapse of stars orbiting Sgr A*

The time-lapse movie, compiled over 14 years, shows the orbits of several dozen stars within the light year of space centered on Sgr A*. We can clearly see the star moving under the influence of a massive unseen body — the putative supermassive black hole. No observations of Sgr A* in visible light are possible because of multiple veils of interstellar dust that lie across our line of sight. They quench its light to the tune of 25 magnitudes.


Merging black holes (the process look oddly biological!). Credit: SXS

How do these things grow so big in the first place? There are a couple of ideas, but astronomers don’t honestly know for sure. Massive gas clouds around early in the galaxy’s history could have collapsed to form multiple supergiants that evolved into black holes which later then coalesced into one big hole. Or collisions among stars in massive, compact star clusters could have built up stellar giants that evolved into black holes. Later, the clusters sank to the center of the galaxy and merged into a single supermassive black hole.

Whichever you chose, merging of smaller holes may explain its origin.

On a clear spring morning before dawn, you can step out to face the constellation Sagittarius low in the southern sky. When you do, you’re also facing in the direction of our galaxy’s supermassive black hole. Although you cannot see it, does it not still exert a certain tug on your imagination?

Distance & Speed Of Sun’s Orbit Around Galactic Centre Measured

Artist’s conception of the Gaia telescope backdropped by a photograph of the Milky Way taken at the European Southern Observatory. Credit: ESA/ATG medialab; background: ESO/S. Brunier

In 2013, the European Space Agency deployed the long-awaited Gaia space observatory. As one of a handful of next-generation space observatories that will be going up before the end of the decade, this mission has spent the past few years cataloging over a billion astronomical objects. Using this data, astronomers and astrophysicists hope to create the largest and most precise 3D map of the Milky Way to date.

Though it is almost to the end of its mission, much of its earliest information is still bearing fruit. For example, using the mission’s initial data release, a team of astrophysicists from the University of Toronto managed to calculate the speed at which the Sun orbits the Milky Way. From this, they were able to obtain a precise distance estimate between our Sun and the center of the galaxy for the first time.

For some time, astronomers have been unsure as to exactly how far our Solar System is from the center of our galaxy. Much of this has to do with the fact that it is impossible to view it directly, due to a combination of factors (i.e. perspective, the size of our galaxy, and visibility barriers). As a result, since the year 2000, official estimates have varied between 7.2 and 8.8 kiloparsecs (~23,483 to 28,700 light years).

Astronomy Image Gallery
Infrared image from Spitzer Space Telescope, showing the stars at the center of the Milky Way Galaxy. Credit: NASA/JPL-Caltech/S. Stolovy (SSC/Caltech)

For the sake of their study, the team – which was led by Jason Hunt, a Dunlap Fellow at the Dunlap Institute for Astronomy & Astrophysics at the University of Toronto – combined Gaia’s initial release with data from the RAdial Velocity Experiment (RAVE). This survey, which was conducted between 2003 and 2013 by the Australian Astronomical Observatory (AAO), measured the positions, distances, radial velocities and spectra of 500,000 stars.

Over 200,000 of these stars were also observed by Gaia and information on them was included in its initial data release. As they explain in their study, which was published in the Journal of Astrophysical Letters in November 2016, they used this to examined the speeds at which these stars orbit the center of the galaxy (relative to the Sun), and in the process discovered that there was an apparent distribution in their relative velocities.

In short, our Sun moves around the center of the Milky Way at a speed of 240 km/s (149 mi/s), or 864,000 km/h (536,865 mph). Naturally, some of the more than 200,000 candidates were moving faster or slower. But for some, there was no apparent angular momentum, which they attributed to these stars being scattering onto “chaotic, halo-type orbits when they pass through the Galactic nucleus”.

As Hunt explained in Dunlap Institute press release:

“Stars with very close to zero angular momentum would have plunged towards the Galactic center where they would be strongly affected by the extreme gravitational forces present there. This would scatter them into chaotic orbits taking them far above the Galactic plane and away from the Solar neighbourhood… By measuring the velocity with which nearby stars rotate around our Galaxy with respect to the Sun, we can observe a lack of stars with a specific negative relative velocity. And because we know this dip corresponds to 0 km/sec, it tells us, in turn, how fast we are moving.”

Detection of an unusually bright X-Ray flare from Sagittarius A*, a supermassive black hole in the center of the Milky Way galaxy. Credit: NASA/CXC/Stanford/I. Zhuravleva et al.

The next step was to combine this information with proper motion calculations of Sagittarius A* – the supermassive black hole believed to be at the center of our galaxy. After correcting for its motion relative to background objects, they were able to effectively triangulate the Earth’s distance from the center of the galaxy. From this, they derived a refined distance of estimate of 7.6 to 8.2 kpc – which works out to about 24,788 to 26,745 light years.

This study builds upon previous work conducted by the study’s co-authors – Prof. Ray Calberg, the current chair of the Department of Astronomy & Astrophysics at the University of Toronto. Years ago, he and Prof. Kimmo Innanen of the Department of Physics and Astronomy at York University conducted a similar study using radial velocity measurement from 400 of the Milky Way’s stars.

But by incorporating data from the Gaia observatory, the UofT team was able to obtain a much more comprehensive data set and narrow the distance to galactic center by a significant amount. And this was based on only the initial data released by the Gaia mission. Looking ahead, Hunt anticipates that further data releases will allow his team and other astronomers to refine their calculations even more.

“Gaia’s final release in late 2017 should enable us to increase the precision of our measurement of the Sun’s velocity to within approximately one km/sec,” he said, “which in turn will significantly increase the accuracy of our measurement of our distance from the Galactic center.”

As more next-generation space telescopes and observatories are deployed, we can expect them to provide us with a wealth of new information about our Universe. And from this, we can expect that astronomers and astrophysicists will begin to shine the light on a number of unresolved cosmological questions.

Further Reading: University of Toronto, The Astrophysical Journal Letters

Stars at the Edge of our Galaxy May Have Been Stolen

Artist's impression of The Milky Way Galaxy. Based on current estimates and exoplanet data, it is believed that there could be tens of billions of habitable planets out there. Credit: NASA

Our Milky Way is a pretty vast and highly-populated space. All told, its stars number between 100 and 400 billion, with some estimates saying that it may have as many as 1 trillion. But just where did all these stars come from? Well, as it turns out, in addition to forming many of its own and merging with other galaxies, the Milky Way may have stolen some of its stars from other galaxies.

Such is the argument made by two astronomers from Harvard-Smithsonian Center for Astrophysics. According to their study, which has been accepted for publication in the The Astrophysical Journal, they claim that roughly half of the stars that orbit at the extreme outer edge of the Milky Way were actually stolen from the nearby Sagittarius dwarf galaxy.

At one time, the Sagittarius Dwarf Elliptical Galaxy was thought to be the closest galaxy to our own (a position now held by the Canis Major dwarf galaxy). As one of several dozen dwarf galaxies that surround the Milky Way, it has orbited our galaxy several times in the past. With each passing orbit, it becomes subject to our galaxy’s strong gravity, which has the effect of pulling it apart.

A model of the tidally shredded Sagittarius dwarf galaxy wrapping around a 3-D representation of the Milky Way disk. Credit: UCLA/D.R. Law

The long-term effects of this can be seen by looking to the farthest stars in our galaxy, which consist of the eleven stars that are at a distance of about 300,000 light-years from Earth (well beyond the Milky Way’s spiral disk). According the study produced by Marion Dierickx, a graduate student at Harvard University’s Department of Astronomy, half of these stars were taken from the Sagittarius dwarf galaxy in the past.

Professor Avi Loeb, the Frank B. Baird, Jr. Professor of Science at Harvard and Marion Dierickx PhD advisor, co-authored the study – titled, “Predicted Extension of the Sagittarius Stream to the Milky Way Virial Radius“. As he told Universe Today via email:

“We see evidence for streams of stars connected to the core of the galaxy, and indicating that this dwarf galaxy passed multiple times around the Milky Way center and was ripped apart by the tidal gravitational field of the Milky Way. We are all familiar with the tide in the ocean caused by the gravitational pull of the moon, but if the moon was a much more massive object – it would have pulled the oceans apart from the Earth and we would see a stream of vapor stretched away from the Earth.”

For the sake of their study, Dierickx and Loeb ran computer models to simulate the movements of the Sagittarius dwarf over the past 8 billion years. These simulations reproduced the streams of stars stretching away from the Sagittarius dwarf galaxy to the center of our galaxy. They also varied Sagittarius’ velocity and angle of approach to see if the resulting exchanges would match current observations.

Computer-generated image showing the disc of the Milky Way (red oval) and the Sagittarius dwarf galaxy (red dot). The yellow circles represent stars that have been ripped from the Sagittarius dwarf and flung far across space. Credit: Marion Dierickx / CfA

“We attempted to match the distance and velocity data for the core of the Sagitarrius galaxy, and then compared the resulting prediction for the position and velocity of the streams of stars,” said Loeb. “The results were very encouraging for some particular set of initial conditions regarding the start of the Sagittarius galaxy journey when the universe was roughly half its present age.”

What they found was that over time, the Sagittarius dwarf lost about one-third of its stars and nine-tenths of its dark matter to the Milky Way. The end result of this was the creation of three distinct streams of stars that reach one million light-years from galactic center to the very edge of the Milky Way’s halo. Interestingly enough, one of these streams has been predicted by simulations conducted by projects like the Sloan Digital Survey.

The simulations also showed that five of Sagittarius’ stars would end becoming part of the Milky Way. What’s more,  the positions and velocities of these stars coincided with five of the most distant stars in our galaxy. The other six do not appear to be from Sagittarius dwarf, and may be the result of gravitational interactions with another dwarf galaxy in the past.

“The dynamics of stars in the extended arms we predict (which is the largest Galactic structure on the sky ever predicted) can be used to measure the mass and structure of the Milky Way,” said Loeb. “The outer envelope of the Milky Way was never probed directly, because no other stream was known to extend that far.”

Computer model of the Milky Way, the Sagittarius dwarf galaxy, and the looping stream of material between the two. Credit: Tollerud, Purcell and Bullock/UC Irvine

Given the way the simulations match up with current observations, Dierickx is confident that more Sagittarius dwarf interlopers are out there, just waiting to be found. For instance, future instruments – like the Large Synoptic Survey Telescope (LSST), which is expected to begin full-survey operations by 2022 – may be able to detect the two remaining streams of stars which were predicted by the survey.

Given the time scales and the distances involved, it is rather difficult to probe our galaxy (and by extension, the Universe) to see exactly how it evolved over time. Pairing observational data with computer models, however, has been proven to test our best theories of how things came to be. In the future, thanks to improved instruments and more detailed surveys, we just might know for certain!

And sure to check out this animation of the computer simulation, which shows the effects on the Milky Way’s gravity on the Sagittarius dwarf galaxy’s stars and dark matter.

Further Reading: CfA

Confirmed: We Really are ‘Star Stuff’

An artists depiction of how the spectra of elements in the stars of the Milky Way reflect the importance these elements play in human life. Credit: Dana Berry/SkyWorks Digital Inc.; SDSS collaboration.

Scientist Carl Sagan said many times that “we are star stuff,” from the nitrogen in our DNA, the calcium in our teeth, and the iron in our blood.

It is well known that most of the essential elements of life are truly made in the stars. Called the “CHNOPS elements” – carbon, hydrogen, nitrogen, oxygen, phosphorous, and sulfur – these are the building blocks of all life on Earth. Astronomers have now measured of all of the CHNOPS elements in 150,000 stars across the Milky Way, the first time such a large number of stars have been analyzed for these elements.

“For the first time, we can now study the distribution of elements across our Galaxy,” says Sten Hasselquist of New Mexico State University. “The elements we measure include the atoms that make up 97% of the mass of the human body.”

Astronomers with the Sloan Digital Sky Survey made their observations with the APOGEE (Apache Point Observatory Galactic Evolution Experiment) spectrograph on the 2.5m Sloan Foundation Telescope at Apache Point Observatory in New Mexico. This instrument looks in the near-infrared to reveal signatures of different elements in the atmospheres of stars.

Quote from Carl Sage. Credit: Pinterest

While the observations were used to create a new catalog that is helping astronomers gain a new understanding of the history and structure of our galaxy, the findings also “demonstrates a clear human connection to the skies,” said the team.

While humans are 65% oxygen by mass, oxygen makes up less than 1% of the mass of all of elements in space. Stars are mostly hydrogen, but small amounts of heavier elements such as oxygen can be detected in the spectra of stars. With these new results, APOGEE has found more of these heavier elements in the inner part of the galaxy. Stars in the inner galaxy are also older, so this means more of the elements of life were synthesized earlier in the inner parts of the galaxy than in the outer parts.

So what does that mean for those of us out on the outer edges of one of the Milky Way’s spiral arms, about 25,000 light-years from the center of the galaxy?

“I think it’s hard to say what the specific implications are for when life could arise,” said team member Jon Holtzman, also from New Mexico State, in an email to Universe Today. “We measure typical abundance of CHNOPS elements at different locations, but it’s not so easy to determine at any given location the time history of the CHNOPS abundances, because it’s hard to measure ages of stars. On top of that, we don’t know what the minimum amount of CHNOPS would need to be for life to arise, especially since we don’t really know how that happens in any detail!”

Holtzman added it is likely that, if there is a minimum required abundance, that minimum was probably reached earlier in the inner parts of the Galaxy than where we are.

The team also said that while it’s fun to speculate how the composition of the inner Milky Way Galaxy might impact how life might arise, the SDSS scientists are much better at understanding the formation of stars in our Galaxy.

“These data will be useful to make progress on understanding Galactic evolution,” said team member Jon Bird of Vanderbilt University, “as more and more detailed simulations of the formation of our galaxy are being made, requiring more complex data for comparison.”

Sloan Foundation 2.5m Telescope at Apache Point Observatory. Credit: SDSS.

“It’s a great human interest story that we are now able to map the abundance of all of the major elements found in the human body across hundreds of thousands of stars in our Milky Way,” said Jennifer Johnson of The Ohio State University. “This allows us to place constraints on when and where in our galaxy life had the required elements to evolve, a sort ‘temporal Galactic habitable zone’”.

The catalog is available at the SDSS website, so take a look for yourself at the chemical abundances in our portion of the galaxy.

Source: SDSS

The Big Dipper in the Year 92,000

Stellar motions distort the future sky. Map: Bob King, Source: Stellarium
If we could transport Ptolemy, a famous astronomer who lived circa 90 – 168 A.D. in Alexandria, Egypt, he would have noticed the shift in position of Arcturus, Sirius and Aldebaran since his time. Everything else would appear virtually unchanged.

You go out and look at the stars year after year and never see any of them get up and walk away from their constellations. Take a time machine back to the days of Plato and Socrates and only careful viewing would reveal that just three of the sky’s naked eye stars had budged: Arcturus, Sirius and Aldebaran. And then only a little. Their motion was discovered by Edmund Halley in 1718 when he compared the stars’ positions then to their positions noted by the ancient Greek astronomers. In all three cases, the stars had moved “above a half a degree more Southerly at this time than the Antients reckoned them.”

NGC 4414 is a spiral galaxy that resembles our own Milky Way. I've drawn in the orbits of several stars. Both disk and halo stars orbit about the center but halo stars describe long elliptical orbits. When they plunge through the disk, if they happen to be relatively nearby as is Arcturus, they'll appear to move relatively quickly across the sky. Credit: NASA/ESA
NGC 4414 is a spiral galaxy that resembles our own Milky Way. I’ve drawn in the orbits of several stars. Both disk and halo stars orbit about the center, but halo stars describe long elliptical orbits that take them well beyond the disk. When a star plunges through the disk, if it happens to be relatively nearby as in the case of Arcturus, the star will appear to move relatively quickly across the sky. Both distance and the type of orbit a star has can affect how fast it moves from our perspective. Credit: NASA/ESA with orbits by the author

Stars are incredibly far away. I could throw light years around like I often do here, but the fact is, you can get a real feel for their distance by noting that during your lifetime, none will appear to move individually. The gems of the night and our sun alike revolve around the center of the galaxy. At our solar system’s distance from the center — 26,000 light years or about halfway from center to edge — it takes the sun about 225 million years to make one revolution around the Milky Way.

That’s a LONG time. The other stars we see on a September night take a similar length of time to orbit. Now divide the average lifetime of some 85 years into that number, and you’ll discover that an average star moves something like .00000038% of its orbit around the galactic center every generation. Phew, that ain’t much! No wonder most stars don’t budge in our lifetime.

This graphic, compiled using SkyMap software created by Chris Marriott, shows the motion of Arcturus over
This graphic, made using SkyMap software created by Chris Marriott, shows the motion of Arcturus over a span of 8,000 years.

Sirius, Aldebaran and Arcturus and several other telescopic stars are close enough that their motion across the sky becomes apparent within the span of recorded history. More powerful telescopes, which expand the scale of the sky, can see a great many stars amble within a human lifetime. Sadly, our eyes alone only work at low power!

Precession of Earth's axis maintains it usual 23.5 degree tilt, but this causes the axis to describe a circle in the sky like a wobbling top. Credit: Wikimedia Commons
Precession of Earth’s axis maintains its usual 23.5 degree tilt, but this causes the axis to describe a circle in the sky like a wobbling top. The photo is an animation that repeats 10 seconds, so hang in there. Credit: Wikimedia Commons

But we needn’t invest billions in building a time machine to zing to the future or past to see how the constellation outlines become distorted by the individual motions of the stars that compose them. We already have one! Just fire up a free sky charting software program like Stellarium and advance the clock. Like most such programs, it defaults to the present, but let’s look ahead. Far ahead.

If we advance 90,000 years into the future, many of the constellations would be unrecognizable. Not only that, but more locally, the precession of Earth’s axis causes the polestar to shift. In 2016, Polaris in the Little Dipper stands at the northernmost point in the sky, but in 90,000 years the brilliant star Vega will occupy the spot. Tugs from the sun and moon on Earth’s equatorial bulge cause its axis to gyrate in a circle over a period of about 26,000 years. Wherever the axis points defines the polestar.

I advanced Stellarium far enough into the future to see how radically the Big Dipper changes shape over time. Notice too that Vega will be the polestar in that distant era. Map: Bob King, Source: Stellarium

Take a look at the Big Dipper. Wow! It’s totally bent out of shape yet still recognizable. The Pointer Stars no longer quite point to Polaris, but with some fudging we might make it work. Vega stands near the pole, and being much closer to us than the rest of Lyra’s stars, has moved considerably farther north, stretching the outline of the constellation as if taffy.

Now let's head backwards in time 92,000 years to 90,000 B.C. The Dipper then was fairly unrecognizable, with both Vega and Arcturus near the pole. Map: Bob King , Source: Stellarium
Now let’s head backwards in time 92,000 years to 90,000 B.C. The Dipper then was fairly unrecognizable, with both Vega and Arcturus near the pole. Map: Bob King , Source: Stellarium

Time goes on. We look up at the night sky in the present moment, but so much came before us and much will come after. Constellations were unrecognizable in the past and will be again in the future. In a fascinating discussion with Michael Kauper of the Minnesota Astronomical Society at a recent star party, he described the amount of space in and between galaxies as so enormous that “we’re almost not here” in comparison. I would add that time is so vast we’re likewise almost not present. Make the most of the moment.

Best Picture Yet Of Milky Way’s Formation 13.5 Billion Years Ago

The Milky Way is like NGC 4594 (pictured), a disc shaped spiral galaxy with around 200 billion stars. The three main features are the central bulge, the disk, and the halo. Credit: ESO

Maybe we take our beloved Milky Way galaxy for granted. As far as humanity is concerned, it’s always been here. But how did it form? What is its history?

Our Milky Way galaxy has three recognized stellar components. They are the central bulge, the disk , and the halo. How these three were formed and how they evolved are prominent, fundamental questions in astronomy. Now, a team of researchers have used the unique property of a certain type of star to help answer these fundamental questions.

The type of star in question is called the blue horizontal-branch star (BHB star), and it produces different colors depending on its age. It’s the only type of star to do that. The researchers, from the University of Notre Dame, used this property of BHB’s to create a detailed chronographic (time) map of the Milky Way’s formation.

This map has confirmed what theories and models have predicted for some time: the Milky Way galaxy formed through mergers and accretions of small haloes of gas and dust. Furthermore, the oldest stars in our galaxy are at the center, and younger stars and galaxies joined the Milky Way over billions of years, drawn in by the galaxy’s growing gravitational pull.

The team who produced this study includes astrophysicist Daniela Carollo, research assistant professor in the Department of Physics at the University of Notre Dame, and Timothy Beers, Notre Dame Chair of Astrophysics. Research assistant professor Vinicius Placco, and other colleagues rounded out the team.

“We haven’t previously known much about the age of the most ancient component of the Milky Way, which is the Halo System,” Carollo said. “But now we have demonstrated conclusively for the first time that ancient stars are in the center of the galaxy and the younger stars are found at longer distances. This is another piece of information that we can use to understand the assembly process of the galaxy, and how galaxies in general formed.”

This dazzling infrared image from NASA's Spitzer Space Telescope shows hundreds of thousands of stars crowded into the swirling core of our spiral Milky Way galaxy. Credit: NASA/JPL-Caltech
This dazzling infrared image from NASA’s Spitzer Space Telescope shows hundreds of thousands of stars crowded into the swirling core of our spiral Milky Way galaxy. Credit: NASA/JPL-Caltech

The Sloan Digital Sky Survey (SDSS) played a key role in these findings. The team used data from the SDSS to identify over 130,000 BHB’s. Since these stars literally “show their age”, mapping them throughout the Milky Way produced a chronographic map which clearly shows the oldest stars near the center of the galaxy, and youngest stars further away.

“The colors, when the stars are at that stage of their evolution, are directly related to the amount of time that star has been alive, so we can estimate the age,” Beers said. “Once you have a map, then you can determine which stars came in first and the ages of those portions of the galaxy. We can now actually visualize how our galaxy was built up and inspect the stellar debris from some of the other small galaxies being destroyed by their interaction with ours during its assembly.”

Astronomers infer, from various data-driven approaches, that different structural parts of the galaxy have different ages. They’ve assigned ages to different parts of the galaxy, like the bulge. That makes sense, since everything can’t be the same age. Not in a galaxy that’s this old. But this map makes it even clearer.

As the authors say in their paper, “What has been missing, until only recently, is the ability to assign ages to individual stellar populations, so that the full chemo-dynamical history of the Milky Way can be assessed.”

This new map, with over 130,000 stars as data points, is a pretty important step in understanding the evolution of the Milky Way. It takes something that was based more on models and theory, however sound they were, and reinforces it with more constrained data.

Update: The chronographic map, as well as a .gif, can be viewed here.