Alien Star Clusters Are Invading the Milky Way

Globular Cluster
A Hubble Space Telescope image of the typical globular cluster Messier 80, an object made up of hundreds of thousands of stars and located in the direction of the constellation of Scorpius. The Milky Way galaxy has an estimated 160 globular clusters of which one quarter are thought to be ‘alien’. Image: NASA / The Hubble Heritage Team / STScI / AURA. Click for hi-resolution version.

[/caption]

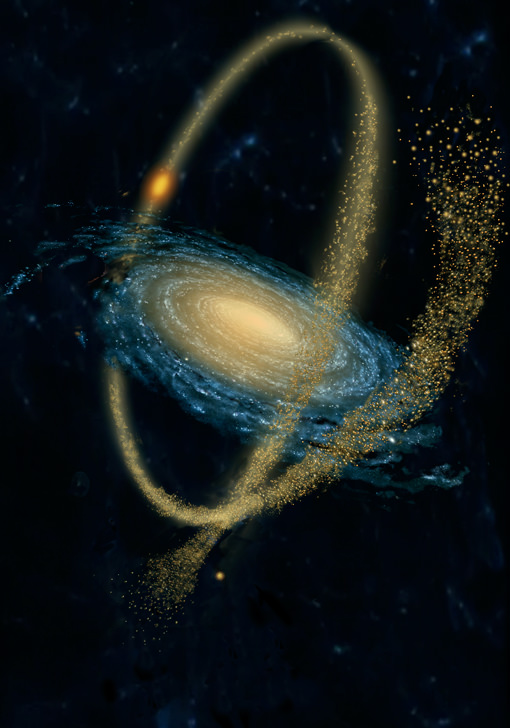
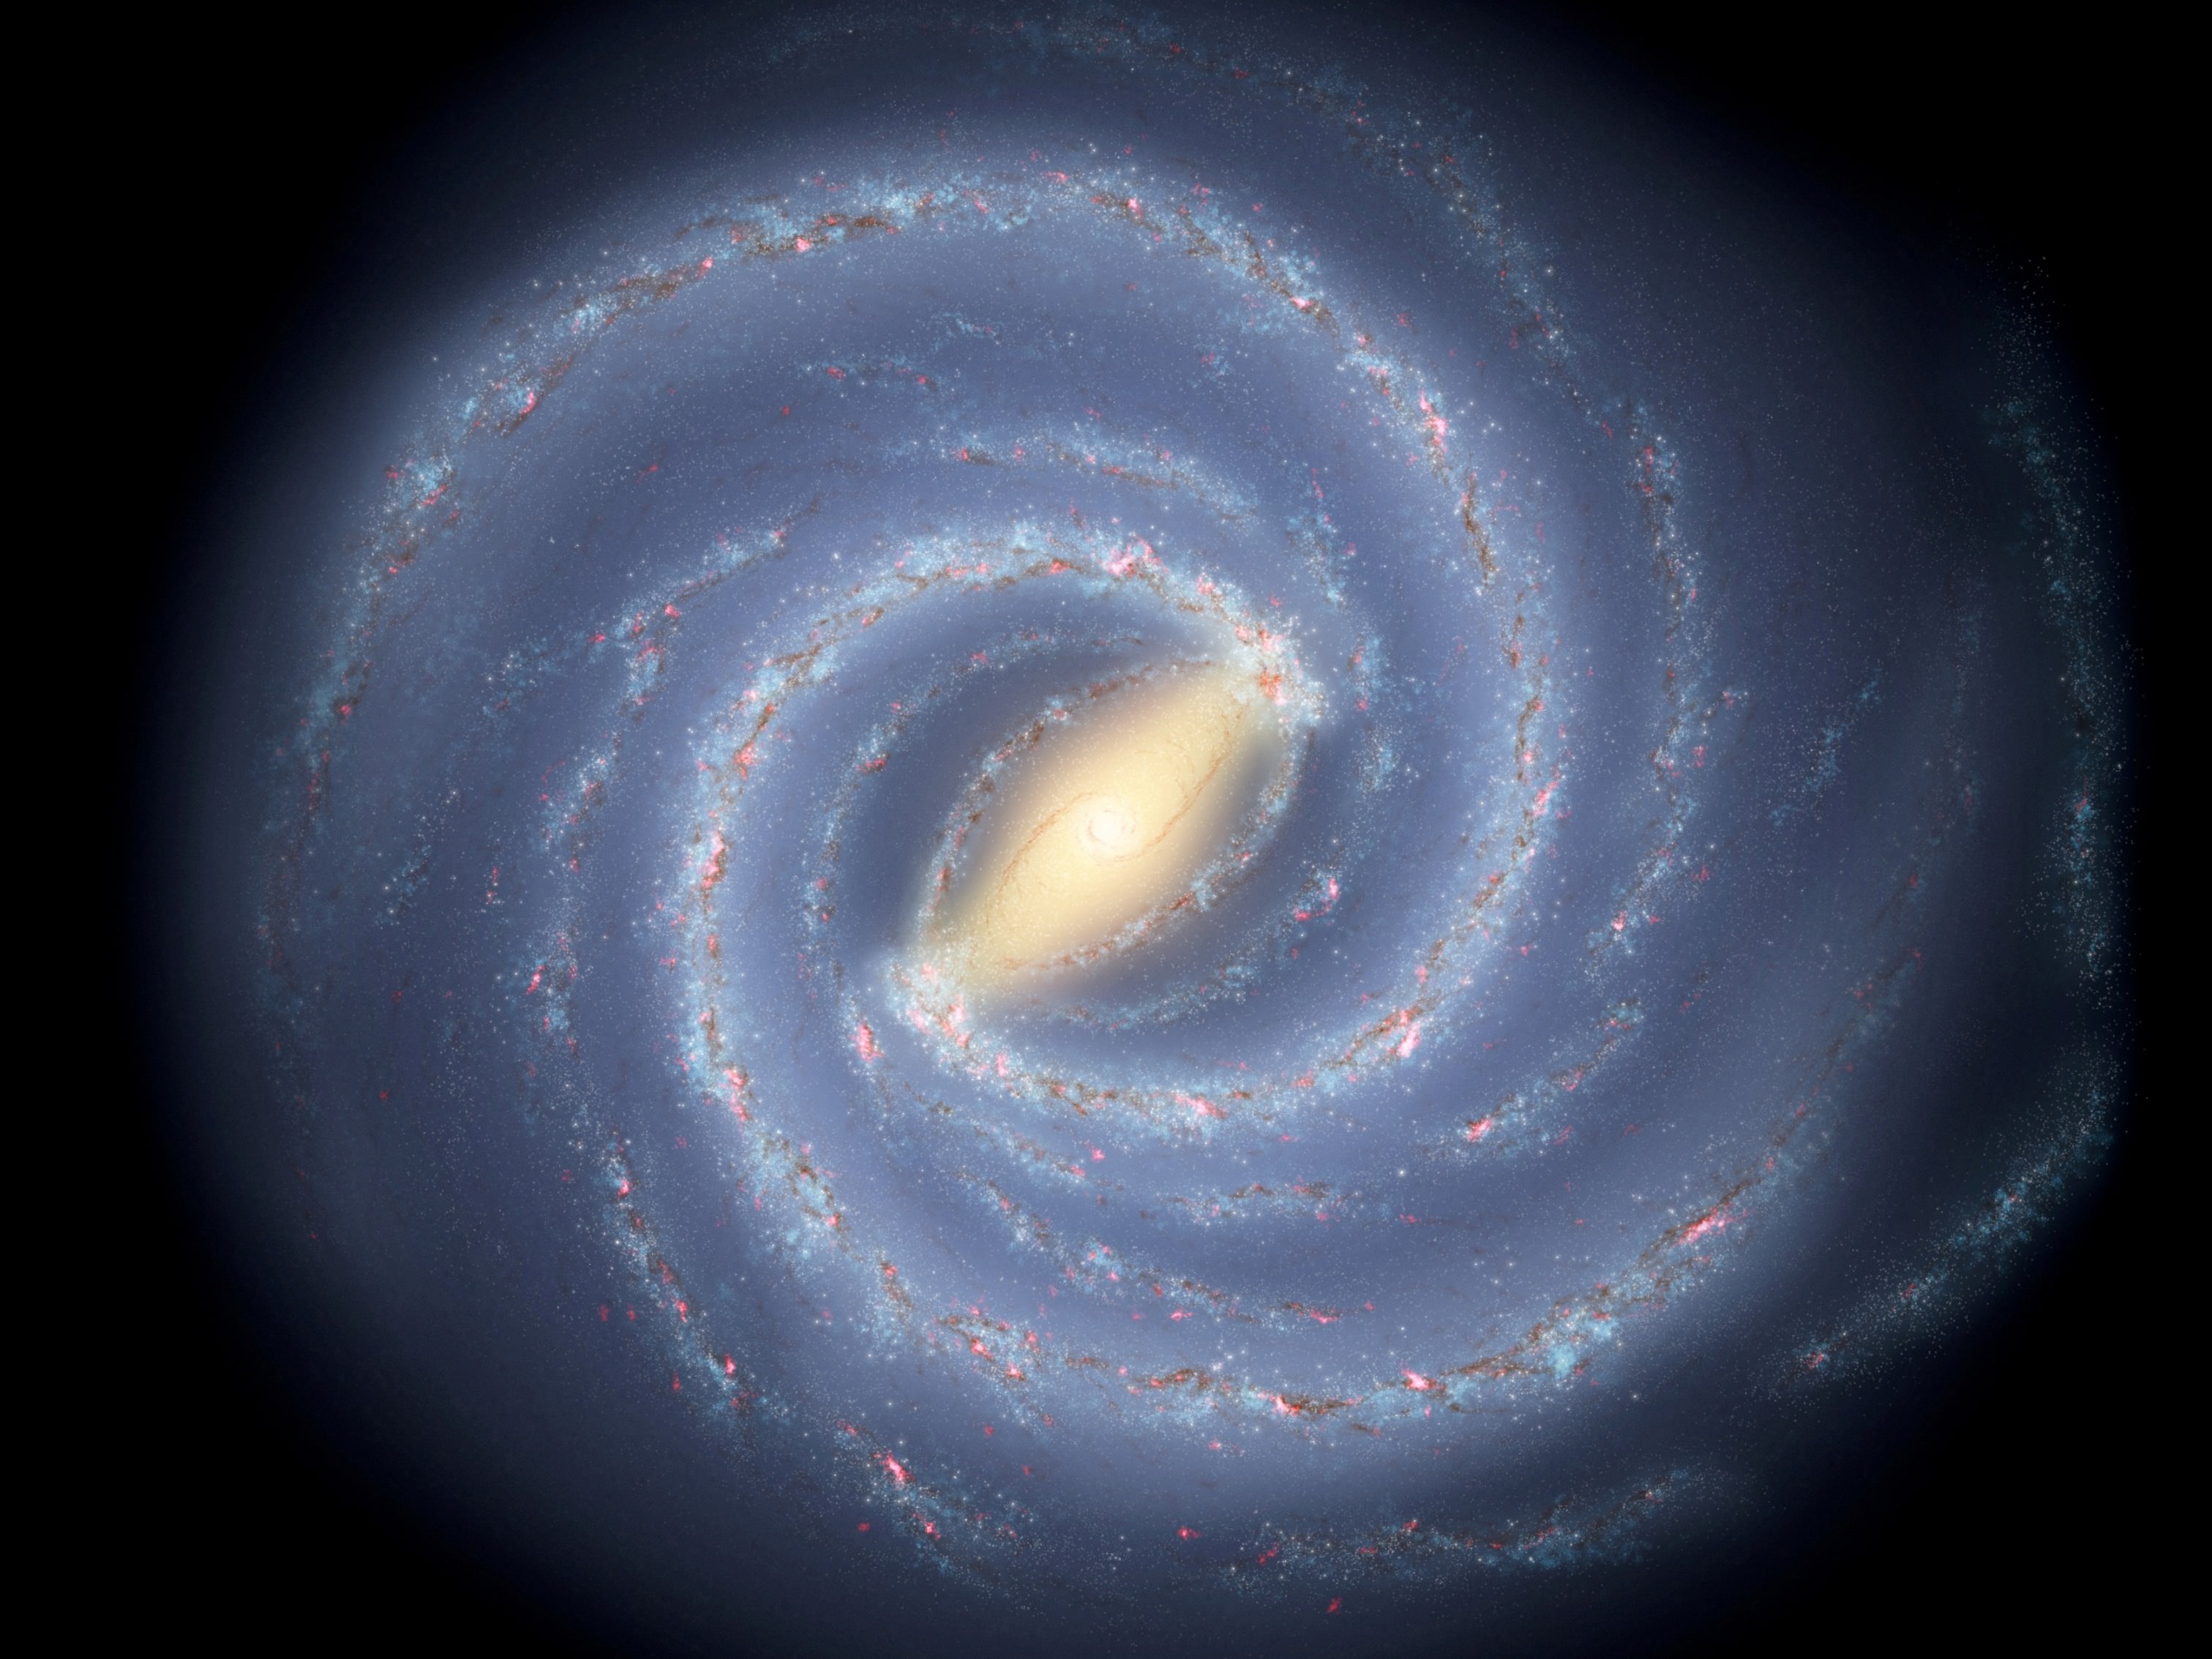
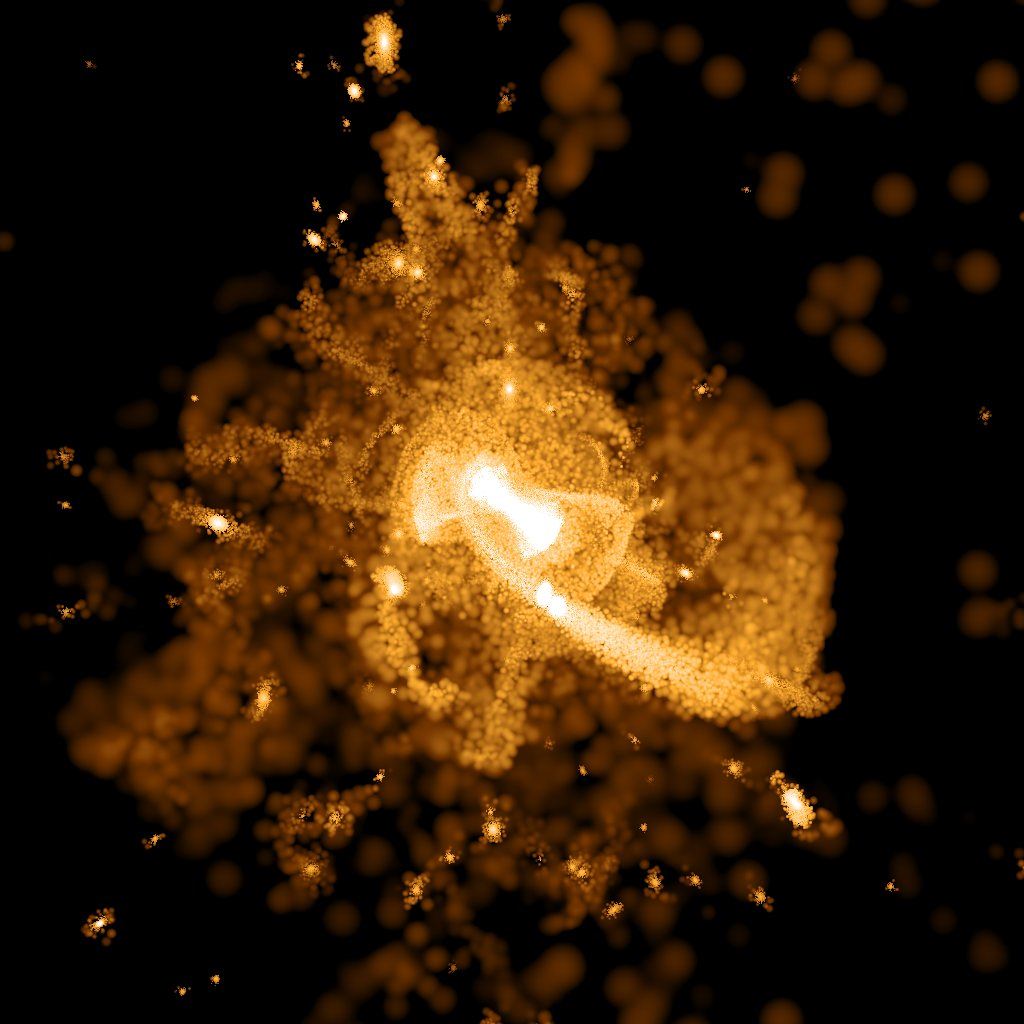
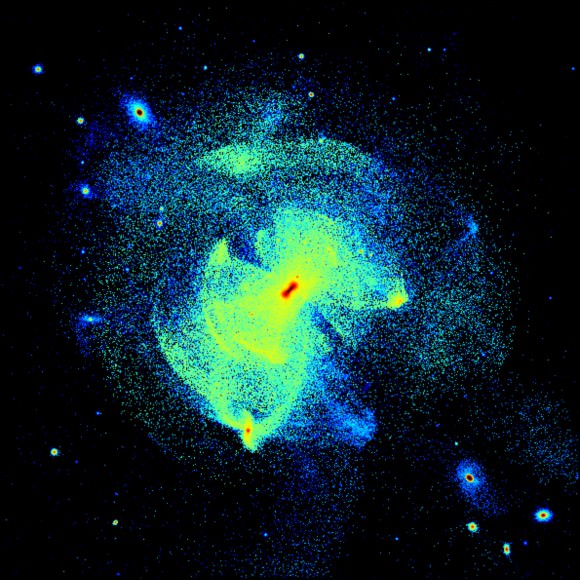
We’re being invaded! About one-fourth of the star clusters in our galaxy are actually invaders from other galaxies, according to a new paper. Research from a team of scientists from Swinburne University of Technology in Australia shows that that many of our galaxy’s globular star clusters are actually foreigners – having been born elsewhere and then migrated to our Milky Way. “It turns out that many of the stars and globular star clusters we see when we look into the night sky are not natives, but aliens from other galaxies,” said Duncan Forbes. “They have made their way into our galaxy over the last few billion years.”

Previously astronomers had suspected that some globular star clusters, which each contain between 10000 and several million stars were foreign to our galaxy, but it was difficult to positively identify which ones.

Using Hubble Space Telescope data, Forbes, along with his Canadian colleague Professor Terry Bridges, examined globular star clusters within the Milky Way galaxy.

They then compiled the largest ever high-quality database to record the age and chemical properties of each of these clusters.

“Using this database we were able to identify key signatures in many of the globular star clusters that gave us tell-tale clues as to their external origin,” Forbes said.

“We determined that these foreign-born globular star clusters actually make up about one quarter of our Milky Way globular star cluster system. That implies tens of millions of accreted stars – those that have joined and grown our galaxy – from globular star clusters alone.”

The researchers’ work also suggests that the Milky Way may have swallowed up more dwarf galaxies than was previously thought.

“We found that many of the foreign clusters originally existed within dwarf galaxies – that is ‘mini’ galaxies of up to 100 million stars that sit within our larger Milky Way,” said Forbes. “Our work shows that there are more of these accreted dwarf galaxies in our Milky Way than was thought. Astronomers had been able to confirm the existence of two accreted dwarf galaxies in our Milky Way – but our research suggests that there might be as many as six yet to be discovered.”

“Although the dwarf galaxies are broken-up and their stars assimilated into the Milky Way, the globular star clusters of the dwarf galaxy remain intact and survive the accretion process,” Forbes continued. “This will have to be explored further, but it is a very exciting prospect that will help us to better understand the history of our own galaxy.”

Read the team’s paper.
Source: Royal Astronomical Society

Astronomy Without A Telescope – Don’t Make a Meal of It

You should always put out the old dinner set when you have astronomers around. It all starts innocently enough with imagine this wineglass is the Earth rotating on its axis… But then someone decides that large plate is just right to show the orientation of an orbital plane and more wine glasses are brought to bear to test a solution to the three body problem and…

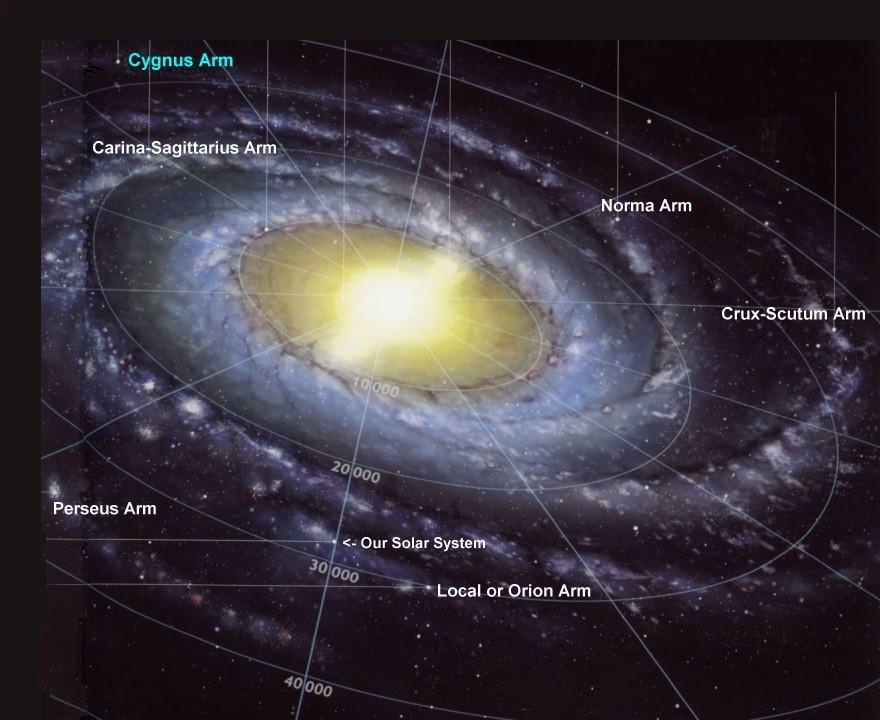
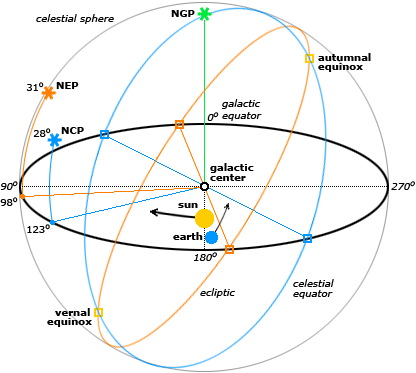
My favorite dinner set demonstration is to use the whole table to represent the galactic plane – ideally with an upturned wide rimmed soup bowl in the middle to mimic the galactic hub. Then you get a plate to represent the solar system’s orbital plane and hold it roughly facing the galactic hub, but at a 63 degree angle from the horizontal. We know the equatorial plane of the Milky Way is tilted 63 degrees from the ecliptic – or vice versa since here we are arbitrarily making the galactic plane (table) the horizontal. This means galactic north is up towards the ceiling – and incidentally a line drawn north up from the galaxy’s centre (i.e. the galactic axis) passes fairly close to Arcturus.

Now for the Earth. Wine glasses make an excellent Earth model since the stem can represent the Earth’s axis of rotation. The glass is at least a bit round and you can see through it for a view of what someone would see from the surface of that glass.

Looking down on the solar system (plate) from its north, which is orientated away from the galactic hub (table), it actually rotates anti-clockwise. So if you hold the glass at the top of the plate – that’s Earth at about September, then move it to the left for December, down to the bottom for March, right side for June and back to September. 

So, holding your plate at 63 degrees to the table, now hold the wine glass tilted at 23.5 degrees to the plate. Assuming you left your protractor at home – this will mean the wine glass stem is now almost parallel to the table – since 63 + 23.5 is close to 90 degrees. In other words, the Earth’s axis is almost perpendicular to the galactic axis.

The range of different orientations available to you. The axis of Earth's rotation (represented by the 'celestial equator') is almost perpendicular to the orbital plane of the galaxy.

You should really imagine the plate being embedded within the table, since you will always see some part of the Milky Way at night throughout the year. But, in any case, the wine glass gives a good demonstration of why we southerners get such a splendid view of the galactic hub in Sagittarius. It’s hidden in the daytime around March – but come September about 7pm you get the Milky Way running almost north-south across the sky with Sagittarius almost directly overhead. Arcturus is visible just above the western horizon, being about where the galaxy’s northern axis points (that is, the ceiling above the middle of the table).

And if you look to the north you can see Vega just above the horizon – which is more or less the direction the solar system (plate) is heading in its clockwise orbit around the galaxy (table).

Now, what’s really interesting is if I add the Moon in by just, oh… Er, sorry – that wasn’t new was it?

Seven-Year WMAP Results: No, They’re NOT Anomalies

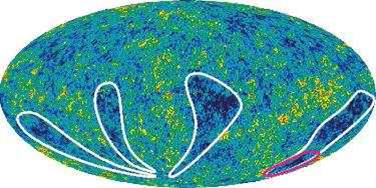
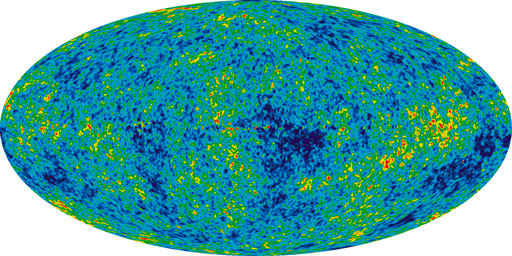
CMB cool fingers, cold spots I and II (red; credit: NASA/WMAP science team)

Since the day the first Wilkinson Microwave Anisotropy Probe (WMAP) data were released, in 2003, all manner of cosmic microwave background (CMB) anomalies have been reported; there’s been the cold spot that might be a window into a parallel universe, the “Axis of Evil”, pawprints of local interstellar neutral hydrogen, and much, much more.

But do the WMAP data really, truly, absolutely contain evidence of anomalies, things that just do not fit within the six-parameters-and-a-model the WMAP team recently reported?

In a word, no.

Seven Year Microwave Sky (Credit: NASA/WMAP Science Team)

Every second year since 2003 the WMAP science team has published a set of papers on their analyses of the cumulative data, and their findings (with the mission due to end later this year, their next set will, sadly, be their last). With time and experience – not to mention inputs from the thousands of other researchers who have picked over the data – the team has not only amassed a lot more data, but has also come to understand how WMAP operates far better. As a consequence, not only are the published results – such as limits on the nature of dark energy, and the number of different kinds of neutrinos – more stringent and robust, but the team has also become very au fait with the various anomalies reported.

For the first time, the team has examined these anomalies, in detail, and has concluded that the answer to the question, in their words, “are there potential deviations from ?CDM within the context of the allowed parameter ranges of the existing WMAP observations?” is “no”.

The reported anomalies the team examined are many – two prominent cold spots, strength of the quadrupole, lack of large angular scale CMB power, alignment of the quadrupole and octupole components, hemispherical or dipole power asymmetry, to name but a handful – but the reasons for the apparent anomalies are few.

“Human eyes and brains are excellent at detecting visual patterns, but poor at assessing probabilities. Features seen in the WMAP maps, such as the large Cold Spot I near the Galactic center region, can stand out as unusual. However, the likelihood of such features can not be discerned by visual inspection of our particular realization of the universe,” they write, and “Monte Carlo simulations are an invaluable way to determine the expected deviations within the ?CDM model. Claims of anomalies without Monte Carlo simulations are necessarily weak claims”.

Stephen Hawking’s initials in the CMB (Credit: NASA/WMAP Science Team)

An amusing example: Stephen Hawking’s initials (“SH”) can be clearly seen in the WMAP sky map. “The “S” and “H” are in roughly the same font size and style, and both letters are aligned neatly along a line of fixed Galactic latitude,” the team says; “A calculation would show that the probability of this particular occurrence is vanishingly small. Yet, there is no case to made for a non-standard cosmology despite this extraordinarily low probability event,” they dryly note.

Many of the reports of WMAP CMB anomalies would likely make for good teaching material, as they illustrate well the many traps that you can so easily fall into when doing after-the-fact (a posteriori) statistical analyses. Or, as the team puts it in regard to the Stephen Hawking initials: “It is clear that the combined selection of looking for initials, these particular initials, and their alignment and location are all a posteriori choices. For a rich data set, as is the case with WMAP, there are a lot of data and a lot of ways of analyzing the data.”

And what happens when you have a lot of data? Low probability events are guaranteed to occur! “For example, it is not unexpected to find a 2? feature when analyzing a rich data set in a number of different ways. However, to assess whether a particular 2? feature is interesting, one is often tempted to narrow in on it to isolate its behavior. That process involves a posteriori choices that amplify the apparent significance of the feature.”

So, does the team conclude that all this anomaly hunting is a waste of effort? Absolutely not! I’ll quote from the team’s own conclusion: “The search for oddities in the data is essential for testing the model. The success of the model makes these searches even more important. A detection of any highly significant a posteriori feature could become a serious challenge for the model. The less significant features discussed in this paper provided the motivation for considering alternative models and developing new analysis of WMAP (and soon Planck) data. The oddities have triggered proposed new observations that can further test the models. It is often difficult to assess the statistical claims. It may well be that an oddity could be found that motivates a new theory, which then could be tested as a hypothesis against ?CDM. The data support these comparisons. Of course, other cosmological measurements must also play a role in testing new hypotheses. No CMB anomaly reported to date has caused the scientific community to adopt a new standard model of cosmology, but claimed anomalies have been used to provoke thought and to search for improved theories.”

Primary source: Seven-Year Wilkinson Microwave Anisotropy Probe (WMAP) Observations: Are There Cosmic Microwave Background Anomalies? (arXiv:1001.4758). The five other Seven-Year WMAP papers are: Seven-Year Wilkinson Microwave Anisotropy Probe (WMAP) Observations: Cosmological Interpretation (arXiv:1001.4538), Seven-Year Wilkinson Microwave Anisotropy Probe (WMAP) Observations: Planets and Celestial Calibration Sources (arXiv:1001.4731), Seven-Year Wilkinson Microwave Anisotropy Probe (WMAP) Observations: Sky Maps, Systematic Errors, and Basic Results (arXiv:1001.4744), Seven-Year Wilkinson Microwave Anisotropy Probe (WMAP) Observations: Power Spectra and WMAP-Derived Parameters (arXiv:1001.4635), and Seven-Year Wilkinson Microwave Anisotropy Probe (WMAP) Observations: Galactic Foreground Emission (arXiv:1001.4555). Also check out the official WMAP website.

If the Earth is Rare, We May Not Hear from ET

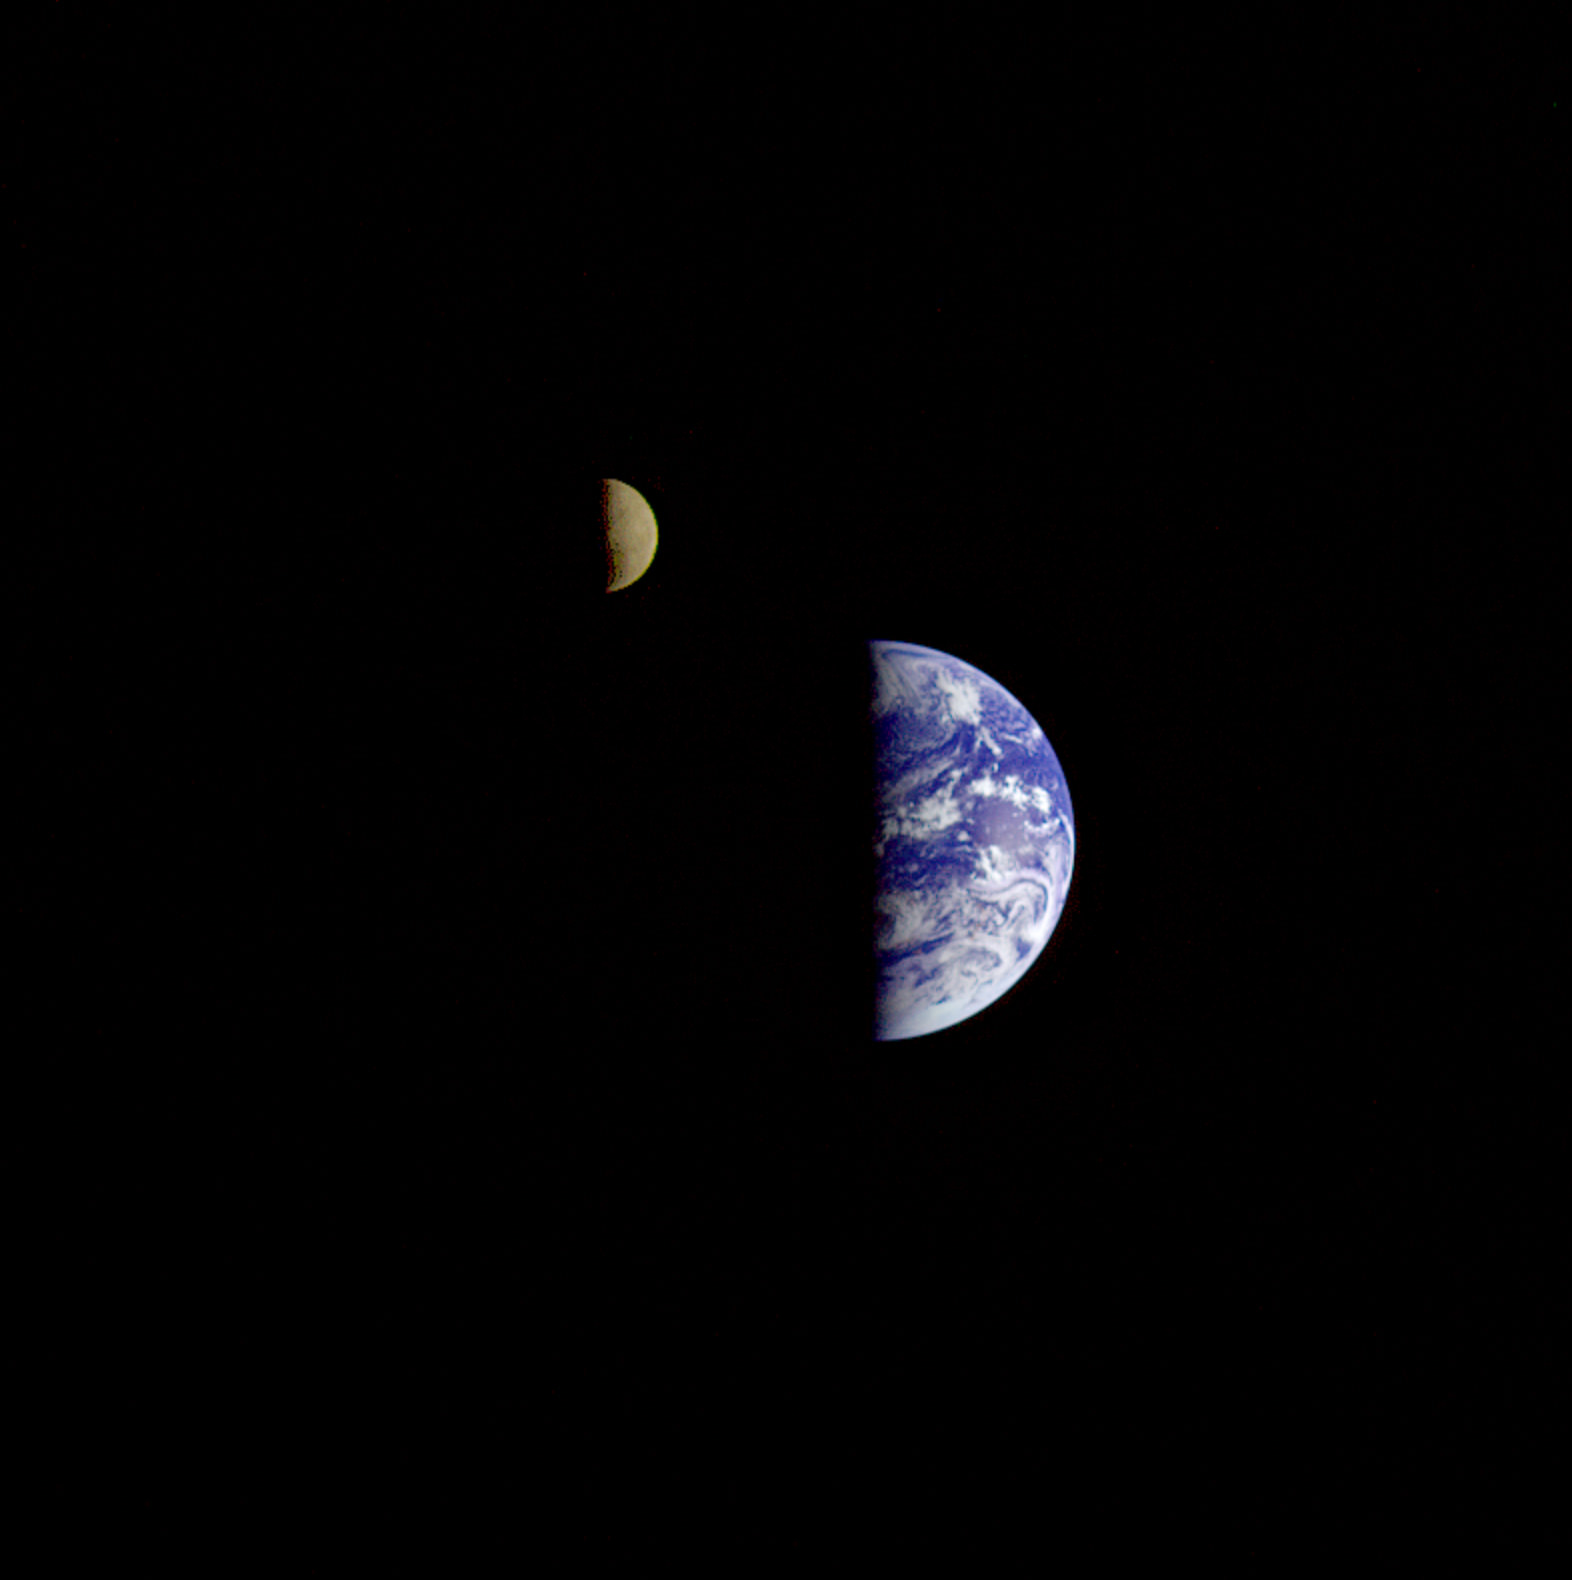
Earth - Moon System
Image Credit: NASA

[/caption]
If civilization-forming intelligent life is rare in our Milky Way galaxy, chances are we won’t hear from ET before the Sun goes red giant, in about five billion years’ time; however, if we do hear from ET before then, we’ll have lots of nice chats before the Earth is sterilized.

That’s the conclusion from a recent study of Ward and Brownlee’s Rare Earth hypothesis by Duncan Forgan and Ken Rice, in which they made a toy galaxy, simulating the real one we live in, and ran it 30 times. In their toy galaxy, intelligent life formed on Earth-like planets only, just as it does in the Rare Earth hypothesis.

While the Forgan and Rice simulations are still limited and somewhat unrealistic, they give a better handle on SETI’s chances for success than either the Drake equation or Fermi’s “Where are they?”

“The Drake equation itself does suffer from some key weaknesses: it relies strongly on mean estimations of variables such as the star formation rate; it is unable to incorporate the effects of the physico-chemical history of the galaxy, or the time-dependence of its terms,” Forgan says, “Indeed, it is criticized for its polarizing effect on “contact optimists” and “contact pessimists”, who ascribe very different values to the parameters, and return values of the number of galactic civilizations who can communicate with Earth between a hundred-thousandth and a million (!)”

Building on the work of Vukotic and Cirkovic, Forgan developed a Monte Carlo-based simulation of our galaxy; as inputs, he used the best estimates of actual astrophysical parameters such as the star formation rate, initial mass function, a star’s time spent on the main sequence, likelihood of death from the skies, etc. For several key inputs however, “the model goes beyond relatively well-constrained parameters, and becomes hypothesis,” Forgan explains, “In essence, the method generates a Galaxy of a billion stars, each with their own stellar properties (mass, luminosity, location in the Galaxy, etc.) randomly selected from observed statistical distributions. Planetary systems are then generated for these stars in a similar manner, and life is allowed to evolve in these planets according to some hypothesis of origin. The end result is a mock Galaxy which is statistically representative of the Milky Way. To quantify random sampling errors, this process is repeated many times: this allows an estimation of the sample mean and sample standard deviation of the output variables obtained.”

Forgan simulated the Rare Earth hypothesis by allowing animal life – the only kind of life from which intelligent civilizations can arise – to form only if homeworld’s mass is between a half and two Earths, if homesun’s mass is between a half and 1.5 times our Sun’s, homeworld has at least one moon (for tides and axial stability), and if homesun has at least one planet of mass at least ten times that of Earth, in an outer orbit (to cut down on death from the skies due to asteroids and comets).

The good news for SETI is that a galaxy like ours should host hundreds of intelligent civilizations (though, somewhat surprisingly, there is no galactic goldilocks zone); the bad news is that during the time such a civilization could communicate with an ET – between when it becomes technologically advanced enough and when it is wiped out by homesun going red giant – there are, in most simulations, no other such civilizations (or if there are, they are too far away) … we, or ET, would be alone.

But it’s not all bad news; if we are not alone, then once contact is established, we will have many phone calls with ET.

To be sure, this is but a work-in-progress. “Numerical modeling of this type is generally a shadow of the entity it attempts to model, in this case the Milky Way and its constituent stars, planets and other objects,” Forgan and Rice say; several improvements are already being worked on.

Sources: “A numerical testbed for hypotheses of extraterrestrial life and intelligence” (Forgan D., 2009, International Journal of Astrobiology, 8, 121), and “Numerical Testing of The Rare Earth Hypothesis using Monte Carlo Realisation Techniques” (arXiv:1001:1680); this too will be published in IJA, likely in April.

Intergalactic Connection is Older, Longer than Thought

Our galaxy has a streamer, though it’s not like the ones you had on your bike as a kid: this streamer is a flow of largely hydrogen gas that originates in the Large and Small Magellanic Clouds, two of our closest galactic neighbors. New observations of the stream have helped to revise its age and extent, and show it to be longer and much older than previous estimates.

The Magellanic Stream, which was discovered over 30 years ago, flows from the two galaxies closest to the Milky Way, the Large and Small Magellanic Clouds. These clouds, which are actually two irregular dwarf galaxies, are 150,000 to 200,000 light-years away, and are visible in the southern hemisphere.

The stream connects up with the Milky Way about 70,000 light years from the Solar System, in the constellation of the Southern Cross.

Using the Green Bank Telescope (GBT), a team of astronomers took over 100 hours of observations of the streamer. These observations were combined with those from other radio telescopes, including the Aricebo telescope in Puerto Rico, to further constrain both its extent and age.

Their observations were presented at the American Astronomical Society’s meeting in Washington D.C., and a paper has been submitted to the Astrophysical Journal. The team included David Nidever and Steven Majewski of the Department of Astronomy at the University of Virginia, Butler Burton of the Leiden Observatory and the National Radio Astronomy Observatory and Lou Nigra of the University of Wisconsin.

Previous observations of the stream showed it to have gaps between the Magellanic Clouds and where it enters the Milky Way, but these revised observations show it to be one continuous stream between the three galaxies. The stream is also at least forty percent longer that previously estimated.

The Magellanic Stream was also determined by the astronomers to be much older than had been estimated before: up from 1.75 billion years old to 2.5 billion years old. Just how does this long-lived intergalactic trail of hydrogen crumbs start off in the Magellanic Clouds?

“The new age of the stream puts its beginning at about the time when the two Magellanic Clouds may have passed close to each other, triggering massive bursts of star formation. The strong stellar winds and supernova explosions from that burst of star formation could have blown out the gas and started it flowing toward the Milky Way,” said David Nidever in a NRAO press release.

By getting a better picture of how the gas flows from the Magellanic Clouds into the Milky Way, astronomers have been able to determine with better accuracy just how far away the two galaxies are, as well as their  interactions with the tidal forces of the Milky Way.

This team has collaborated before on the exploration of the Magellanic Stream and its origins. You can read about their previous findings on Arxiv right here, which were also published in the Astrophysical Journal.

Source: NRAO press release

Stellar Escapees Await Detection

Stars wandering outside the galactic plane of the Milky Way could number in the billions. Image Credit: APOD

[/caption]

The structure of the Universe and the formation of stars from concentrated dust leads them to be clumped into galaxies of all sorts. But adrift between the galaxies may be billions of undiscovered lonely stars. These escaped stars, thrown out of their homes by gravitational interactions, may number in the billions for the Milky Way galaxy alone, and would provide details of historic galactic formations and mergers.

The theory that escaped and wandering stars exist isn’t new, and ejected stars from other galaxies have already been observed (see Hyperfast Star Ejected from the Large Magellanic Cloud). Our Milky Way formed as the result of many mergers with smaller dwarf galaxies, and as a result of these gravitational train wrecks, billions of stars could have been thrown out of the system, breaking free of their gravitational bonds to wander between the galaxies forever.

Wandering stars – those that have loosely bound orbits around a galaxy  – and escaped stars that have left the galaxy altogether could be discovered in the near future by the Large Synoptic Survey Telescope, planned for development in Chile, and Pan-STARRS. In the December 10 issue of Astrophysical Journal Letters, a team of astronomers led by Michael Shara of the American Museum of Natural History explores the provenance of these drifters, and estimates the lower limit of their numbers to be 0.05% of the Milky Way galaxy’s stellar population. That places their numbers well in the billions.

Red giant stars and classical novae have been detected outside the Milky Way, but only in clusters. Finding the individual escaped stars would be a challenge because of how dim they would appear. Because of the mechanism that ejects them  from the Milky Way, many would be older and redder, having formed when the galaxy was much younger. But the phenomenon of novae and supernovae would allow upcoming large scale sky surveys to pick up the few that exploded.

Building up a database of these intergalactic novae and supernovae would give astronomers better information on their orbital characteristics, which in turn would allow for improved modeling of how the Milky Way formed: knowing where the stars are now and what their velocity is gives information as to where they were in the past. Research into older, high-velocity stars that travel back into the Milky Way is ongoing, and would supplement the figure for how many of these galactic jailbreakers exist.

Source: Arxiv, nod to Scientific American

Get the Big Picture of the Milky Way at the Adler Planetarium

Spitzer infrared image on display at the Adler Planetarium. Credit: Adler

[/caption]
Astronomy is all about getting the big picture of our place in the cosmos, but some pictures are bigger than others. This one is really big. The world’s largest image of our Milky Way galaxy went on display today at the Adler Planetarium in Chicago. The image spans an area of 37 meters (120 feet) long by 1 meter (3 feet) wide at its sides, bulging to 2 meters (6 feet) to show the center of our humongous galaxy. The panorama represents 800,000 separate images taken by the Spitzer Space Telescope over a five-year period.


“This is the highest-resolution, largest, most sensitive infrared picture ever taken of our Milky Way,” said Sean Carey of NASA’s Spitzer Science Center, speaking when the image was unveiled in 2008 at the American Astronomical Society meeting in St. Louis (see our article and image of the unveiling). “Where previous surveys saw a single source of light, we now see a cluster of stars. With this data, we can learn how massive stars form, map galactic spiral arms and make a better estimate of our galaxy’s star-formation rate.”

Spitzer Survey image compiled.  Credit: NASA/JPL
Spitzer Survey image compiled. Credit: NASA/JPL

Data from Spitzer’s Infrared Array Camera (IRAC) and the Multiband Imaging Photometer were used to create the image.

If you want to download a very large version of this image (2400 x 3000) click here — warning: very big file.

From our vantage point on Earth, we see the Milky Way as a blurry, narrow band of light that stretches across the sky. In the visible, we only see about 5% of what’s actually out there. But with Spitzer’s dust-piercing infrared eyes, astronomers have peered 60,000 light-years away into this fuzzy band, called the galactic plane, and saw all the way to the other side of the galaxy.

The panorama reveals star formation as never seen before on both the large and small scale. Most of the star forming regions had not been seen before this project was undertaken.

I had the good fortune of seeing the image in St. Louis, and I highly recommend taking the opportunity to go see it at the Adler Planetarium if you are in Chicago. Here’s a video that explains how astronomers took the images and put them all together to form this gigantic panorama.

*Serendipitously, I am currently at the dotAstronomy conference where Eli Bressert from the Chandra X-Ray Center talked about the GLIMPSE Viewer. Here’s the link to see the Spitzer image with GLIMPSE (Galactic Legacy Infrared Midplane Extraordinaire).

Adler Planetarium is located at 1300 South Lake Shore Drive, Chicago, Ill., 60605. Phone: 312-922-7827. Adler Planetarium website. .

Astronomers Dig Up Relic of the Milky Way’s Central Bulge

Terzan 5. Credit: ESO/F. Ferraro

[/caption]

Like archaeologists who dig through the layers of dirt to unearth crucial pieces of the history of mankind, astronomers have been gazing through the thick layers of interstellar dust obscuring the central bulge of the Milky Way and have unveiled an extraordinary cosmic relic. Within the bulge is an unusual mix of stars in the stellar grouping known as Terzan 5, and such a mix has never been observed anywhere in the bulge before. This peculiar conglomeration of stars suggests that Terzan 5 is one of the bulge’s primordial building blocks, most likely the relic of a dwarf galaxy that merged with the Milky Way during its very early days.

The new observations of Terzan 5 show that this object, unlike all but a few exceptional globular clusters, does not harbor stars which are all born at the same time — what astronomers call a “single population” of stars. Instead, the multitude of glowing stars in Terzan 5 formed in at least two different epochs, the earliest probably some 12 billion years ago and then again 6 billion years ago.

Dust around Terzan 5. Credit: ESO

“Only one globular cluster with such a complex history of star formation has been observed in the halo of the Milky Way: Omega Centauri,” says team member Emanuele Dalessandro. “This is the first time we see this in the bulge.”

Using ESO’s Very Large Telescope, equipped with the Multi-conjugate Adaptive Optics Demonstrator (MAD), the astronomers were able to “disperse the fog” of the dust clouds in the central bulge to reveal the myriad of stars.

Through the sharp eye of the VLT, the astronomers also found that Terzan 5 is more massive than previously thought: along with the complex composition and troubled star formation history of the system, this suggests that it might be the surviving remnant of a disrupted dwarf galaxy, which merged with the Milky Way during its very early stages and thus contributed to form the galactic bulge.

The team hopes this is only the first in a series of discoveries on the origin of bulges in galaxies.

“The history of the Milky Way is encoded in its oldest fragments, globular clusters and other systems of stars that have witnessed the entire evolution of our galaxy,” says Francesco Ferraro, lead author of a paper appearing in this week’s issue of the journal Nature. “Our new study opens a new window on yet another piece of our galactic past.”

Source: ESO

Great Observatories Combine for Stunning Look at Milky Way

All we can say is, “Wow!” In celebration of the International Year of Astronomy 2009, NASA’s Great Observatories — the Hubble Space Telescope, the Spitzer Space Telescope, and the Chandra X-ray Observatory — have collaborated to produce an unprecedented image of the central region of our Milky Way galaxy. This is a never-before-seen view of the turbulent heart of our home galaxy. The image is being unveiled by NASA to commemorate the anniversary of when Galileo first turned his telescope to the heavens in 1609. NASA provided this image and the individual images taken by each of the Great Observatories to more than 150 planetariums, museums, nature centers, libraries, and schools across the country.

In this spectacular image, observations using infrared light and X-ray light see through the obscuring dust and reveal the intense activity near the galactic core. Note that the center of the galaxy is located within the bright white region to the right of and just below the middle of the image. The entire image width covers about one-half a degree, about the same angular width as the full moon.

For more about the image or to download larger versions, go to this page on the HubbleSite.

1 Milky Way; 3,000 Images

The Milky Way. Credit: Axel Mellinger

[/caption]
What a gorgeous and immense image! And it’s full of stars! An astronomer from Central Michigan University has put together a new high-resolution panoramic image of the full night sky , with the Milky Way galaxy as its centerpiece. Axel Mellinger stitched together over 3,000 images to create this beautiful image, which also comes in an interactive version, showing stars 1,000 times fainter than the human eye can see, as well as hundreds of galaxies, star clusters and nebulae.

View an interactive version at Mellinger’s website.

Mellinger spent 22 months and traveled over 26,000 miles to take digital photographs at dark sky locations in South Africa, Texas and Michigan. After the photographs were taken, “the real work started,” Mellinger said.

Simply cutting and pasting the images together into one big picture would not work. Each photograph is a two-dimensional projection of the celestial sphere. As such, each one contains distortions, in much the same way that flat maps of the round Earth are distorted. In order for the images to fit together seamlessly, those distortions had to be accounted for. To do that, Mellinger used a mathematical model—and hundreds of hours in front of a computer.

Another problem Mellinger had to deal with was the differing background light in each photograph.

“Due to artificial light pollution, natural air glow, as well as sunlight scattered by dust in our solar system, it is virtually impossible to take a wide-field astronomical photograph that has a perfectly uniform background,” Mellinger said.

To fix this, Mellinger used data from the Pioneer 10 and 11 space probes. The data allowed him to distinguish star light from unwanted background light. He could then edit out the varying background light in each photograph. That way they would fit together without looking patchy.

The result is an image of our home galaxy that no star-gazer could ever see from a single spot on earth. Mellinger plans to make the giant 648 megapixel image available to planetariums around the world.

Source: EurekAlert