Yes, we humans excel at seeing patterns and shapes everywhere around us, including out in space. Here, the folks from Sixty Symbols (featuring my friend Astropixie a.k.a Amanda Bauer) celebrate Valentine’s Day by showing several heart-shaped astronomical. Also, as explained in the video, 20 years ago today — on February 14, 1990 — the Voyager 1 spacecraft took the famous “Pale Blue Dot” image, where it turned around and took a picture of Earth. From 6 billion kilometers (4 billion miles) away Earth appeared as a “mote of dust suspended in a sunbeam” as Carl Sagan phrased it. It truly is one of the most “romantic” images ever as it can’t help but evoke strong emotions by anyone who sees it. “That’s here, that’s home, that’s us. On it everyone you love, everyone you know, everyone you ever heard of, every human being who ever was, lived out their lives,” said Sagan.
Continue reading “For Valentine’s Day: Hearts in Space from Sixty Symbols”
On New Year’s Eve, Cassini Will Stare at the Death Star’s Superlaser
OK, it’s actually the Herschel crater on Mimas, a smallish moon of Saturn (and it’s the eve of Chinese New Year, February 13th, 2010), but it’s a cool headline, don’t you think?
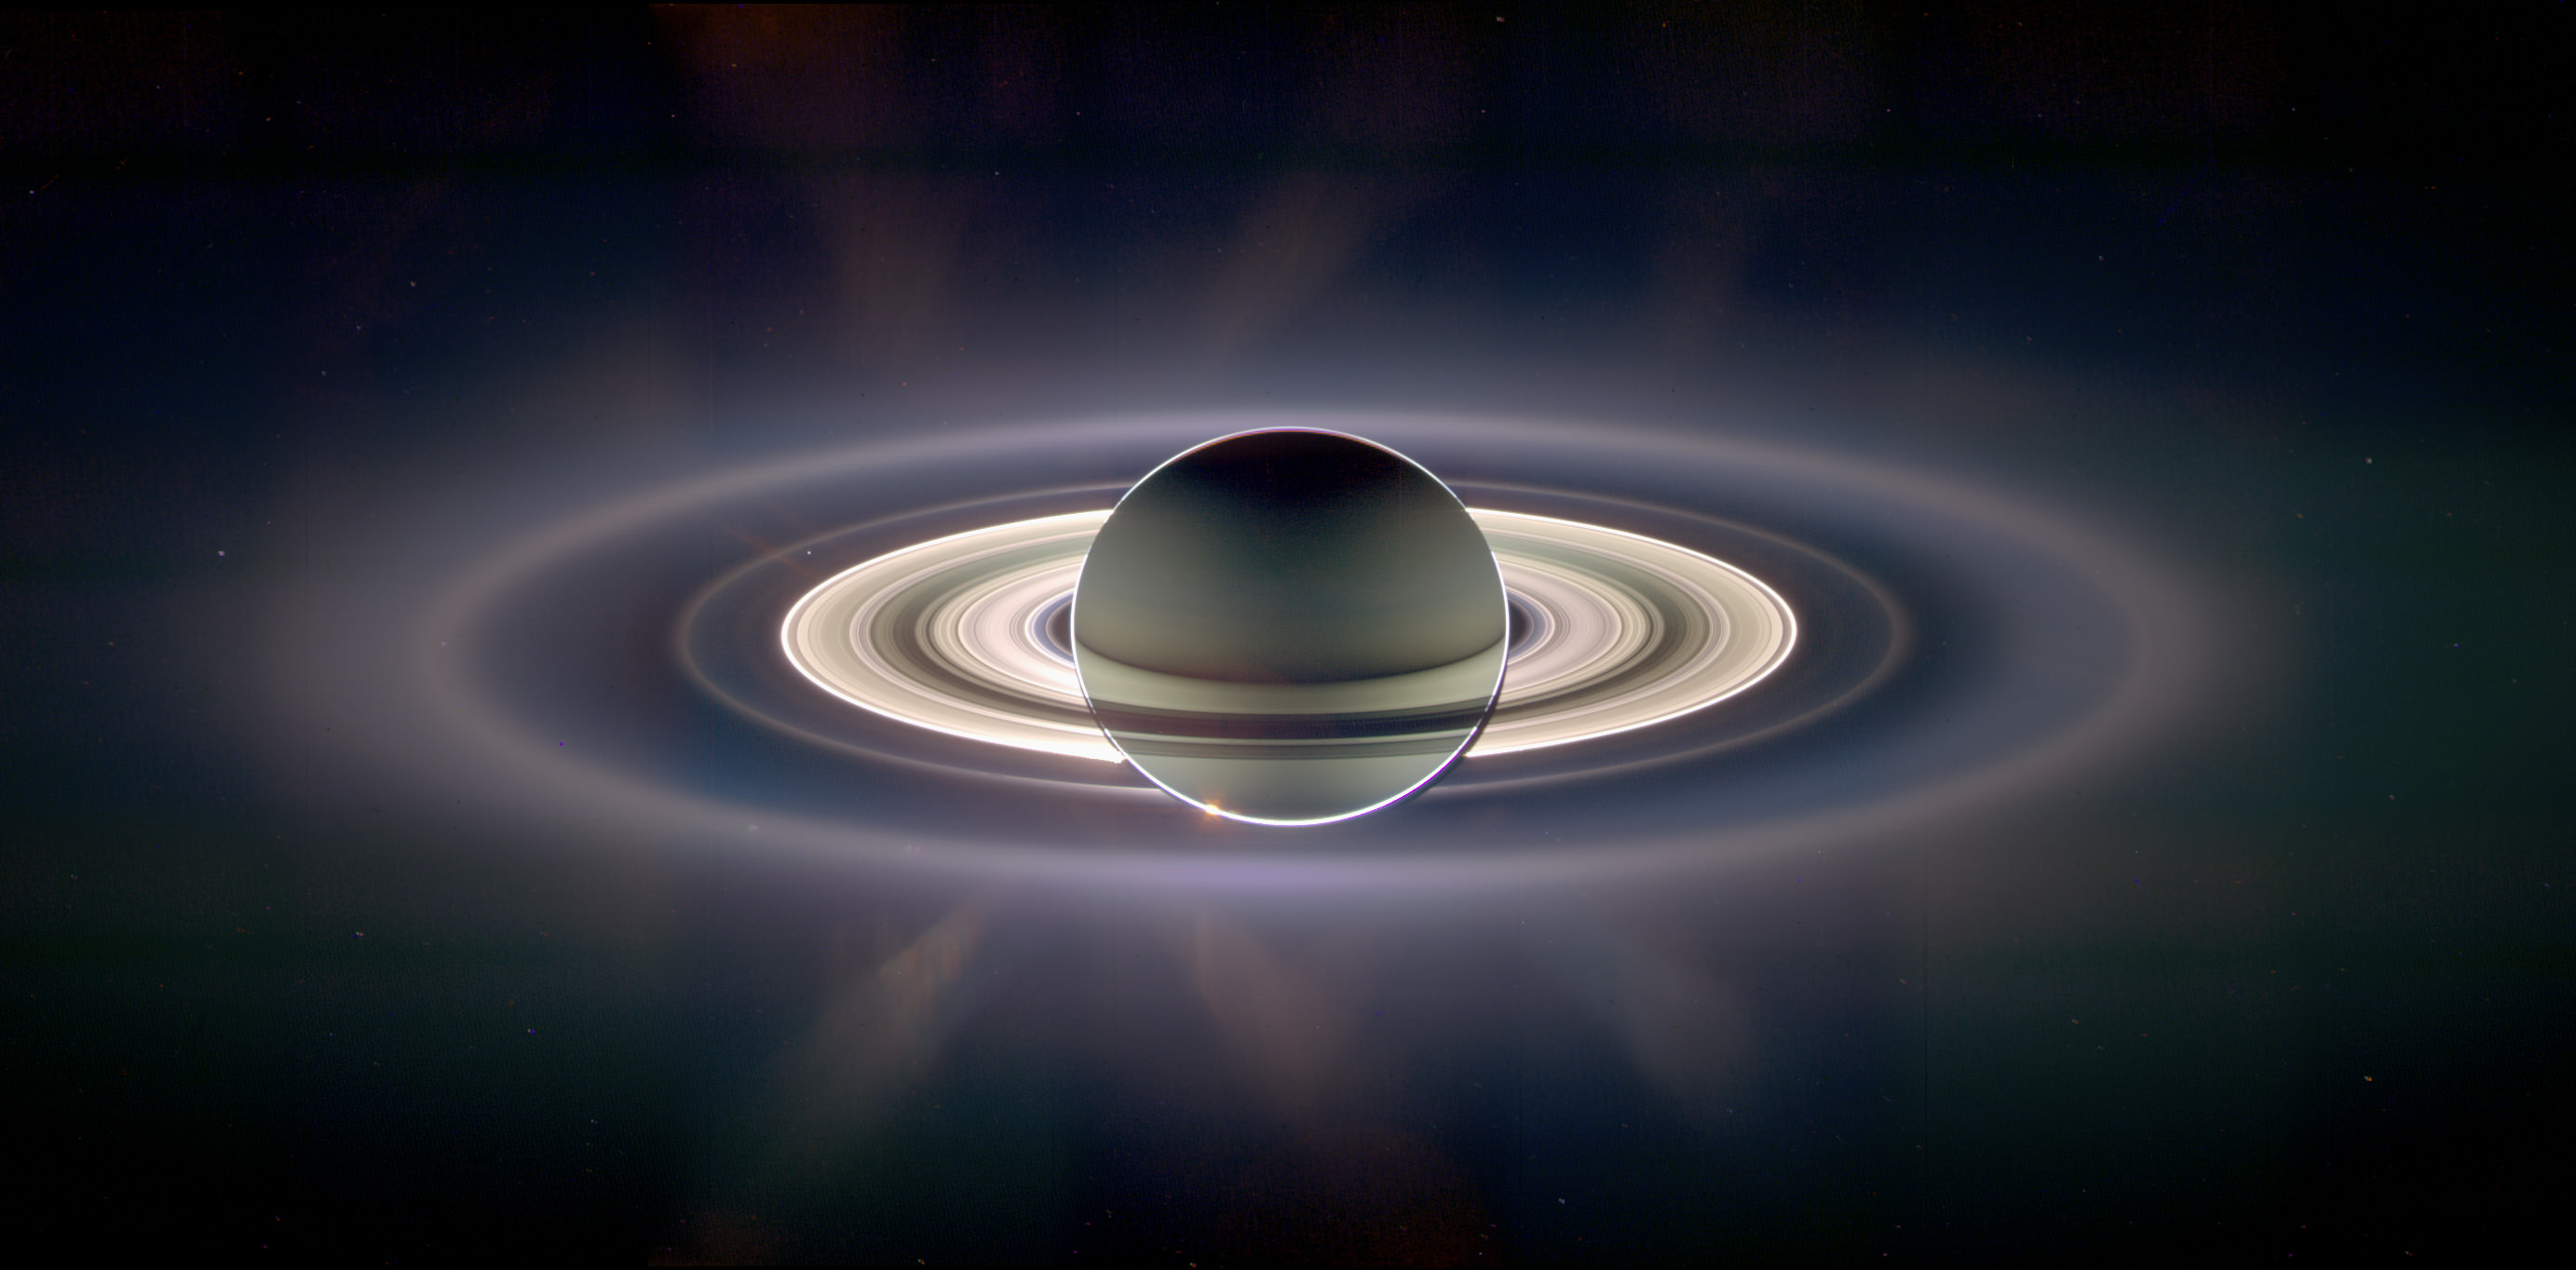
Cassini will be very busy that day, which begins with a rare sunrise – the Sun goes behind Saturn (from Cassini’s perspective) – followed by a rare blackout, as the Earth goes behind Saturn. Then there’s three “Forward shields up!” moments, as Cassini tries to dodge a Klingon missile flies through regions of “increased ring particle concentration”, a couple of distant flybys (Epimetheus, Janus; ~100,000 km each), a ring-plane crossing, another “Shields up!” moment, and a 9,500 km close approach to Death Star Mimas. And the day ends with a distant (112,000 km) flyby of Tethys. Whew!
“Mimas bears the mark of a violent, giant impact from the past – the 140-kilometer-wide Herschel Crater – and scientists hope the encounter will help them explain why the moon was not blown to smithereens when the impact happened. They will also be trying to count smaller dings inside the basin of Herschel Crater so they can better estimate its age,” JPL’s Jia-Rui C. Cook said, “The Mimas flyby involves a significant amount of skill because the spacecraft will be passing through a dusty region to get there. Mission managers have planned for the Cassini spacecraft to lead with its high-gain antenna to provide a barrier of protection.”
To date, the best images of Mimas – and its Herschel crater – were obtained on August 2nd, 2005, during Cassin’s distant flyby.
Mimas is an inner moon of Saturn that averages 396 kilometers in diameter. The diameter of Herschel Crater is about one-third that of the entire moon. The walls of the crater are about 5 kilometers high, and parts of the floor are approximately 10 kilometers deep.
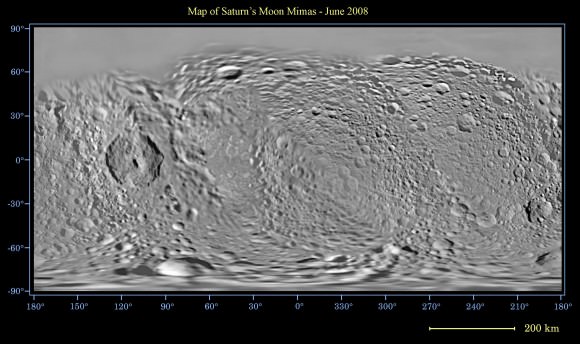
Mimas would have beaten another of Saturn’s moons, Rhea, for the record of “most battered moon”, but for the fact that it was warmer – and so softer – for longer than Rhea (because it’s closer to Saturn), so many of the earliest craters were more degraded.
Have you heard of the “Mimas paradox”? Mimas’ orbit is more eccentric than Enceladus’, and is in resonance with Dione and Enceladus – so it should be heated, tidally, more than Enceladus – but its surface has not, apparently, changed for a very long time (while geysers on Enceladus show that it is still quite active). Further, the two moons seem to have similar compositions.
On this flyby, Cassini’s composite infrared spectrometer will be working to determine the thermal signature of the moon, and other instruments will be making measurements to learn more about the surface composition. Perhaps that will shed some light on the Mimas paradox.
Sources: Cassini Set to Do Retinal Scan of Saturnian Eyeball, Mimas (NASA/JPL)
Multi-Layer Mars Parfait Provides Environmental Record
[/caption]
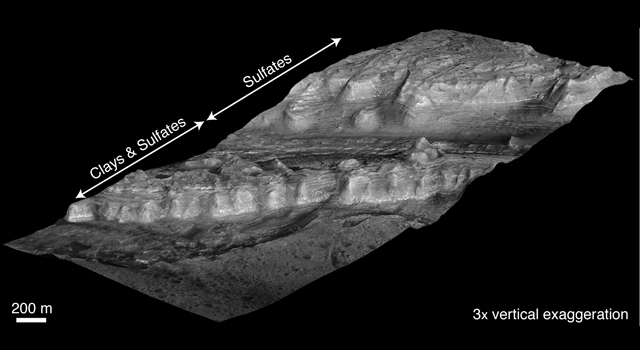
Is Mars more like a Peanut Buster Parfait, a granola-yogurt parfait, –or perhaps — maybe a seven-layer salad? Near the center of a Martian crater about the size of Connecticut, hundreds of exposed rock layers form a mound as tall as the Rockies and reveal a record of major environmental changes on Mars billions of years ago. According to a new report by geologists using instruments on the Mars Reconnaissance Orbiter to look at the “parfait” of layers inside Gale Crater, the layers show that Mars was likely wet at one point, but gradually dried over time.
“Looking at the layers from the bottom to the top, from the oldest to the youngest, you see a sequence of changing rocks that resulted from changes in environmental conditions through time,” said Ralph Milliken from JPL. “This thick sequence of rocks appears to be showing different steps in the drying-out of Mars.”
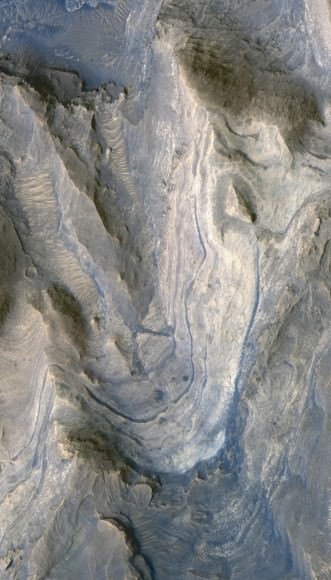
Milliken and two co-authors of a paper in Geophysical Research Letters say that clay minerals, which form under very wet conditions, are concentrated in layers near the bottom of the Gale stack. Above that, sulfate minerals are intermixed with the clays. Sulfates form in wet conditions and can be deposited when the water in which they are dissolved evaporates. Higher still are sulfate-containing layers without detectable clays. And at the top is a thick formation of regularly spaced layers bearing no detectable water-related minerals.
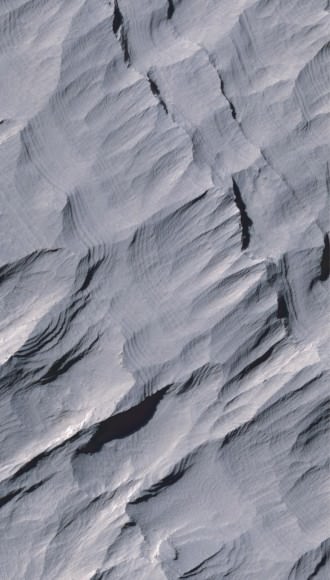
Rock exposures with compositions like various layers of the Gale stack have been mapped elsewhere on Mars, and researchers, including Jean-Pierre Bibring of the University of Paris, have proposed a Martian planetary chronology of clay-producing conditions followed by sulfate-producing conditions followed by dry conditions. However, Gale is the first location where a single series of layers has been found to contain these clues in a clearly defined sequence from older rocks to younger rocks.
“If you could stand there, you would see this beautiful formation of Martian sediments laid down in the past, a stratigraphic section that’s more than twice the height of the Grand Canyon, though not as steep,” said Bradley Thomson of the Johns Hopkins University Applied Physics Laboratory, Laurel, Md. He and John Grotzinger of the California Institute of Technology in Pasadena are Milliken’s co-authors.
NASA selected Gale Crater in 2008 as one of four finalist sites for the Mars Science Laboratory rover, Curiosity, which has a planned launch in 2011. The finalist sites all have exposures of water-related minerals, and each has attributes that distinguish it from the others. This new report is an example of how observations made for evaluating the landing-site candidates are providing valuable science results even before the rover mission launches.
WISE Spies Its First Comet
[/caption]
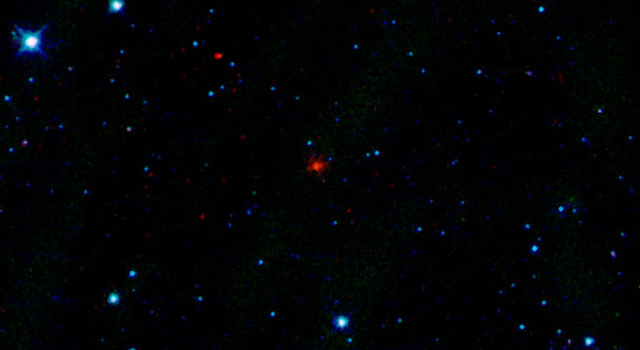
The Wide-field Infrared Survey Explorer or WISE is living up to expectations, as it now has discovered its first comet, shortly after finding its first asteroid. The spacecraft, just launched on Dec. 14, 2009 and first spotted the comet on January 22, 2010. WISE is expected to find millions of other objects during its ongoing survey of the whole sky in infrared light. Officially named “P/2010 B2 (WISE),” the comet is a dusty mass of ice more than 2 kilometers (1.2 miles) in diameter.
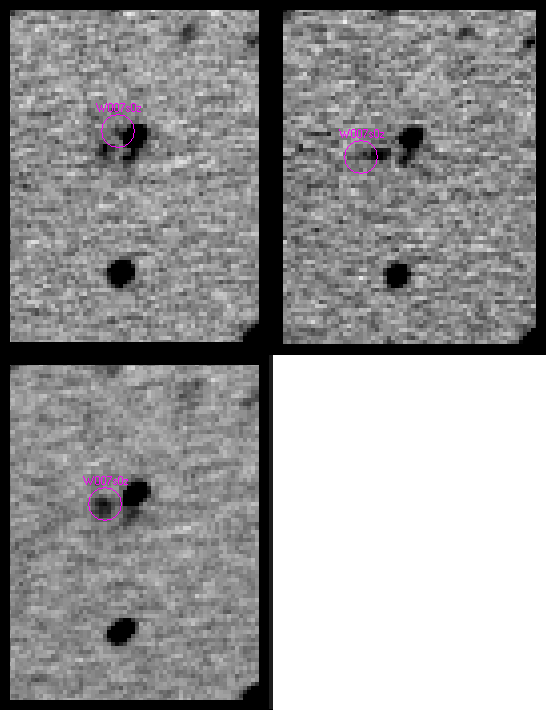
Comet and asteroid hunter Robert Holmes, who we have written about previously on Universe Today (whose Astronomical Research Observatory and Killer Asteroid Project in Illinois is not far from where I live) made the first ground-based confirmation of WISE’s comet discovery, with his home-built 0.81-meter telescope. Many large observatories attempted to confirm this discovery more than 7 days earlier including the Faulkes 2.0m telescope in Hawaii, without success. And due to poor weather, Holmes had to wait several days to get a look at the WISE comet himself. Holmes produces images for educational and public outreach programs like the International Astronomical Search Collaboration (IASC), which gives students and teachers the opportunity to make observations and discoveries, and a teacher actually assisted in the confirmation of this new comet.
Astronomers from the WISE team say the comet probably formed around the same time as our solar system, about 4.5 billion years ago. Comet WISE started out in the cold, dark reaches of our solar system, but after a long history of getting knocked around by the gravitational forces of Jupiter, it settled into an orbit much closer to the sun. Right now, the comet is heading away from the sun and is about 175 million kilometers (109 million miles) from Earth.
“Comets are ancient reservoirs of water. They are one of the few places besides Earth in the inner solar system where water is known to exist,” said Amy Mainzer of NASA’s Jet Propulsion Laboratory in Pasadena, Calif. Mainzer is the principal investigator of NEOWISE, a project to find and catalog new asteroids and comets spotted by WISE (the acronym combines WISE with NEO, the shorthand for near-Earth object).
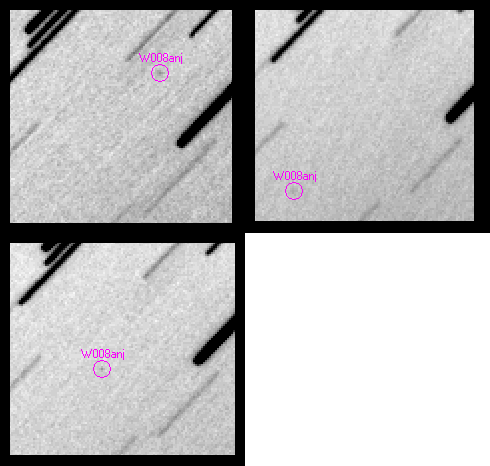
“With WISE, we have a powerful tool to find new comets and learn more about the population as a whole,” said Mainzer. “Water is necessary for life as we know it, and comets can tell us more about how much there is in our solar system.”
“It is very unlikely that a comet will hit Earth,” said James Bauer, a scientist at JPL working on the WISE project, “But, in the rare chance that one did, it could be dangerous. The new discoveries from WISE will give us more precise statistics about the probability of such an event, and how powerful an impact it might yield.”
Comet WISE takes 4.7 years to circle the sun, with its farthest point being about 4 astronomical units away, and its closest point being 1.6 astronomical units (near the orbit of Mars). An astronomical unit is the distance between Earth and the sun. Heat from the sun causes gas and dust to blow off the comet, resulting in a dusty coma, or shell, and a tail.
Sources: JPL, Killer Asteroid Project
The Solar Dynamics Observatory Soars to Study the Sun
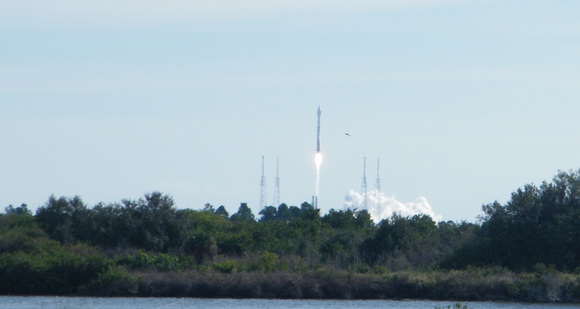
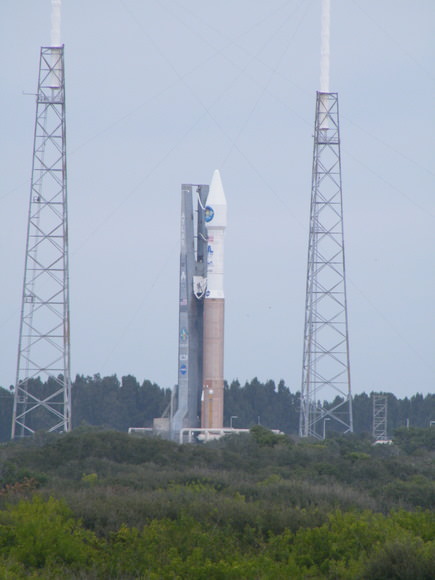
The Solar Dynamics Observatory launched successfully – and beautifully – Thursday morning from Cape Canaveral Launch Complex 41 to begin a 5-year mission that will provide streaming, high-definition views of our sun. It was the 100th launch of the Atlas/Centaur combo, and was a gorgeous sight as it roared and soared into the blue Florida sky. “It was great; a beautiful launch,” said Dean Pesnell, SDO Project Scientist, immediately after the launch. “The rocket rises so slowly off the pad — it is wonderful to see. This is third Atlas launch I’ve seen and this is the best one so far.”
Amazingly, viewers here at Kennedy Space Center saw the Atlas rocket fly close to a sundog just as the spacecraft reached Max-Q, creating a ripple effect around the spacecraft. “We saw this sundog come out and SDO flew right through it. Then the sun dog disappeared,” said Pesnell. “This may be the first time we’ve sent a probe through a sundog, and people will be studying this, so already we are learning things about our atmosphere from SDO.”
See this amazing video shot by a 13-year-old girl in attendance at the KSC VIP site that shows the sundog and shockwave. (as noted by Jon Hanford in the comments).
Today’s countdown was extremely smooth as the high winds that thwarted Wednesday’s launch attempt calmed as the opening of the launch window approached. After counting down to the planned T-4 minute hold, launch managers proceeded directly to launch at the beginning of the window at 10:23 a.m. EST.

“I was a little worried about the clouds coming in,” said Tom Woods, Principal Investigator for the EVE instrument on SDO, the EUV Variability Experiment, which will be studying the extreme ultraviolet radiation of the Sun. “But we were very excited to see SDO launch today, as otherwise it would have been a 10-day delay until the next attempt. It was a wonderful launch!”
“It was so beautiful,” said Lika Guhathakurta, SDO program scientist immediately following the launch as we walked together back to the press building. “I can still feel the rumbling in my stomach!”
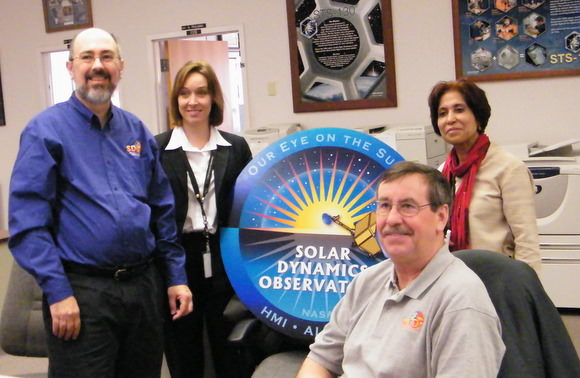
Called the “Crown Jewel” of NASA’s fleet of solar observatories, SDO is a technologically advanced spacecraft that will take images of the sun every 0.75 seconds and daily send back about 1.5 terabytes of data to Earth — the equivalent of downloading 380 full-length movies every day.
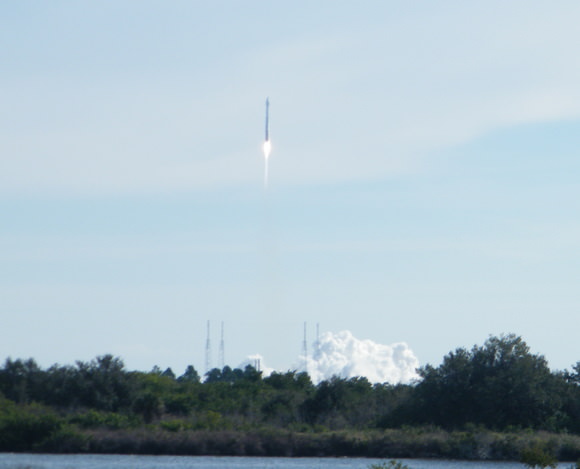
“We’re going to be able to better understand the Sun as a star,” said Guathakurta, “but SDO will also give us a comprehensive view of how it interacts with the Earth and everything else in the solar system.
The sun’s dynamic processes affect everyone and everything on Earth. SDO will explore activity on the sun that can disable satellites, cause power grid failures, and disrupt GPS communications. SDO also will provide a better understanding of the role the sun plays in Earth’s atmospheric chemistry and climate.
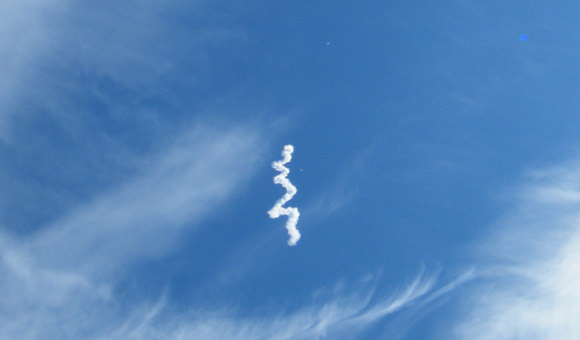
A contrail from the launch appeared only in the region of Earth’s atmosphere where conditions were right for cloud formation. “There weren’t any clouds there, but we provided the very fine particles so that a contrail cloud appeared,” said Pesnell.
A later update confirmed that SDO separated from the Centaur and the spacecraft’s solar arrays deployed on time and correctly, and are now generating power.
Here’s the video of the launch from NASA TV:
SDO Launch Scrub; Try Again Tomorrow
[/caption]
Note: Nancy Atkinson is at Kennedy Space Center to cover SDO and the STS-130 shuttle mission
Scrub! High winds kept the Solar Dynamics Observatory on the ground for today, but the launch team will try again Thursday (Feb. 11) at 10:26 a.m. EST (15:26 GMT). Weather is 60% go for tomorrow, and winds will be down to about 16 knots but cloud cover may be an issue. Today, winds consistently peaked well above the constraint speed of 20 knots – often well into the 30’s. The winds here at the press site were equally strong, and combined with cool weather, kept most people indoors until the launch team gave the go-ahead.
Winds were predicted to decrease later in the day, so the launch team pushed back the countdown as far into the launch window as possible. Originally slated for a 10:26 a.m. EST launch, they first moved it ahead 30 minutes to 10:56, and then to 11:26, leaving just the built-in hold at T-4 minutes in the countdown, — and more importantly, leaving only four minutes for a possible attempt. The count was able to pick up when the weather officer gave the go-ahead, but as soon as the countdown restarted, the count was automatically stopped because the wind loads had risen again.
The scrub was a disappointment for the SDO team, which has had repeated delays in their timeline leading up to launch. But now SDO and the Atlas V rocket can launch any day that the weather allows, so we’ll be back again tomorrow for another try!
You can follow my updates on Twitter (@Nancy_A) for live, real-time updates. I’ll also be reporting live Thursday morning on AstronomyFM, a 24-hour internet radio dedicated to astronomy and space exploration.
Seven-Year WMAP Results: No, They’re NOT Anomalies
Since the day the first Wilkinson Microwave Anisotropy Probe (WMAP) data were released, in 2003, all manner of cosmic microwave background (CMB) anomalies have been reported; there’s been the cold spot that might be a window into a parallel universe, the “Axis of Evil”, pawprints of local interstellar neutral hydrogen, and much, much more.
But do the WMAP data really, truly, absolutely contain evidence of anomalies, things that just do not fit within the six-parameters-and-a-model the WMAP team recently reported?
In a word, no.
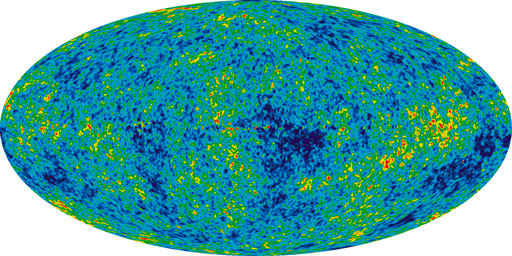
Every second year since 2003 the WMAP science team has published a set of papers on their analyses of the cumulative data, and their findings (with the mission due to end later this year, their next set will, sadly, be their last). With time and experience – not to mention inputs from the thousands of other researchers who have picked over the data – the team has not only amassed a lot more data, but has also come to understand how WMAP operates far better. As a consequence, not only are the published results – such as limits on the nature of dark energy, and the number of different kinds of neutrinos – more stringent and robust, but the team has also become very au fait with the various anomalies reported.
For the first time, the team has examined these anomalies, in detail, and has concluded that the answer to the question, in their words, “are there potential deviations from ?CDM within the context of the allowed parameter ranges of the existing WMAP observations?” is “no”.
The reported anomalies the team examined are many – two prominent cold spots, strength of the quadrupole, lack of large angular scale CMB power, alignment of the quadrupole and octupole components, hemispherical or dipole power asymmetry, to name but a handful – but the reasons for the apparent anomalies are few.
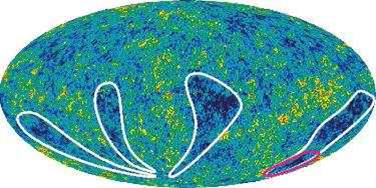
“Human eyes and brains are excellent at detecting visual patterns, but poor at assessing probabilities. Features seen in the WMAP maps, such as the large Cold Spot I near the Galactic center region, can stand out as unusual. However, the likelihood of such features can not be discerned by visual inspection of our particular realization of the universe,” they write, and “Monte Carlo simulations are an invaluable way to determine the expected deviations within the ?CDM model. Claims of anomalies without Monte Carlo simulations are necessarily weak claims”.

An amusing example: Stephen Hawking’s initials (“SH”) can be clearly seen in the WMAP sky map. “The “S” and “H” are in roughly the same font size and style, and both letters are aligned neatly along a line of fixed Galactic latitude,” the team says; “A calculation would show that the probability of this particular occurrence is vanishingly small. Yet, there is no case to made for a non-standard cosmology despite this extraordinarily low probability event,” they dryly note.
Many of the reports of WMAP CMB anomalies would likely make for good teaching material, as they illustrate well the many traps that you can so easily fall into when doing after-the-fact (a posteriori) statistical analyses. Or, as the team puts it in regard to the Stephen Hawking initials: “It is clear that the combined selection of looking for initials, these particular initials, and their alignment and location are all a posteriori choices. For a rich data set, as is the case with WMAP, there are a lot of data and a lot of ways of analyzing the data.”
And what happens when you have a lot of data? Low probability events are guaranteed to occur! “For example, it is not unexpected to find a 2? feature when analyzing a rich data set in a number of different ways. However, to assess whether a particular 2? feature is interesting, one is often tempted to narrow in on it to isolate its behavior. That process involves a posteriori choices that amplify the apparent significance of the feature.”
So, does the team conclude that all this anomaly hunting is a waste of effort? Absolutely not! I’ll quote from the team’s own conclusion: “The search for oddities in the data is essential for testing the model. The success of the model makes these searches even more important. A detection of any highly significant a posteriori feature could become a serious challenge for the model. The less significant features discussed in this paper provided the motivation for considering alternative models and developing new analysis of WMAP (and soon Planck) data. The oddities have triggered proposed new observations that can further test the models. It is often difficult to assess the statistical claims. It may well be that an oddity could be found that motivates a new theory, which then could be tested as a hypothesis against ?CDM. The data support these comparisons. Of course, other cosmological measurements must also play a role in testing new hypotheses. No CMB anomaly reported to date has caused the scientific community to adopt a new standard model of cosmology, but claimed anomalies have been used to provoke thought and to search for improved theories.”
Primary source: Seven-Year Wilkinson Microwave Anisotropy Probe (WMAP) Observations: Are There Cosmic Microwave Background Anomalies? (arXiv:1001.4758). The five other Seven-Year WMAP papers are: Seven-Year Wilkinson Microwave Anisotropy Probe (WMAP) Observations: Cosmological Interpretation (arXiv:1001.4538), Seven-Year Wilkinson Microwave Anisotropy Probe (WMAP) Observations: Planets and Celestial Calibration Sources (arXiv:1001.4731), Seven-Year Wilkinson Microwave Anisotropy Probe (WMAP) Observations: Sky Maps, Systematic Errors, and Basic Results (arXiv:1001.4744), Seven-Year Wilkinson Microwave Anisotropy Probe (WMAP) Observations: Power Spectra and WMAP-Derived Parameters (arXiv:1001.4635), and Seven-Year Wilkinson Microwave Anisotropy Probe (WMAP) Observations: Galactic Foreground Emission (arXiv:1001.4555). Also check out the official WMAP website.
Universe to WMAP: ΛCDM Rules, OK?
[/caption]
The Wilkinson Microwave Anisotropy Probe (WMAP) science team has finished analyzing seven full years’ of data from the little probe that could, and once again it seems we can sum up the universe in six parameters and a model.
Using the seven-year WMAP data, together with recent results on the large-scale distribution of galaxies, and an updated estimate of the Hubble constant, the present-day age of the universe is 13.75 (plus-or-minus 0.11) billion years, dark energy comprises 72.8% (+/- 1.5%) of the universe’s mass-energy, baryons 4.56% (+/- 0.16%), non-baryonic matter (CDM) 22.7% (+/- 1.4%), and the redshift of reionization is 10.4 (+/- 1.2).
In addition, the team report several new cosmological constraints – primordial abundance of helium (this rules out various alternative, ‘cold big bang’ models), and an estimate of a parameter which describes a feature of density fluctuations in the very early universe sufficiently precisely to rule out a whole class of inflation models (the Harrison-Zel’dovich-Peebles spectrum), to take just two – as well as tighter limits on many others (number of neutrino species, mass of the neutrino, parity violations, axion dark matter, …).
The best eye-candy from the team’s six papers are the stacked temperature and polarization maps for hot and cold spots; if these spots are due to sound waves in matter frozen in when radiation (photons) and baryons parted company – the cosmic microwave background (CMB) encodes all the details of this separation – then there should be nicely circular rings, of rather exact sizes, around the spots. Further, the polarization directions should switch from radial to tangential, from the center out (for cold spots; vice versa for hot spots).
And that’s just what the team found!
Concerning Dark Energy. Since the Five-Year WMAP results were published, several independent studies with direct relevance to cosmology have been published. The WMAP team took those from observations of the baryon acoustic oscillations (BAO) in the distribution of galaxies; of Cepheids, supernovae, and a water maser in local galaxies; of time-delay in a lensed quasar system; and of high redshift supernovae, and combined them to reduce the nooks and crannies in parameter space in which non-cosmological constant varieties of dark energy could be hiding. At least some alternative kinds of dark energy may still be possible, but for now Λ, the cosmological constant, rules.
Concerning Inflation. Very, very, very early in the life of the universe – so the theory of cosmic inflation goes – there was a period of dramatic expansion, and the tiny quantum fluctuations before inflation became the giant cosmic structures we see today. “Inflation predicts that the statistical distribution of primordial fluctuations is nearly a Gaussian distribution with random phases. Measuring deviations from a Gaussian distribution,” the team reports, “is a powerful test of inflation, as how precisely the distribution is (non-) Gaussian depends on the detailed physics of inflation.” While the limits on non-Gaussianity (as it is called), from analysis of the WMAP data, only weakly constrain various models of inflation, they do leave almost nowhere for cosmological models without inflation to hide.
Concerning ‘cosmic shadows’ (the Sunyaev-Zel’dovich (SZ) effect). While many researchers have looked for cosmic shadows in WMAP data before – perhaps the best known to the general public is the 2006 Lieu, Mittaz, and Zhang paper (the SZ effect: hot electrons in the plasma which pervades rich clusters of galaxies interact with CMB photons, via inverse Compton scattering) – the WMAP team’s recent analysis is their first to investigate this effect. They detect the SZ effect directly in the nearest rich cluster (Coma; Virgo is behind the Milky Way foreground), and also statistically by correlation with the location of some 700 relatively nearby rich clusters. While the WMAP team’s finding is consistent with data from x-ray observations, it is inconsistent with theoretical models. Back to the drawing board for astrophysicists studying galaxy clusters.

I’ll wrap up by quoting Komatsu et al. “The standard ΛCDM cosmological model continues to be an exquisite fit to the existing data.”
Primary source: Seven-Year Wilkinson Microwave Anisotropy Probe (WMAP) Observations: Cosmological Interpretation (arXiv:1001.4738). The five other Seven-Year WMAP papers are: Seven-Year Wilkinson Microwave Anisotropy Probe (WMAP) Observations: Are There Cosmic Microwave Background Anomalies? (arXiv:1001.4758), Seven-Year Wilkinson Microwave Anisotropy Probe (WMAP) Observations: Planets and Celestial Calibration Sources (arXiv:1001.4731), Seven-Year Wilkinson Microwave Anisotropy Probe (WMAP) Observations: Sky Maps, Systematic Errors, and Basic Results (arXiv:1001.4744), Seven-Year Wilkinson Microwave Anisotropy Probe (WMAP) Observations: Power Spectra and WMAP-Derived Parameters (arXiv:1001.4635), and Seven-Year Wilkinson Microwave Anisotropy Probe (WMAP) Observations: Galactic Foreground Emission (arXiv:1001.4555). Also check out the official WMAP website.
Movies of Spirit’s Last Moves Before Winter
Even though the Spirit rover is stuck in a Martian sandtrap, the rover drivers were actually able to move her quite a bit, and therefore improving her chances of surviving the winter. This video shows recent drives by the Spirit rover from Jan. 14 to Feb. 4, 2010 (Sols 2145 to 2165), where the center of the rover approximately 13.4 inches (34 centimeters) backwards. Since Jan 26 (sol 2157), drive commands have concentrated on placing Spirit into a favorable tilt toward the sun as the Martian winter approaches.
More Stunning Images and Discoveries Ahead: Cassini Mission Extended to 2017
[/caption]
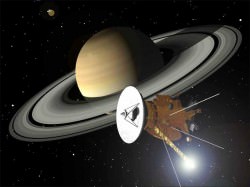
With the new 2011 NASA budget allowing for more space science activities, the space agency has extended the Cassini mission to explore Saturn and its moons to 2017. “This is a mission that never stops providing us surprising scientific results and showing us eye popping new vistas,” said Jim Green, director of NASA’s planetary science division. “The historic traveler’s stunning discoveries and images have revolutionized our knowledge of Saturn and its moons.” This is the second mission extension for Cassini, and the new “Solstice Mission” will allow scientists to study seasonal and other long-term weather changes on the planet and its moons.
The Cassini mission will get $60 million per year to continue its study of the Saturn system.
“The extension presents a unique opportunity to follow seasonal changes of an outer planet system all the way from its winter to its summer,” said Bob Pappalardo, Cassini project scientist. “Some of Cassini’s most exciting discoveries still lie ahead.”
Cassini arrived just after Saturn’s northern winter solstice, and this extension continues until a few months past northern summer solstice in May 2017. The northern summer solstice marks the beginning of summer in the northern hemisphere and winter in the southern hemisphere.
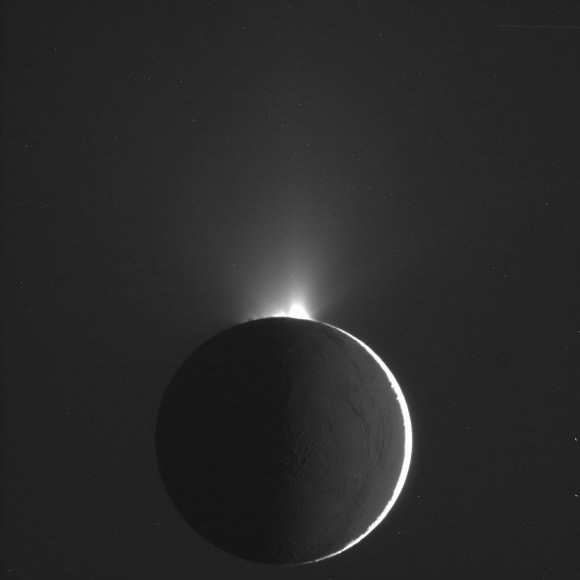
A complete seasonal period on Saturn has never been studied at this level of detail. The Solstice mission schedule calls for an additional 155 orbits around the planet, 54 flybys of Titan and 11 flybys of the icy moon Enceladus.
The mission extension also will allow scientists to continue observations of Saturn’s rings and the magnetic bubble around the planet known as the magnetosphere. The spacecraft will make repeated dives between Saturn and its rings to obtain in depth knowledge of the gas giant. During these dives, the spacecraft will study the internal structure of Saturn, its magnetic fluctuations and ring mass.
Cassini launched in October 1997 with the European Space Agency’s Huygens probe. The spacecraft arrived at Saturn in 2004. The probe was equipped with six instruments to study Titan, Saturn’s largest moon. Cassini’s 12 instruments have returned a daily stream of data from Saturn’s system for nearly six years.
“The spacecraft is doing remarkably well, even as we endure the expected effects of age after logging 2.6 billion miles on its odometer,” said Bob Mitchell, Cassini program manager at JPL. “This extension is important because there is so much still to be learned at Saturn. The planet is full of secrets, and it doesn’t give them up easily.”
Cassini’s travel scrapbook includes more than 210,000 images; information gathered during more than 125 revolutions around Saturn; 67 flybys of Titan and eight close flybys of Enceladus. Cassini has revealed unexpected details in the planet’s signature rings, and observations of Titan have given scientists a glimpse of what Earth might have been like before life evolved.
For more info on the mission, check out the Cassini website.


