Russian Asteroid Explosion and Past Impactors Paint a Potentially Grim Future for Earth

Impactors strike during the reign of the dinosaurs (image credit: MasPix/devianart)

The recent meteor explosion over Chelyabinsk brought to the forefront a topic that has worried astronomers for years, namely that an impactor from space could cause widespread human fatalities.  Indeed, the thousand+ injured recently in Russia was a wake-up call. Should humanity be worried about impactors? “Hell yes!” replied astronomer Neil deGrasse Tyson to CNN’s F. Zakharia .

The geological and biological records attest to the fact that some impactors have played a major role in altering the evolution of life on Earth, particularly when the underlying terrestrial material at the impact site contains large amounts of carbonates and sulphates. The dating of certain large impact craters (50 km and greater) found on Earth have matched events such as the extinction of the Dinosaurs (Hildebrand 1993, however see also G. Keller’s alternative hypothesis).  Ironically, one could argue that humanity owes its emergence in part to the impactor that killed the Dinosaurs.
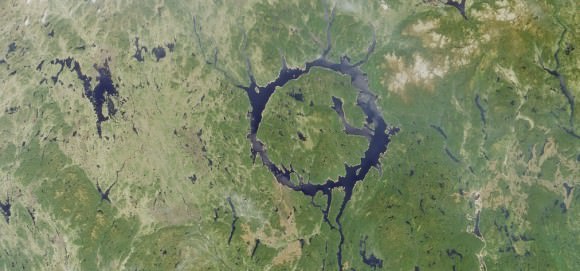
The Manicouagan impact crater in Quebec, Canada (image credit: NASA)
More than a dozen known impactors created 50 km sized craters (and larger) on Earth. One such example is the Manicouagan crater in Quebec, Canada.  The crater is 215 million years old, and exhibits an 85 km diameter (image credit: NASA).

Only rather recently did scientists begin to widely acknowledge that sizable impactors from space strike Earth.

“It was extremely important in that first intellectual step to recognize that, yes, indeed, very large objects do fall out of the sky and make holes in the ground,” said Eugene Shoemaker. Shoemaker was a co-discoverer of Shoemaker-Levy 9, which was a fragmented comet that hit Jupiter in 1994 (see video below).

Hildebrand 1993 likewise noted that, “the hypothesis that catastrophic impacts cause mass extinctions has been unpopular with many geologists … some geologists still regard the existence of ~140 known impact craters on the Earth as unproven despite compelling evidence to the contrary.”

Beyond the asteroid that struck Mexico 65 million years ago and helped end the reign of the dinosaurs, there are numerous lesser-known terrestrial impactors that also appear destructive given their size. For example, at least three sizable impactors struck Earth ~35 million years ago, one of which left a 90 km crater in Siberia (Popigai). At least two large impactors occurred near the Jurassic-Cretaceous boundary (Morokweng and Mjolnir), and the latter may have been the catalyst for a tsunami that dwarfed the recent event in Japan (see also the simulation for the tsunami generated by the Chicxulub impactor below).

Glimsdal et al. 2007 note, “it is clear that both the geological consequences and the tsunami of an impact of a large asteroid are orders off magnitude larger than those of even the largest earthquakes recorded.”

However, in the CNN interview Neil deGrasse Tyson remarked that we’ll presumably identify the larger impactors ahead of time, giving humanity the opportunity to enact a plan to (hopefully) deal with the matter.   Yet he added that often we’re unable to identify smaller objects in advance, and that is problematic.  The meteor that exploded over the Urals a few weeks ago is an example.

Sketch of the ensuing Tsunami caused by an impactor from Space (image credit: binouse49/devianart).
An artist’s sketch of a tsunami which can be potentially generated by an asteroid/comet impactor (image credit: binouse49/deviantart).

In recent human history the Tunguska event, and the asteroid that recently exploded over Chelyabinsk, are reminders of the havoc that even smaller-sized objects can cause. The Tunguska event is presumed to be a meteor that exploded in 1908 over a remote forested area in Siberia, and was sufficiently powerful to topple millions of trees (see image below).  Had the event occurred over a city it may have caused numerous fatalities.

Mark Boslough, a scientist who studied Tunguska noted, “That such a small object can do this kind of destruction suggests that smaller asteroids are something to consider … such collisions are not as improbable as we believed. We should be making more efforts at detecting the smaller ones than we have till now.” 

Neil deGrasse Tyson hinted that humanity was rather lucky that the recent Russian fireball exploded about 20 miles up in the atmosphere, as its energy content was about 30 times larger than the Hiroshima explosion.  It should be noted that the potential negative outcome from smaller impactors increases in concert with an increasing human population.
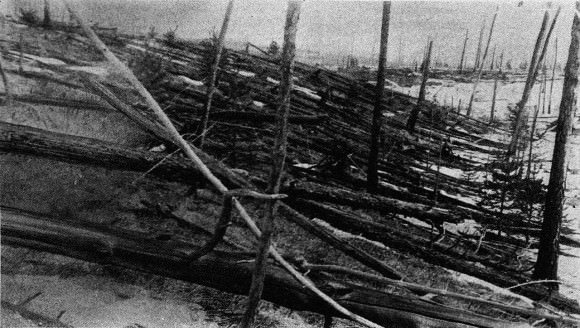
The Tungunska impactor is thought to have felled millions of trees in Siberia in 1908 (image credit: Kulik).
In 1908 the Tunguska impactor toppled millions of trees in a rather remote part of Siberia (image credit: Kulik).  Had the object exploded over a city, the effects may have been catastrophic.

So how often do large bodies strike Earth, and is the next catastrophic impactor eminent? Do such events happen on a periodic basis? Scientists have been debating those questions and no consensus has emerged. Certain researchers advocate that large impactors (leaving craters greater than 35 km) strike Earth with a period of approximately 26-35 million years.

The putative periodicity  (i.e., the Shiva hypothesis) is often linked to the Sun’s vertical oscillations through the plane of the Milky Way as it revolves around the Galaxy, although that scenario is likewise debated (as is many of the assertions put forth in this article). The Sun’s motion through the denser part of the Galactic plane is believed to trigger a comet shower from the Oort Cloud. The Oort Cloud is theorized to be a halo of loosely-bound comets that encompasses the periphery of the Solar System. Essentially, there exists a main belt of asteroids between Mars and Jupiter, a belt of comets and icy bodies located beyond Neptune called the Kuiper belt, and then the Oort Cloud.  A lower-mass companion to the Sun was likewise considered as a perturbing source of Oort Cloud comets (“The Nemesis Affair” by D. Raup).
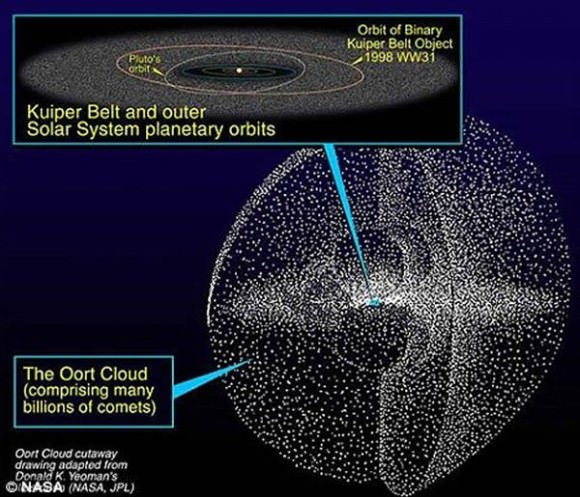
A belt of comets called the Oort Cloud is theorized to encircle the Solar system  (image credit: NASA/JPL).
A halo of comets designated the Oort Cloud is theorized to encircle the periphery of the Solar System, and reputedly acts as a reservoir for objects that may become terrestrial impactors (image credit: NASA/JPL).

The aforementioned theory pertains principally to periodic comets showers, however, what mechanism can explain how asteroids exit their otherwise benign orbits in the belt and enter the inner solar system as Earth-crossers? One potential (stochastic) scenario is that asteroids are ejected from the belt via interactions with the planets through orbital resonances.  Evidence for that scenario is present in the image below, which shows that regions in the belt coincident with certain resonances are nearly depleted of asteroids.  A similar trend is seen in the distribution of icy bodies in the Kuiper belt, where Neptune (rather than say Mars or Jupiter) may be the principal scattering body.  Note that even asteroids/comets not initially near a resonance can migrate into one by various means (e.g., the Yarkovsky effect).

Indeed, if an asteroid in the belt were to breakup (e.g., collision) near a resonance, it would send numerous projectiles streaming into the inner solar system.  That may help partly explain the potential presence of asteroid showers (e.g., the Boltysh and Chicxulub craters both date to near 65 million years ago).   In 2007, a team argued that the asteroid which helped end the reign of the Dinosaurs 65 million years ago entered an Earth-crossing orbit via resonances. Furthermore, they noted that asteroid 298 Baptistina is a fragment of that Dinosaur exterminator, and it can be viewed in the present orbiting ~2 AU from the Sun.  The team’s specific assertions are being debated, however perhaps more importantly: the underlying transport mechanism that delivers asteroids from the belt into Earth-crossing orbits appears well-supported by the evidence.
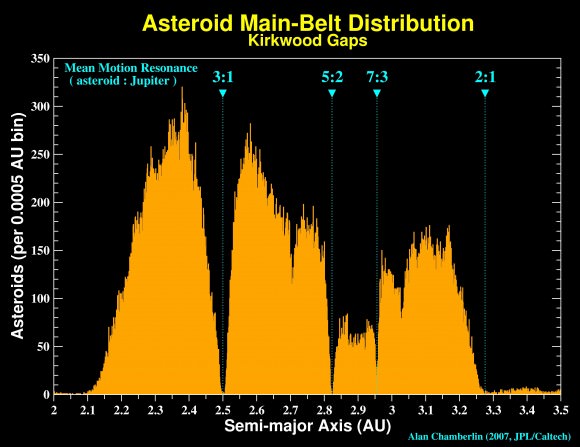
Kirkwood Gaps, histogram of asteroids as a function of their average distance from the Sun.  Regions deplete of asteroids are called Kirkwood Gaps, and those bodies may have been escavated from the main belt owing to orbital resonances (image credit: Alan Chamberlain, JPL/Caltech).
A histogram featuring the number of asteroids as a function of their average distance from the Sun. Regions depleted of asteroids are often coincident with orbital resonances, the latter being a mechanism by which objects in the belt can be scattered into enter Earth-crossing orbits (image credit: Alan Chamberlain, JPL/Caltech).

Thus it appears that the terrestrial impact record may be tied to periodic and random phenomena, and comet/asteroid showers can stem from both.  However, reconstructing that terrestrial impact record is rather difficult as Earth is geologically active (by comparison to the present Moon where craters from the past are typically well preserved).  Thus smaller and older impactors are undersampled.  The impact record is also incomplete since a sizable fraction of impactors strike the ocean.  Nevertheless, an estimated frequency curve for terrestrial impacts as deduced by Rampino and Haggerty 1996 is reproduced below.  Note that there is considerable uncertainty in such determinations, and the y-axis in the figure highlights the “Typical Impact Interval”.
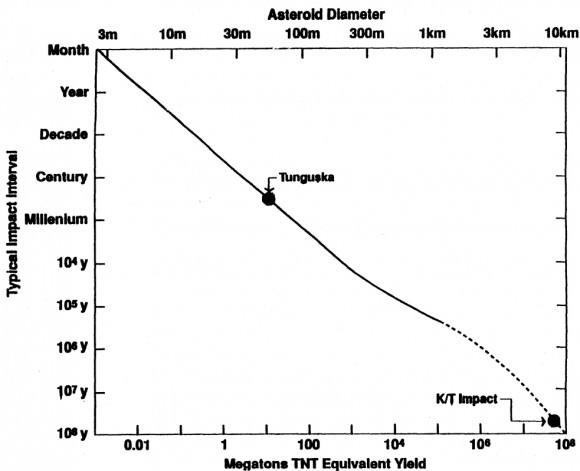
Estimated frequency of impacts as a function of age, diameter, and energy yield.  Results assume an impact speed of 20 km/s and density of 3 g/cm^3 (image credit: Fig. 2 from Rampino & Haggerty 1996, NASA ADS/Springer).
Estimated frequency of impactors as a function of diameter, energy yield, and typical impact interval. Results assume an impact speed of 20 km/s and density of 3 g/cm^3 (image credit: Fig. 2 from Rampino and Haggerty 1996, NASA ADS/Springer).

In sum, as noted by Eugene Shoemaker, large objects do indeed fall out of the sky and cause damage. It is unclear when in the near or distant future humanity will be forced to rise to the challenge and counter an incoming larger impactor, or again deal with the consequences of a smaller impactor that went undetected and caused human injuries (the estimated probabilities aren’t reassuring given their uncertainty and what’s in jeopardy).  Humanity’s technological progress and scientific research must continue unabated (and even accelerated), thereby affording us the tools to better tackle the described situation when it arises.

Is discussion of this topic fear mongering and alarmist in nature? The answer should be obvious given the fireball explosion that happened recently over the Ural mountains, the Tunguska event, and past impactors.  Given the stakes excessive vigilance is warranted.

Fareed Zakharia’s discussion with Neil deGrasse Tyson is below.

The interested reader desiring additional information will find the following pertinent: the Earth Impact Database, Hildebrand 1993Rampino and Haggerty 1996Stothers et al. 2006, Glimsdal et al. 2007Bottke et al. 2007Jetsu 2011, G. Keller’s discussion concerning the end of the Dinosaurs, “T. rex and the Crater of Doom” by W. Alvarez, “The Nemesis Affair” by D. Raup, “Collision Earth! The Threat from Outer Space” by P. Grego.  **Note that there is a diverse spectrum of opinions on nearly all the topics discussed here, and our understanding is constantly evolving.  There is much research to be done.

NASA: Reaches for New Heights – Greatest Hits Video

Video Caption: At NASA, we’ve been a little busy: landing on Mars, developing new human spacecraft, going to the space station, working with commercial partners, observing the Earth and the Sun, exploring our solar system and understanding our universe. And that’s not even everything.Credit: NASA

Check out this cool action packed video titled “NASA: Reaching for New Heights” – to see NASA’s ‘Greatest Hits’ from the past year

The 4 minute film is a compilation of NASA’s gamut of Robotic Science and Human Spaceflight achievements to explore and understand Planet Earth here at home and the heavens above- ranging from our Solar System and beyond to the Galaxy and the vast expanse of the Universe.

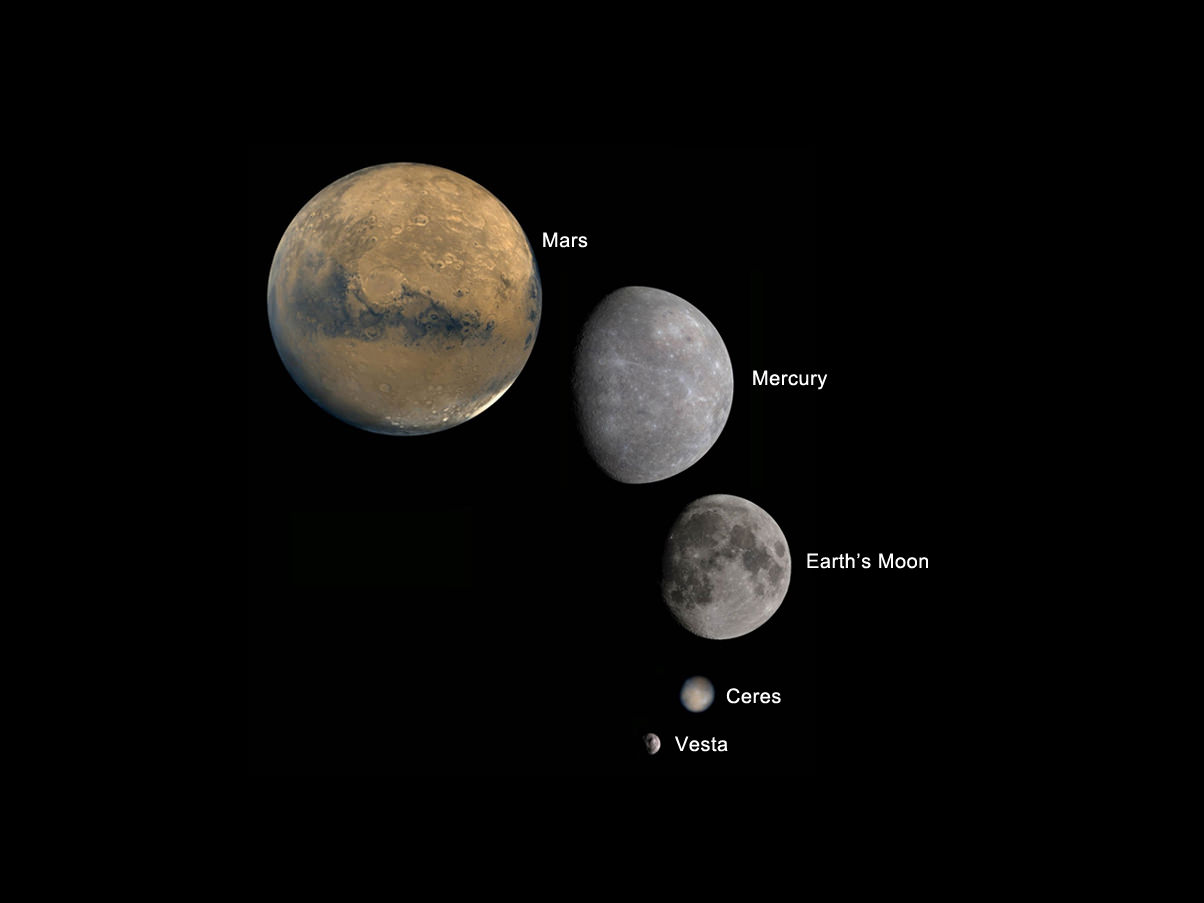
Image caption: Planets and Moons in perspective. Credit: NASA

The missions and programs featured include inspiringly beautiful imagery from : Curiosity, Landsat, Aquarius, GRACE, NuSTAR, GRAIL, Dawn at Asteroid Vesta, SDO, X-48C Amelia, Orion, SLS, Apollo, SpaceX, Sierra Nevada Dream Chaser, Boeing CST-100, Commercial Crew, Hurricane Sandy from the ISS, Robonaut and more !

And even more space exploration thrills are coming in 2013 !

Ken Kremer

IMG_3760a_SpaceX launch 22 May 2012

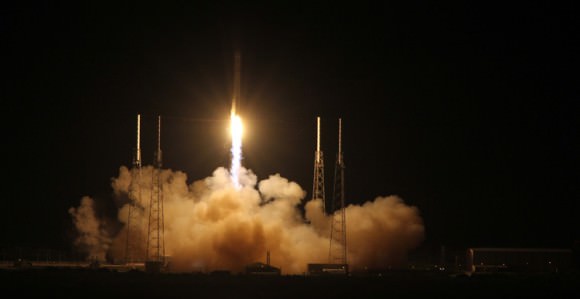
Image caption: SpaceX Falcon 9 rocket blasts off on May 22, 2012 with Dragon cargo capsule from Space Launch Complex-40 at Cape Canaveral Air Force Station, Fla., on the first commercial mission to the International Space Station. The next launch is set for March 1, 2013. Credit: Ken Kremer

Timelapse of Hurricane Sandy, Satellite Views October 23-31, 2012

Here’s a complete animation of Hurricane Sandy from October 23-31, as seen by GOES-13, a geosynchronous satellite that is in orbit nearly 36,000 km (23,000 miles) above Earth. This huge storm was costly in terms of death and destruction. The death toll currently stands at 160 (88 in the U.S., 54 in Haiti, 11 in Cuba), with damage estimates ranging from $10 – $55 billion.

Below is a timelapse animation which shows the full hemisphere view from GOES-13, showing the development of Hurricane Sandy as it begins over Central America and begins its path up through the Caribbean and the east coast of the U.S.

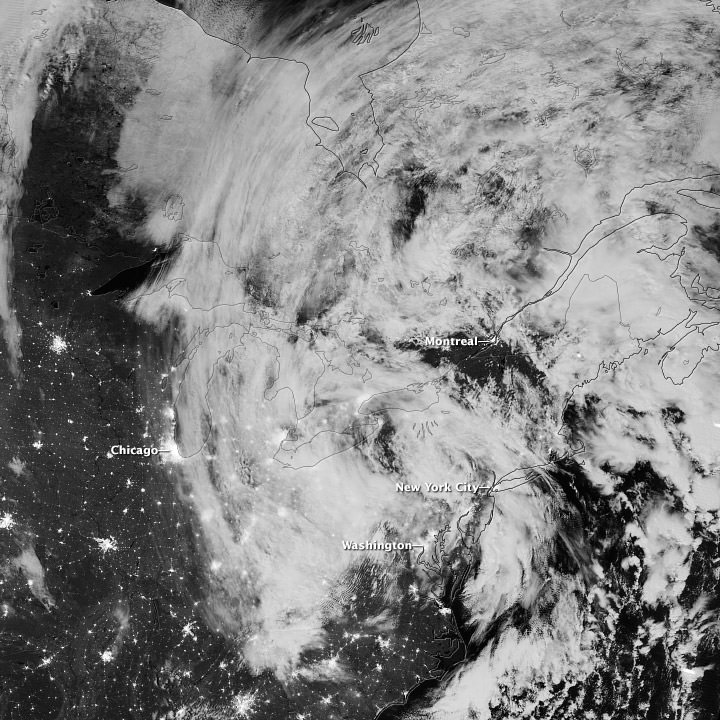
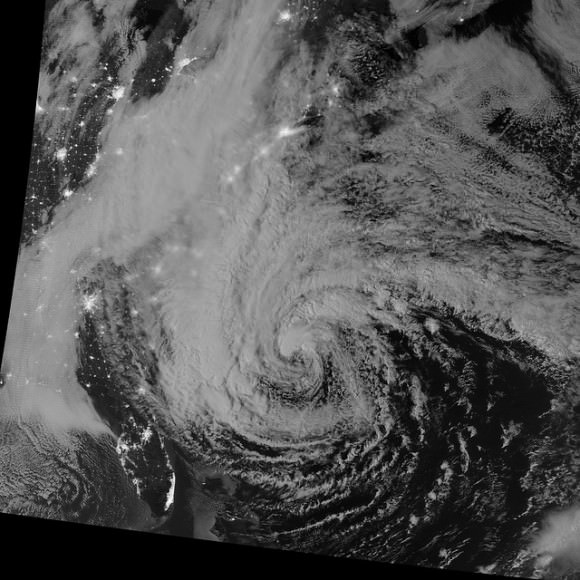
The Visible Infrared Imaging Radiometer Suite (VIIRS) on the Suomi NPP satellite acquired this image of the storm around 3:13 a.m. Eastern Daylight Time (7:13 Universal Time) on October 31. Credit: NASA/NOAA

This image from the Suomi NPP satellite shows remnants of Hurricane Sandy as it moved inland in the early morning hours of October 31, 2012. As the center of the system passed Pennsylvania, its maximum sustained winds were 40 miles (64 kilometers) per hour. This image is from the “day-night band” on VIIRS, which detects light wavelengths from green to near-infrared. The Moon lit the tops of the clouds.

Sandy’s clouds stretched from Hudson Bay to Chicago and Washington. Clusters of lights gave away the locations of some cities throughout the region; but along the East Coast, clouds mostly obscured the lights, many of which were blacked out due to the storm. On October 31, the Wall Street Journal reported that several million customers in multiple states were without electricity.

You can see more satellite images of Sandy’s traverse at the NASA Earth Observatory website.

Satellites Provide 3-D Views and More of Hurricane Sandy

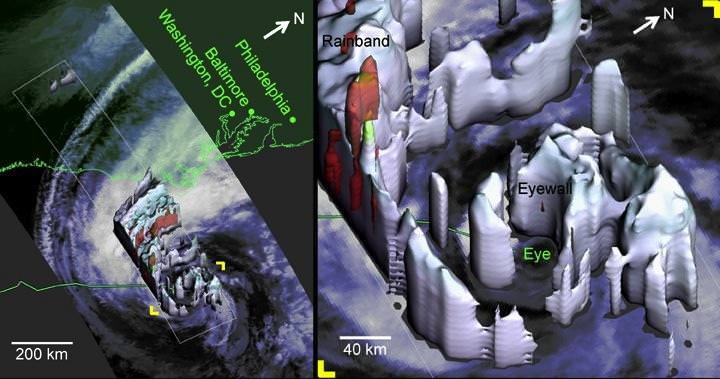
Hurricane Sandy as viewed by the TRMM Precipitation Radar at 2:20 EDT on Oct. 28, 2012. Credit: NASA

Satellite imagery and data has been invaluable in predicting the path and intensity of storms like Hurricane Sandy. Satellites like NASA’s Tropical Rainfall Measuring Mission (TRMM) can measure rainfall rates and cloud heights in tropical cyclones, and was used to create a 3-D image, above, to allow forecasters to look inside the hurricane, and predict fairly spot-on what locations would be affected the worst. There’s even a 3-D video view from the CloudSat satellite, and much more, including a stunning wind map, and this round-up from JPL of various satellite views of the storm. You can also see a slideshow of NASA satellite images and videos on the NASA Goddard Flickr site.

This exemplifies just one reason why space exploration is important, and why people are maybe now starting to realize how our failure to plan ahead and invest in weather satellites may become a problem. Without those eyes in the sky we are blind to the minute-to-minute and hour-to-hour development of storms and weather, not to mention overall study of the climate.

Below is a stunning high-speed satellite view from the GOES-14 satellite:

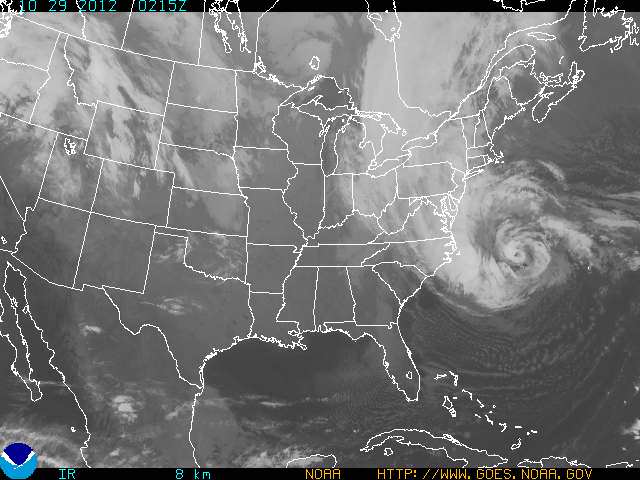
Focusing just on the area of the storm, the GOES-14 Super Rapid Scan Operation (SRSO) captures infrared and visible data every minute and relays that information to forecasters on the ground. This animation shows the GOES-14 SRSO for October 29, 2012 as Hurricane Sandy approached the U.S. coastline.

Video: Hurricane Sandy Seen by Space Station Astronauts

Here’s the view of Hurricane Sandy from an altitude of 254 statute miles from external cameras on the International Space Station. This video was shot as the ISS flew over the US’s eastern seaboard at 12:52 Eastern time October 29, 2012. Sandy has yet to officially make landfall, but the huge storm is already battering a region that makes up the most densely populated area of the US. The combination of three different storms has caused it to be dubbed as “Frankenstorm,” but it could turn into a “Blizzicane” as a winter storm merges with Sandy. The hurricane itself is strengthening as it barrels toward a landfall along the New Jersey coastline.

Below is video of the ISS pass at 11:16 a.m on Monday:

At the time of the flyover, Sandy was located 420 km (260 miles) south-southeast of New York City, moving north-northwest at 18 miles an hour with winds measured at 90 miles an hour as a Category 1 hurricane, according to the National Hurricane Center.

The huge slow moving combination of storms stretches about 1,600 km (1,000 miles) from north to south and significant impacts of storm surge and flooding are expected, with at least 7-10 inches of rain. This comes along with a snow advisory in some regions, creating a “Blizzicane” in the mountains of West Virgina, with 2-4 feet of snow predicted.

Forecasters are predicting this to be a multi-billion dollar storm disaster.

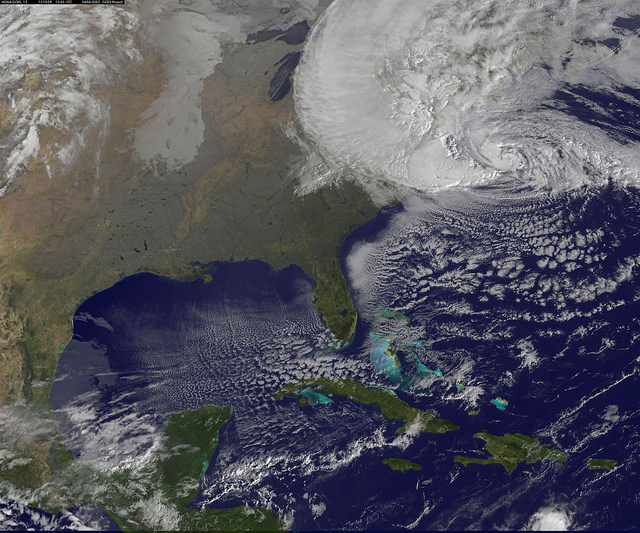
Here are some recent images of the storm:

Satellite View of Hurricane Sandy on Oct. 29 at 9:10 EDT by NOAA’s GOES-13 satellite.

Hurricane Sandy Viewed in the Dark of Night. Image acquired by the Visible Infrared Imaging Radiometer Suite (VIIRS) on the Suomi NPP satellite around 2:42 a.m. Eastern Daylight Time (06:42 Universal Time) on October 28, 2012.

For more images, see the Goddard Space Flight Center’s Flickr page.

Incredible Video of Sandy’s Swirling Progression

Just released, this mesmerizing animation was created by Kevin Ward from images acquired by NOAA’s GOES-O/14 satellite. It shows the progression of Hurricane Sandy, currently a Category 1 hurricane off the coast of the eastern U.S. that’s poised to make a devastating impact when its heavy rains, winds and storm surges strike the shores of many major metropolitan coastal areas — including New York City and Washington, D.C.

Nearly 12 hours of time are compressed into 30 seconds, revealing the evolution of Sandy as it churned over the Atlantic on Sunday, October 28.

 From NASA’s Earth Observatory’s YouTube page:
This time-lapse animation shows Hurricane Sandy from the vantage point of geostationary orbit—35,800 km (22,300 miles) above the Earth. The animation shows Sandy on October 28, 2012, from 7:15 to 6:26 EDT. Light from the changing angles of the sun highlight the structure of the clouds. The images were collected by NOAA’s GOES-14 satellite. The “super rapid scan” images — one every minute from 7:15 a.m. until 6:30 p.m. EDT — reveal details of the storm’s motion.

Launched by NASA as GOES-O on June 27, 2009, GOES-14 is now under control by the NOAA, keeping an eye on the mid-Atlantic region from a geostationary position approximately 22,300 miles (35,800 km) above the Earth.

Sandy is expected to bring up to 10 inches of rain into New York, with a surge possible over 6 feet above high tide and wind gusts in excess of 75 mph. Once the hurricane moves inland there could be millions left without electricity. States of emergency have already been declared in many areas within Sandy’s projected path.

Read: Hurricane Sandy Barreling to Eastern Seaboard, Menacing Millions

Currently Sandy is off the coast of North Carolina (at the time of this writing, 34.5 N / 70.5 W) moving northeast at 14 mph (22  km/h) with a low pressure of 950 mb… that’s as low or lower than some of the most powerful storms to hit the eastern U.S. over the past century, including the “perfect storm” of 1991 (a low system which also struck at Halloween) and the deadly 1938 “Great Hurricane”, which devastated coastal regions all across southern New England.

Stay up to date on Hurricane Sandy’s progress on the NOAA page here, with the latest public advisories being posted here.

NASA animation by Kevin Ward, using images from NOAA and the University of Wisconsin-Madison Cooperative Institute for Meteorological Satellite Studies.

Hurricane Sandy Barreling to Eastern Seaboard Menacing Millions

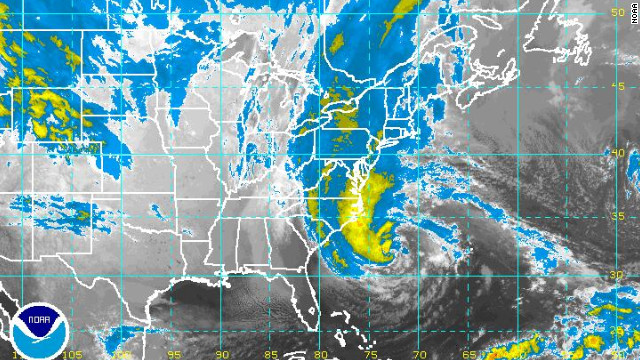
Image Caption: NOAA Satellite image of Hurricane Sandy threatening millions of people living along US Eastern Seaboard. See NASA satellite imagery below. Credit: NOAA

Hurricane Sandy, a powerfully monstrous and unprecedented late season storm, is barreling mightily towards the US Eastern Seaboard, menacing tens of millions of residents living in the path of her sustained destructive winds, rains and life threatening storm surges.

Mandatory mass evacuations involving hundreds of thousands of people are already in progress in anticipation of a devastating storm strike on Monday (Oct 29).

First effects from Sandy are expected on Sunday night (Oct 28) in the New York/ New Jersey/Connecticut/Pennsylvania metropolitan area. Wind gusts are already exceeding 40 MPH as of Sunday afternoon, here in New Jersey – and steadily worsening.

Coastal Wave heights of 6 to 11 feet are predicted – possibly breaking records.

Public transit systems in New York City/New York, New Jersey, Philadelphia, Pennsylvania, Connecticut and Washington, D.C. have been ordered to shut down later today – Sunday – by the Governors’ of the affected states. Most schools and government offices will also be closed on Monday.

Amtrak has just announced it will shutdown trains in the Northeast Corridor.

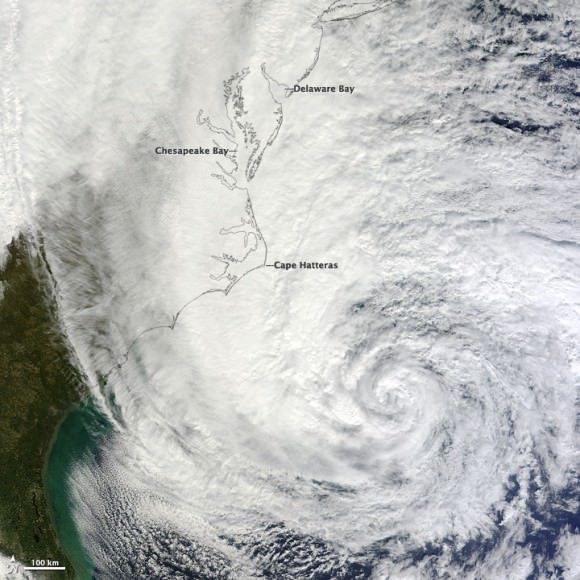
Image Caption: Hurricane Sandy off the southeastern United States was imaged at noon Eastern Daylight Time (16:00 UT) on October 28, 2012, acquired by the Moderate Resolution Imaging Spectroradiometer (MODIS) on NASA’s Terra satellite. Credit: NASA Terra satellite

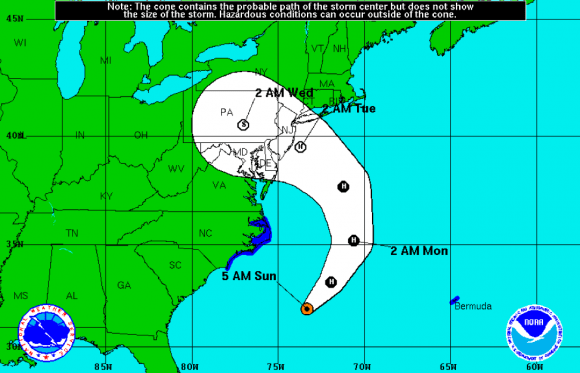
As of Sunday afternoon (Oct. 28) Sandy is predicted to make a dramatic, sharp left hook on Monday morning and most likely will make a violent direct hit slamming somewhere along the Jersey shore which borders from Maryland to New York City and beyond – sending high waves surging into coastal towns and cities overwhelming protective barriers.

Image Caption: Predicted path of Hurricane Sandy. Credit: NOAA

Inland areas will also suffer widespread destruction and power losses as Sandy slowly moves onshore and lingers over an extraordinarily wide path spanning several hundred miles in diameter.

Heavy rains and hurricane force wind gusts will soak the ground, taking down trees and power lines. Leaves may block storm drains.

Hurricane Sandy is currently classified as a Category 1 Hurricane. Its effects could be catastrophic and should not be taken lightly.

Making matters even worse, Sandy will hit during a full moon and the astronomical highest tides.

The National Hurricane Service warns that major flooding effecting millions of homes and businesses is expected along the US East Coast stretching from North Carolina to New England.

Millions and millions of people have more than a 50% chance of losing power.

Local power companies learned hard lessons from the devastating effects of Hurricane Irene just 1 year ago, which caused widespread and serious misery, flooding and deaths throughout the Northeast. Some people went without power for more than 2 weeks in the aftermath of Hurricane Irene in 2011. This author lost power for several days and now we are in for another direct hit.

Additional Power crews have been called in from across the country and prepositioned as a precautionary measure. NEVER touch any downed power lines.

States of Emergency have been declared in 9 eastern States from North Carolina to Maine as well as the District of Columbia.

Mandatory evacuations of low lying coastal areas have been ordered by the Governors’ of New Jersey, New York and Connecticut. State Shelters are being opened now.

Ocean wave heights of 20 to 50 feet have already been reported near the Hurricane’s eye.

Even the US Presidential election is being affected by Hurricane Sandy. Campaign events by both candidates Obama and Romney have been cancelled in several key battleground states. It is possible that polling stations may lose power – and the consequences are unknown on the closely contested election that could hinge on a handful of votes !

Stay tuned to NOAA, NASA and local and national news for continuing Hurricane updates.

Ken Kremer

Satellite Views: Will Hurricane Sandy Turn into ‘Frankenstorm’?

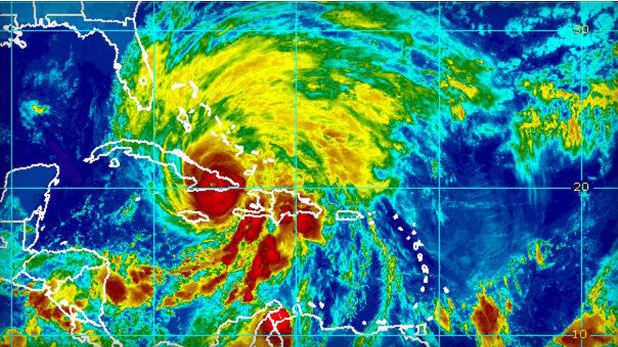
Hurricane Sandy made landfall on Cuba early Thursday Oct. 25, 2012 as strong Category 2. Credit: NOAA/National Hurricane Center

Meteorologists keeping an eye on Hurricane Sandy say the storm threatens to move up along the east coast of the United States and could mix with a wintery storm coming from the west to form a monster storm that has been informally dubbed “Frankenstorm.” The hurricane could reach the US coast by this weekend and when the two storms collide, it could continue to pound the eastern seaboard well into the week of Halloween.

Hurricane Sandy is now in the Caribbean as a Category 2 storm coastal areas from Florida to Maine will feel some effects, forecasters predict. The mix of the two storms could cause weather problems in the Washington DC area to New York city, some of the most populous areas of the US.

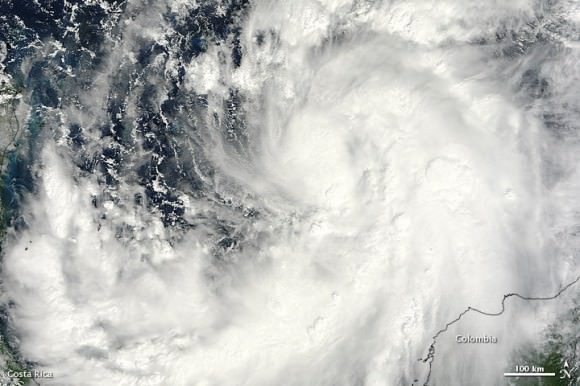
Satellite image of then Tropical Storm Sandy taken on October 23, 2012 as it was over the Caribbean Sea taken by the Moderate Resolution Imaging Spectroradiometer (MODIS) on NASA’s Terra satellite. NASA image courtesy Jeff Schmaltz, LANCE MODIS Rapid Response Team at NASA GSFC.

Forecasters are saying this could be a major mess, with a 90 percent chance that the East will get steady gale-force winds, heavy rain, flooding and maybe snow.

While no one can positively predict what Hurricane Sandy will do and how the two storms might mesh into one monster storm, the Washington Post’s Capital Weather Gang has outlined the possible scenarios from worst case to where the storms collide and remained parked over the region for days, to best case, where Sandy heads to the northeast sparing the East Coast from a direct hit.

We’ll post additional updated satellite views as they become available.

Sources: NASA Earth Observatory, CBS News, Climate Central
, NOAA

Adrenaline Rush: Standing on the Edge of a Spewing Volcano

This may be the most incredible volcano video ever filmed. Looking like it comes from the latest natural disaster flick, this incredible real footage was captured by Geoff Mackley, Bradley Ambrose, Nathan Berg, who came within 30 meters of the bubbling, spewing lava stream from the mouth the Marum volcano on Ambrym, a volcanic island in the archipelago of Vanuatu, off the east coast of Australia.

“Climbing down to within 30 metres of the lava it was so hot (1150 degrees) that without protection we could stand the heat for 6 seconds before retreating,” writes Mackley on his website. “With a respirator fire and heat resistant suit, [we] could stand on the edge and see the amazing spectacle for over 40 minutes.”

Wow! You can see some incredible images at Mackley’s website.
Continue reading “Adrenaline Rush: Standing on the Edge of a Spewing Volcano”

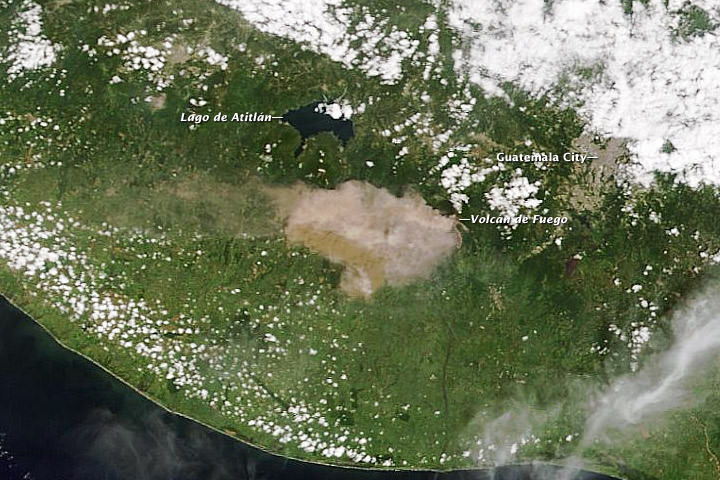
Satellite View of Guatemalan Volcano Erupting

A natural-color image captured the eruption of Volcan de Fuego as it occurred. Credit: NASA/Moderate Resolution Imaging Spectroradiometer (MODIS) aboard the Terra satellite.

One of Central American’s most active volcanos erupted on September 13th, 2012 prompting officials to evacuate 35,000 residents in Guatemala. The Volcan de Fuego, or Fire Volcano, began belching out ash at 10 a.m. local time with ash now falling up to 40 kilometers (25 miles) from the volcano. Residents within 20 kilometers (12 miles) of the volcano were being removed from the area in buses and cars.

According to the Coordinadora Nacional para la Reducción de Desastres (CONRED), the eruption included ash emissions to the west and a 500-meter (2,000-foot) long lava flow. CONRED also warned of pyroclastic flows that could descend the mountain in any direction.

This natural-color image captured the eruption just as it occurred, NASA said. The image was acquired by the Moderate Resolution Imaging Spectroradiometer (MODIS) aboard the Terra satellite.

Thursday’s eruption was the sixth of the year for this volcano and some officials said it may be the biggest.

NASA said they would publish imagery of Guatemala two times per day on the MODIS Rapid Response web site.

Sources: NASA’s Earth Observatory, CNN