This is Actual Science. Crystals at the Earth’s Core Power its Magnetic Field

The Earth's layers, showing the Inner and Outer Core, the Mantle, and Crust. Credit: discovermagazine.com

Whether or not a planet has a magnetic field goes a long way towards determining whether or not it is habitable. Whereas Earth has a strong magnetosphere that protects life from harmful radiation and keeps solar wind from stripping away its atmosphere, planet’s like Mars no longer do. Hence why it went from being a world with a thicker atmosphere and liquid water on its surface to the cold, desiccated place it is today.

For this reason, scientists have long sought to understand what powers Earth’s magnetic field. Until now, the consensus has been that it was the dynamo effect created by Earth’s liquid outer core spinning in the opposite direction of Earth’s rotation. However, new research from the Tokyo Institute of Technology suggests that it may actually be due to the presence of crystallization in the Earth’s core.

The research was conducted by scientists from the Earth-Life Science Institute (ELSI) at Tokyo Tech. According to their study – titled “Crystallization of Silicon Dioxide and Compositional Evolution of the Earth’s Core“, which appeared recently in Nature – the energy that drives the Earth’s magnetic field may have more to do with the chemical composition of the Earth’s core.
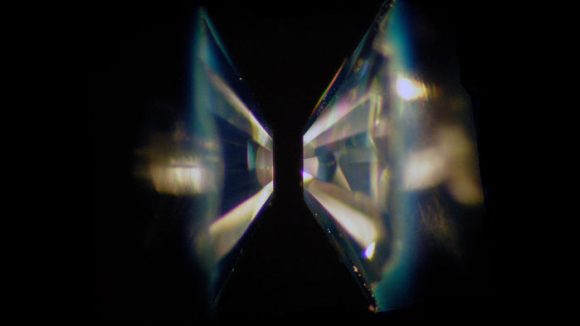
Using a diamond anvil and a laser, researchers at Tokyo Tech subjected silicon and oxygen samples to conditions similar to the Earth’s core. Credit: Sang-Heon Shim/Arizona State University

Of particular concern for the research team was the rate of which Earth’s core cools over geological time – which has been the subject of debate for some time. And for Dr. Kei Hirose – the director of the Earth-Life Science Institute and lead author on the paper – it has been something of a lifelong pursuit. In a 2013 study, he shared research findings that indicated how the Earth’s core may have cooled more significantly than previously thought.

He and his team concluded that since the Earth’s formation (4.5 billion years ago), the core may have cooled by as much as 1,000 °C (1,832 °F). These findings were rather surprising to the Earth sciences community – leading to what one scientists referred to as the “New Core Heat Paradox“. In short, this rate of core cooling would mean that some other source of energy would be required to sustain the Earth’s geomagnetic field.

On top of this, and related to the issue of core-cooling, were some unresolved questions about the chemical composition of the core. As Dr. Kei Hirose said in a Tokyo Tech press release:

“The core is mostly iron and some nickel, but also contains about 10% of light alloys such as silicon, oxygen, sulfur, carbon, hydrogen, and other compounds. We think that many alloys are simultaneously present, but we don’t know the proportion of each candidate element.”
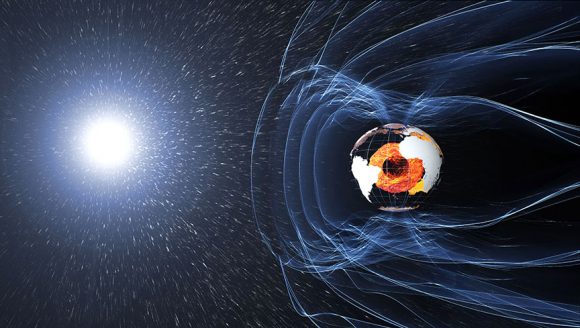
The magnetic field and electric currents in and around Earth generate complex forces that have immeasurable impact on every day life. Credit: ESA/ATG medialab

In order to resolve this, Hirose and his colleagues at ELSI conducted a series of experiments where various alloys were subjected to heat and pressure conditions similar to that in the Earth’s interior. This consisted of using a diamond anvil to squeeze dust-sized alloy samples to simulate high pressure conditions, and then heating them with a laser beam until they reached extreme temperatures.

In the past, research into iron alloys in the core have focused predominantly on either iron-silicon alloys or iron-oxide at high pressures. But for the sake of their experiments, Hirose and his colleagues decided to focus on the combination of silicon and oxygen – which are believed to exist in the outer core – and examining the results with an electron microscope.

What the researchers found was that under conditions of extreme pressure and heat, samples of silicon and oxygen combined to form silicon dioxide crystals – which were similar in composition to mineral quartz found in the Earth’s crust. Ergo, the study showed that the crystallization of silicon dioxide in the outer core would have released enough buoyancy to power core convection and a dynamo effect from as early on as the Hadean eon onward.

As John Hernlund, also a member of ELSI and a co-author of the study, explained:

“This result proved important for understanding the energetics and evolution of the core. We were excited because our calculations showed that crystallization of silicon dioxide crystals from the core could provide an immense new energy source for powering the Earth’s magnetic field.”
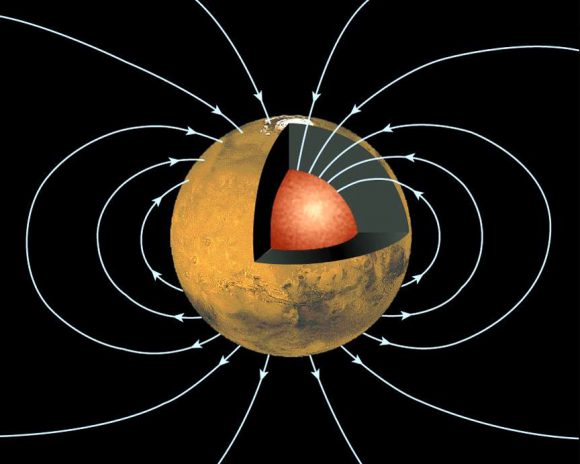
Cross-section of Mars revealing its inner core. Mars must have one day had such a field, but the energy source that powered it has since shut down. Credit: NASA/JPL/GSFC

This study not only provides evidence to help resolve the so-called “New Core Heat Paradox”, it also may help advance our understanding of what conditions were like during the formation of Earth and the early Solar System. Basically, if silicon and oxygen form crystal of silicon dioxide in the outer core over time, then sooner or later, the process will stop once the core runs out of these elements.

When that happens, we can expect Earth’s magnetic field will suffer, which will have drastic implications for life on Earth. It also helps to put constraints on the concentrations of silicon and oxygen that were present in the core when the Earth first formed, which could go a long way towards informing our theories about Solar System formation.

What’s more, this research may help geophysicists to determine how and when other planets (like Mars, Venus and Mercury) still had magnetic fields (and possibly lead to ideas of how they could be powered up again). It could even help exoplanet-hunting science teams determine which exoplanets have magnetospheres, which would allow us to find out which extra-solar worlds could be habitable.

Further Reading: Tokyo Tech News, Nature.

SETI Has Already Tried Listening to TRAPPIST-1 for Aliens

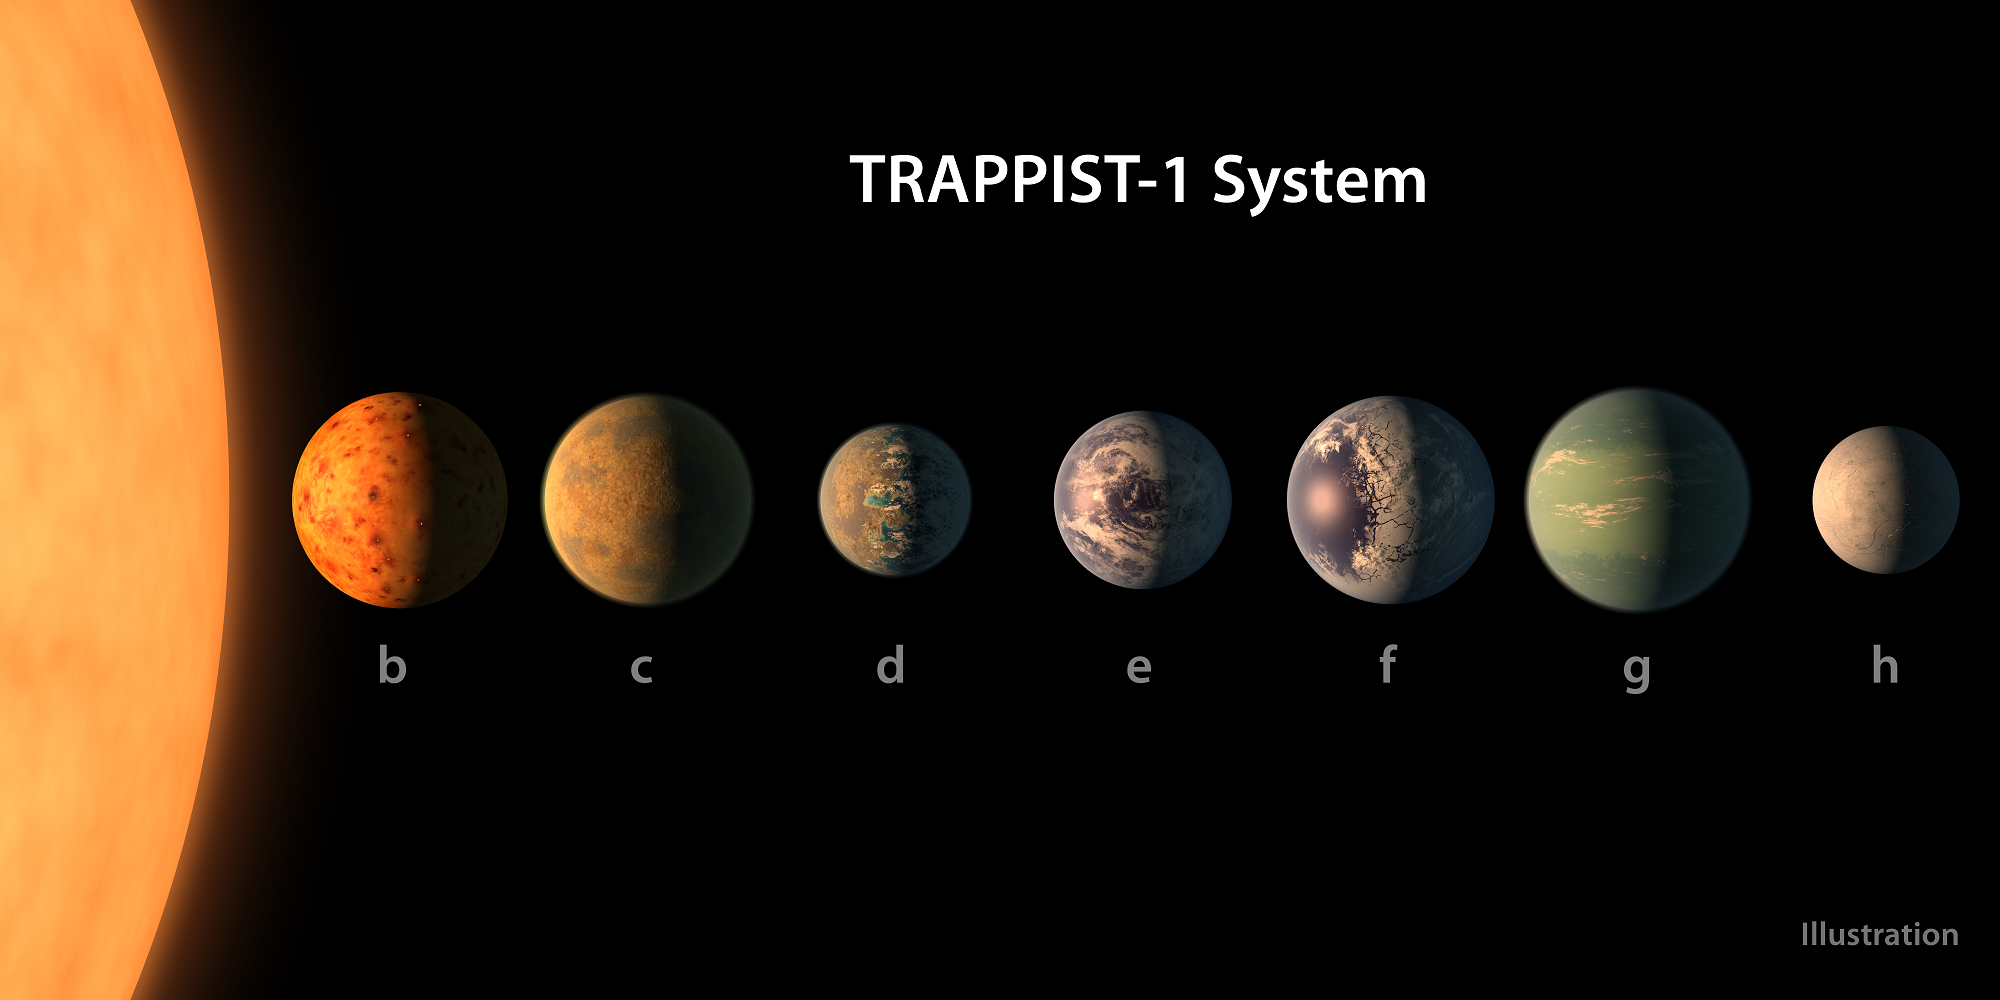
This artist's concept shows what each of the TRAPPIST-1 planets may look like, based on available data about their sizes, masses and orbital distances. Credits: NASA/JPL-Caltech

The Trappist-1 system has been featured in the news quite a bit lately. In May of 2016, it appeared in the headlines after researchers announced the discovery of three exoplanets orbiting around the red dwarf star. And then there was the news earlier this week of how follow-up examinations from ground-based telescopes and the Spitzer Space Telescope revealed that there were actually seven planets in this system.

And now it seems that there is more news to be had from this star system. As it turns out, the Search for Extraterrestrial Intelligence (SETI) Institute was already monitoring this system with their Allen Telescope Array (ATA), looking for signs of life even before the multi-planet system was announced. And while the survey did not detect any telltale signs of radio traffic, further surveys are expected.

Given its proximity to our own Solar System, and the fact that this system contains seven planets that are similar in size and mass to Earth, it is both tempting and plausible to think that life could be flourishing in the TRAPPIST-1 system. As Seth Shostak, a Senior Astronomer at SETI, explained:

“[T]he opportunities for life in the Trappist 1 system make our own solar system look fourth-rate.  And if even a single planet eventually produced technically competent beings, that species could quickly disperse its kind to all the rest… Typical travel time between worlds in the Trappist 1 system, even assuming rockets no speedier than those built by NASA, would be pleasantly short.  Our best spacecraft could take you to Mars in 6 months.  To shuttle between neighboring Trappist planets would be a weekend junket.”

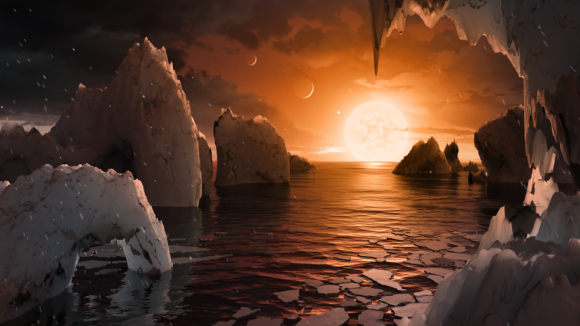
Illustration showing the possible surface of TRAPPIST-1f, one of the newly discovered planets in the TRAPPIST-1 system. Credits: NASA/JPL-Caltech

Little wonder then why SETI has been using their Allen Telescope Array to monitor the system ever since exoplanets were first announced there. Located at the Hat Creek Radio Observatory in northern California (northeast of San Francisco), the ATA is what is known as a “Large Number of Small Dishes” (LNSD) array – which is a new trend in radio astronomy.

Like other LNSD arrays – such as the proposed Square Kilometer Array currently being built in Australia and South Africa – the concept calls for the deployment of many smaller dishes over a large surface area, rather than a single large dish. Plans for the array began back in 1997, when the SETI Institute convened a workshop to discuss the future of the Institute and its search strategies.

The final report of the workshop, titled “SETI 2020“, laid out a plan for the creation of a new telescope array. This array was referred to as the One Hectare Telescope at the time, since the plan called for a LNSD encompassing an area measuring 10,000 m² (one hectare). The SETI Institute began developing the project in conjunction with the Radio Astronomy Laboratory (RAL) at the UC Berkeley.

In 2001, they secured a $11.5 million donation from the Paul G. Allen Family Foundation, which was established by Microsoft co-founder Paul Allen. In 2007, the first phase of construction was completed and the ATA finally became operational on October 11th, 2007, with 42 antennas (ATA-42). Since that time, Allen has committed to an additional $13.5 million in funding for a second phase of expansion (hence why it bears his name).

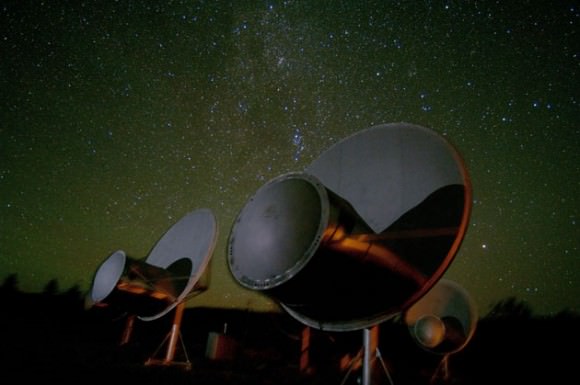
A portion of the Allen Telescope Array. (Credit: Seth Shostak/The SETI Institute. Used with permission)

Compared to large, single dish-arrays, smaller dish-arrays are more cost-effective because they can be upgraded simply by adding more dishes. The ATA is also less expensive since it relies on commercial technology originally developed for the television market, as well as receiver and cryogenic technologies developed for radio communication and cell phones.

It also uses programmable chips and software for signal processing, which allows for rapid integration whenever new technology becomes available. As such, the array is well suited to running simultaneous surveys at centimeter wavelengths. As of 2016, the SETI Institute has performed observations with the ATA for 12 hour periods (from 6 pm and 6 am), seven days a week.

And last year, the array was aimed towards TRAPPIST-1, where it conducted a survey scanning ten billion radio channels in search of signals. Naturally, the idea that a radio signal would be emanating from this system, and one which the ATA could pick up, might seem like a bit of a longshot. But in fact, both the infrastructure and energy requirements would not be beyond a species who’s technical advancement is commensurate with our own.

“Assuming that the putative inhabitants of this solar system can use a transmitting antenna as large as the 500 meter FAST radio telescope in China to beam their messages our way, then the Allen Array could have found a signal if the aliens use a transmitter with 100 kilowatts of power or more,” said Shostak. “This is only about ten times as energetic as the radar down at your local airport.”

A plot of diameter versus the amount of sunlight hitting the planets in the TRAPPIST-1 system, scaled by the size of the Earth and the amount of sunlight hitting the Earth. Credit: F. Marchis/H. Marchis

So far, nothing has been picked up from this crowded system. But the SETI Institute is not finished and future surveys are already in the works. If there is a thriving, technologically-advanced civilization in this system (and they know their way around a radio antenna), surely there will be signs soon enough.

And regardless, the discovery of seven planets in the TRAPPIST-1 system is very exciting because it demonstrates just how plentiful systems that could support life are in our Universe. Not only does this system have three planets orbiting within its habitable zone (all of which are similar in size and mass to Earth), but the fact that they orbit a red dwarf star is very encouraging.

These stars are the most common in our Universe, making up 70% of stars in our galaxy, and up to 90% in elliptical galaxies. They are also very stable, remaining in their Main Sequence phase for up to 10 trillion years. Last, but not least, astronomers believe that 20 out of 30 nearest stars to our Solar System are red dwarfs. Lots of opportunities to find life within a few dozen light years!

“[W]hether or not Trappist 1 has inhabitants, its discovery has underlined the growing conviction that the Universe is replete with real estate on which biology could both arise and flourish,’ says Shostak. “If you still think the rest of the universe is sterile, you are surely singular, and probably wrong.”

Further Reading: SETI

Wow, Mars Sure Can Be Pretty

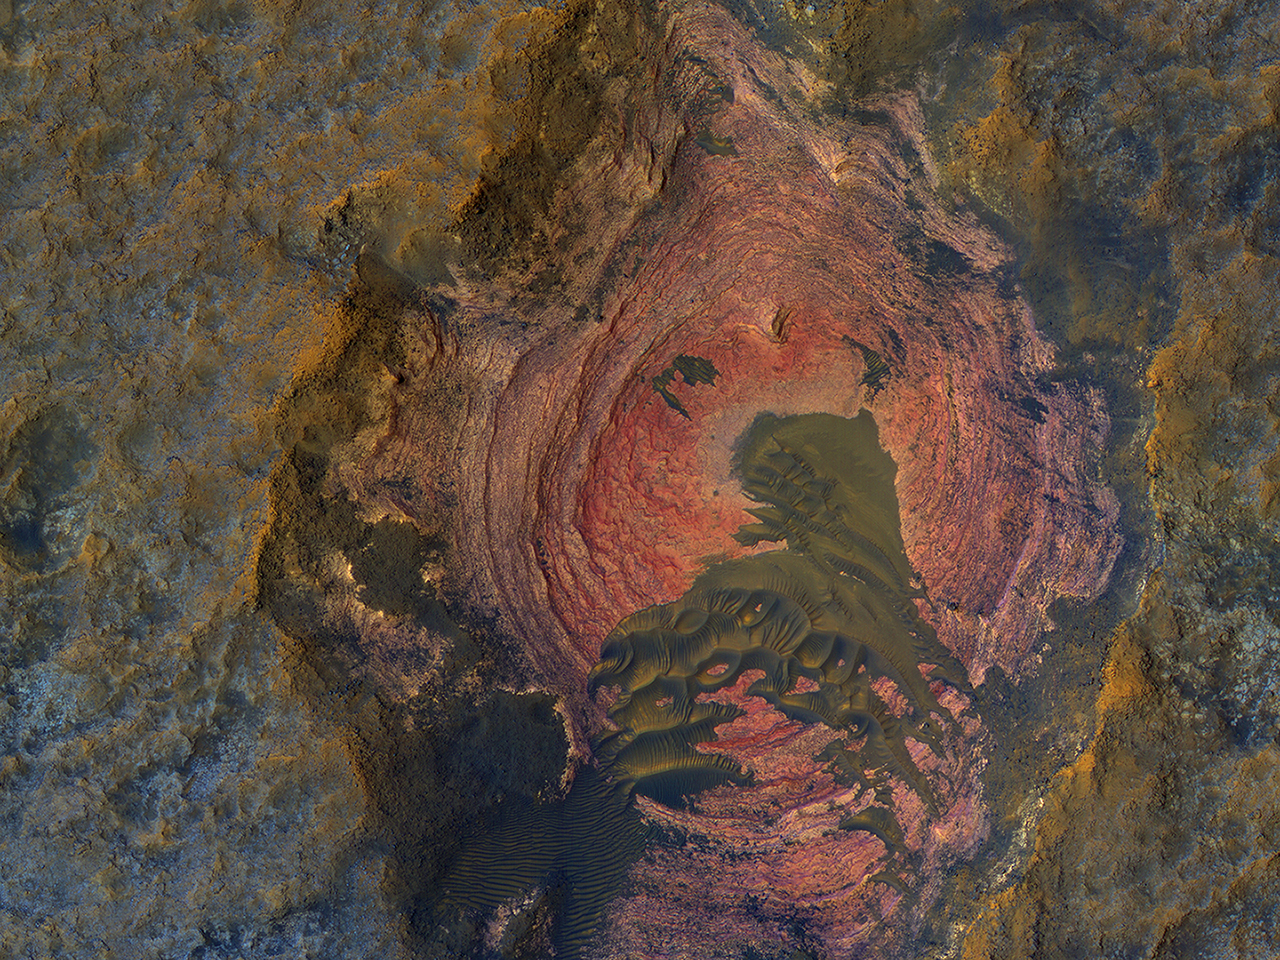
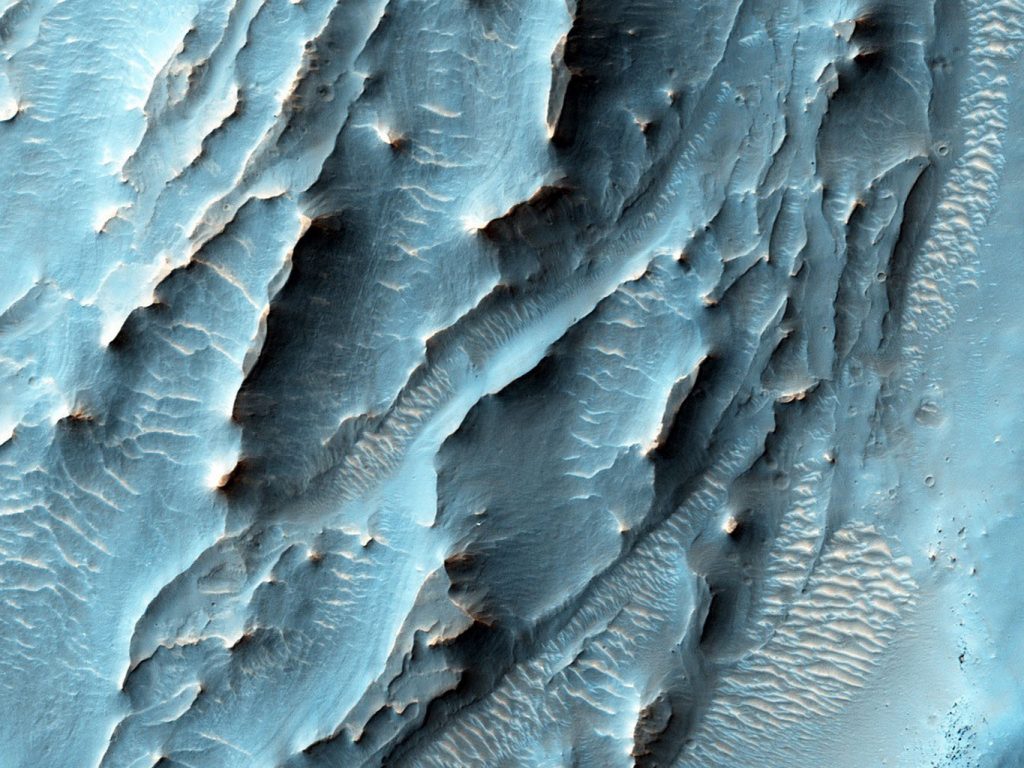
This colorful image of Martian bedrock, punctuated in the center by dunes, is courtesy of the HiRise camera aboard NASA's Mars Reconnaissance Orbiter. Image: NASA/JPL/University of Arizona

For a supposedly dead world, Mars sure provides a lot of eye candy. The High Resolution Imaging Science Experiment (HiRise) aboard NASA’s Mars Reconnaissance Orbiter (MRO) is our candy store for stunning images of Mars. Recently, HiRise gave us this stunning image (above) of colorful, layered bedrock on the surface of Mars. Notice the dunes in the center. The colors are enhanced, which makes the images more useful scientifically, but it’s still amazing.

HiRise has done it before, of course. It’s keen vision has fed us a steady stream of downright jaw-dropping images of Elon Musk’s favorite planet. Check out this image of Gale Crater taken by HiRise to celebrate its 10 year anniversary orbiting Mars. This image was captured in March 2016.

HiRise captured this image of unusual textures on the floor of the Gale Crater, the same crater where the Curiosity rover is working. Image: NASA/JPL-Caltech/Univ. of Arizona

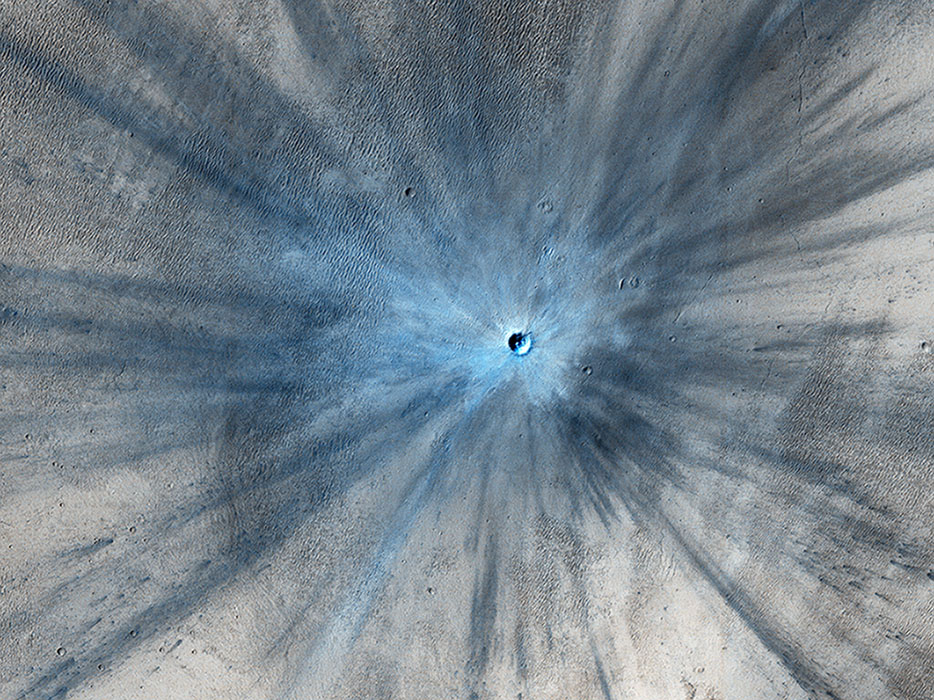
The MRO is approaching its 11 year anniversary around Mars. It has completed over 45,000 orbits and has taken over 216,000 images. The next image is of a fresh impact crater on the Martian surface that struck the planet sometime between July 2010 and May 2012. The impact was in a dusty area, and in this color-enhanced image the fresh crater looks blue because the impact removed the red dust.

This color-enhanced image of a fresh Martian crater was captured by the HiRise camera. Image: NASA/JPL-Caltech/Univ. of Arizona

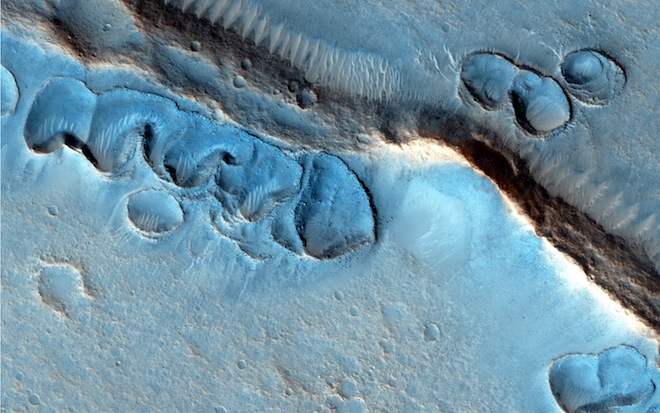
These landforms on the surface of Mars are still a bit of a mystery. It’s possible that they formed in the presence of an ancient Martian ocean, or perhaps glaciers. Whatever the case, they are mesmerizing to look at.

These odd ridges are still a mystery. Were they formed by glaciers? Oceans? Image: NASA/JPL-Caltech/Univ. of Arizona

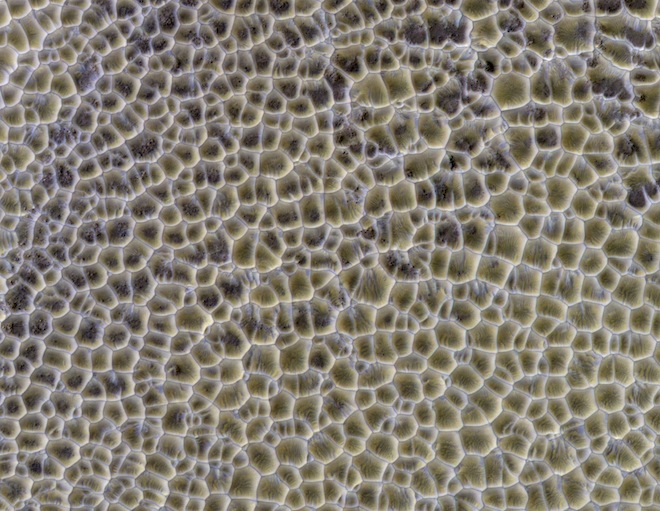
Many images of the Martian surface have confounded scientists, and some of them still do. But some, though they look puzzling and difficult to explain, have more prosaic explanations. The image below is a large area of intersecting sand dunes.

What is this? A vast area of Martian rice paddies? Lizard skin? Nope, just an area of intersecting sand dunes. Image: NASA/JPL-Caltech/Univ. of Arizona

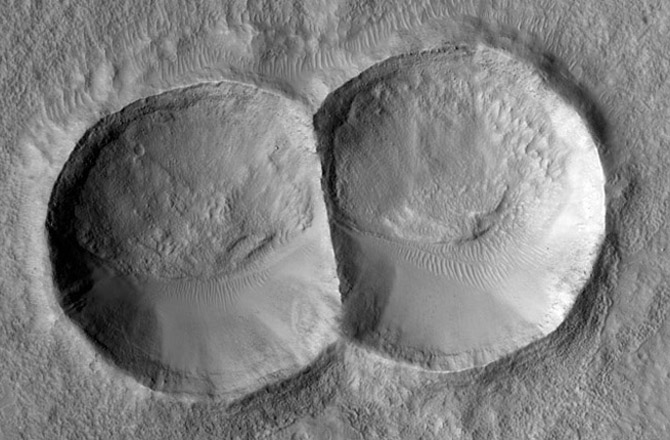
The surface of Mars is peppered with craters, and HiRise has imaged many of them. This double crater was caused by a meteorite that split in two before hitting the surface.

This double impact crater was caused by a meteorite that split into two before hitting Mars. Notice how the eroding force of the wind has shaped each crater the same, smoothing one edge and creating dunes in the same place. Image: NASA/JPL-Caltech/Univ. of Arizona

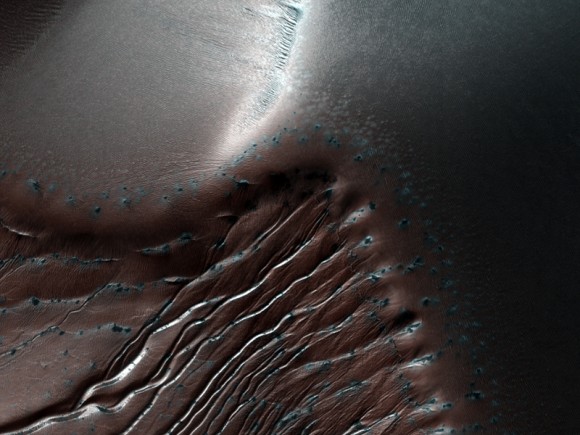
The image below shows gullies and dunes at the Russell Crater. In this image, the field of dunes is about 30 km long. This image was taken during the southern winter, when the carbon dioxide is frozen. You can see the frozen CO2 as white on the shaded side of the ridges. Scientists think that the gullies are formed when the CO2 melts in the summer.

These gullies are on the dunes of Russell Crater on Mars. This image was taken during winter, and the frozen carbon dioxide on the shaded slopes. Credit: NASA/JPL/University of Arizona

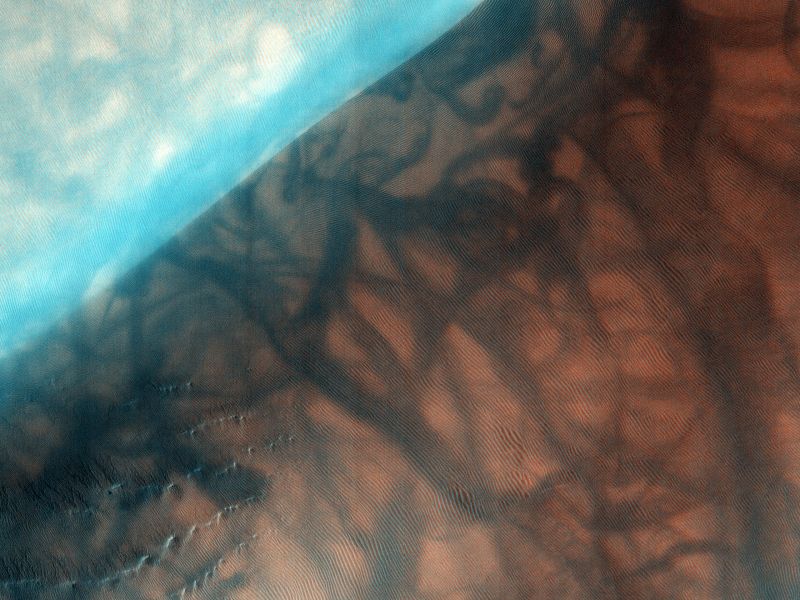
The next image is also the Russell Crater. It’s an area of study for the HiRise team, which means more Russell eye candy for us. This images shows the dunes, CO2 frost, and dust devil tracks that punctuate the area.

This image of the Russell Crater, an area of study for HiRise, shows the area covered in dunes, with some frost visible in the lower left. The larger, darker markings are dust devil tracks. Image: By NASA/JPL/University of Arizona – HiRISE, Public Domain, https://commons.wikimedia.org/w/index.php?curid=12015650

One of the main geological features on Mars is the Valles Marineris, the massive canyon system that dwarfs the Grand Canyon here on Earth. HiRise captured this image of delicate dune features inside Valles Marineris.

These delicate dune features formed inside the Valles Mariners, the massive canyon system on Mars. Image: NASA/JPL/University of Arizona

The Mars Reconnaissance Orbiter is still going strong. In fact, it continues to act as a communications relay for surface rovers. The HiRise camera is along for the ride, and if the past is any indication, it will continue to provide astounding images of Mars.

And we can’t seem to get enough of them.

It Might Be Possible to Refreeze the Icecaps to Slow Global Warming

NASA icecap data
NASA icecap data

One of the most worrisome aspects of Climate Change is the role played by positive feedback mechanisms. In addition to global temperatures rising because of increased carbon dioxide and greenhouse gas emissions, there is the added push created by deforestation, ocean acidification, and (most notably) the disappearance of the Arctic Polar Ice Cap.

However, according to a new study by a team of researchers from the School of Earth and Space Exploration at Arizona State University, it might be possible to refreeze parts of the Arctic ice sheet. Through a geoengineering technique that would rely on wind-powered pumps, they believe one of the largest positive feedback mechanisms on the planet can be neutralized.

Their study, titled “Arctic Ice Management“, appeared recently in Earth’s Future, an online journal published by the American Geophysical Union. As they indicate, the current rate at which Arctic ice is disappearing it quite disconcerting. Moreover, humanity is not likely to be able to combat rising global temperatures in the coming decades without the presence of the polar ice cap.

A drastic decrease in arctic sea ice since satellite imaging of the polar ice cap began. Credit: NASA

Of particular concern is the rate at which polar ice has been disappearing, which has been quite pronounced in recent decades. The rate of loss has been estimated at being between 3.5% and 4.1% per decade, with in an overall decrease of at least 15% since 1979 (when satellite measurements began). To make things worse, the rate at which ice is being lost is accelerating.

From a baseline of about 3% per decade between 1978-1999, the rate of loss since the 2000s has climbed considerably – to the point that the extent of sea-ice in 2016 was the second lowest ever recorded. As they state in their Introduction (and with the support of numerous sources), the problem is only likely to get worse between now and the mid-21st century:

“Global average temperatures have been observed to rise linearly with cumulative CO2 emissions and are predicted to continue to do so, resulting in temperature increases of perhaps 3°C or more by the end of the century. The Arctic region will continue to warm more rapidly than the global mean. Year-round reductions in Arctic sea ice are projected in virtually all scenarios, and a nearly ice-free (<106 km2 sea-ice extent for five consecutive years) Arctic Ocean is considered “likely” by 2050 in a business-as-usual scenario.”

One of the reasons the Arctic is warming faster than the rest of the planet has to do with strong ice-albedo feedback. Basically, fresh snow ice reflects up to 90% of sunlight while sea ice reflects sunlight with albedo up to 0.7, whereas open water (which has an albedo of close to 0.06) absorbs most sunlight. Ergo, as more ice melts, the more sunlight is absorbed, driving temperatures in the Arctic up further.

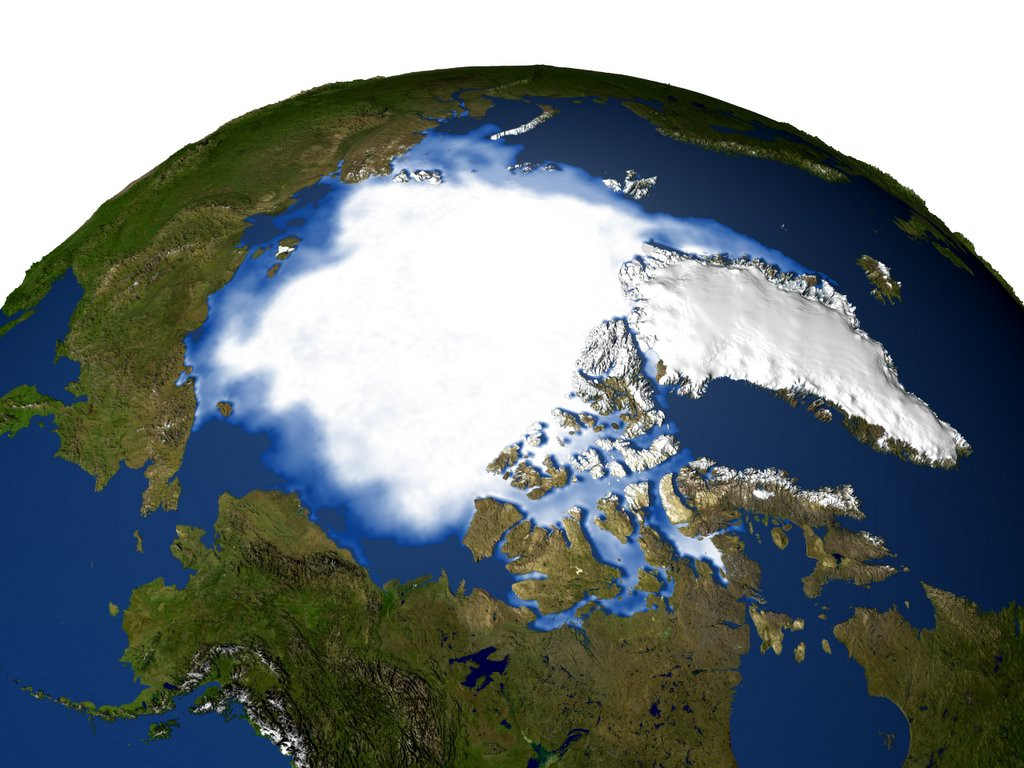
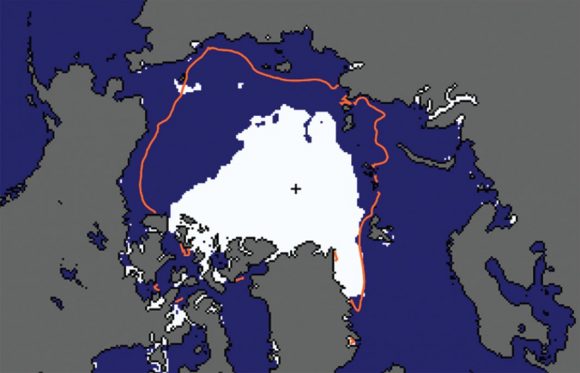
Arctic sea-ice extent (area covered at least 15% by sea ice) in September 2007 (white area). The red curve denotes the 1981–2010 average. Credit: National Snow and Ice Data CenterTo address this concern, the research team – led by Steven J. Desch, a professor from the School of Earth and Space Exploration – considered how the melting is connected to seasonal fluctuations. Essentially, the Arctic sea ice is getting thinner over time because new ice (aka. “first-year ice”), which is created with every passing winter, is typically just 1 meter (3.28 ft) thick.

Ice that survives the summer in the Arctic is capable of growing and becoming “multiyear ice”, with a typical thickness of 2 to 4 meters (6.56 to 13.12 ft). But thanks to the current trend, where summers are getting progressively warmer, “first-year ice” has been succumbing to summer melts and fracturing before it can grow. Whereas multiyear ice comprised 50 to 60% of all ice in the Arctic Ocean in the 1980s, by 2010, it made up just 15%.

With this in mind, Desch and his colleagues considered a possible solution that would ensure that “first-year ice” would have a better chance of surviving the summer. By placing machines that would use wind power to generate pumps, they estimate that water could be brought to the surface over the course of an Arctic winter, when it would have the best chance of freezing.

Based on calculations of wind speed in the Arctic, they calculate that a wind turbine with 6-meter diameter blades would generate sufficient electricity so that a single pump could raise water to a height of 7 meters, and at a rate of 27 metric tons (29.76 US tons) per hour. The net effect of this would be thicker sheets of ice in the entire affected area, which would have a better chance of surviving the summer.

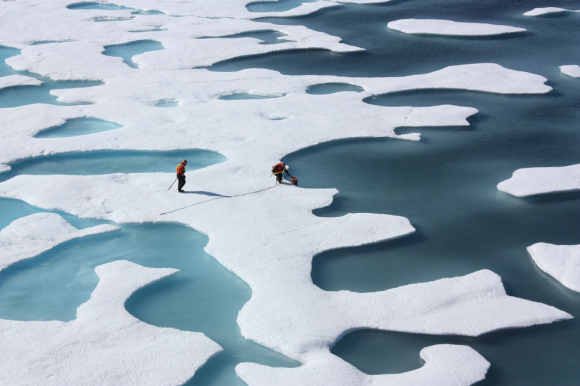
Melt pools on melting sea-ice. Every summer, newly-formed ice is threatened because of rising global temperatures. Credit NASA

Over time, the negative feedback created by more ice would cause less sunlight to be absorbed by the Arctic ocean, thus leading to more cooling and more ice accumulation. This, they claim, could be done on a relatively modest budget of $500 billion per year for the entire Arctic, or $50 billion per year for 10% of the Arctic.

While this may sounds like a huge figure, they are quick to point out that the cast covering the entire Arctic with ice-creating pumps  – which could save trillions in GDP and countless lives- is equivalent to just 0.64% of current world gross domestic product (GDP) of $78 trillion. For a country like the United States, it represents just 13% of the current federal budget ($3.8 trillion).

And while there are several aspects of this proposal that still need to be worked out (which Desch and his team fully acknowledge), the concept does appear to be theoretically sound. Not only does it take into account the way seasonal change and Climate Change are linked in the Arctic, it acknowledges how humanity is not likely to be be able to address Climate Change without resorting to geoengineering techniques.

And since Arctic ice is one of the most important things when it comes to regulating global temperatures, it makes perfect sense to start here.

Further Reading: Earth’s Future

NASA Fires a Rocket into the Northern Lights, for Science!

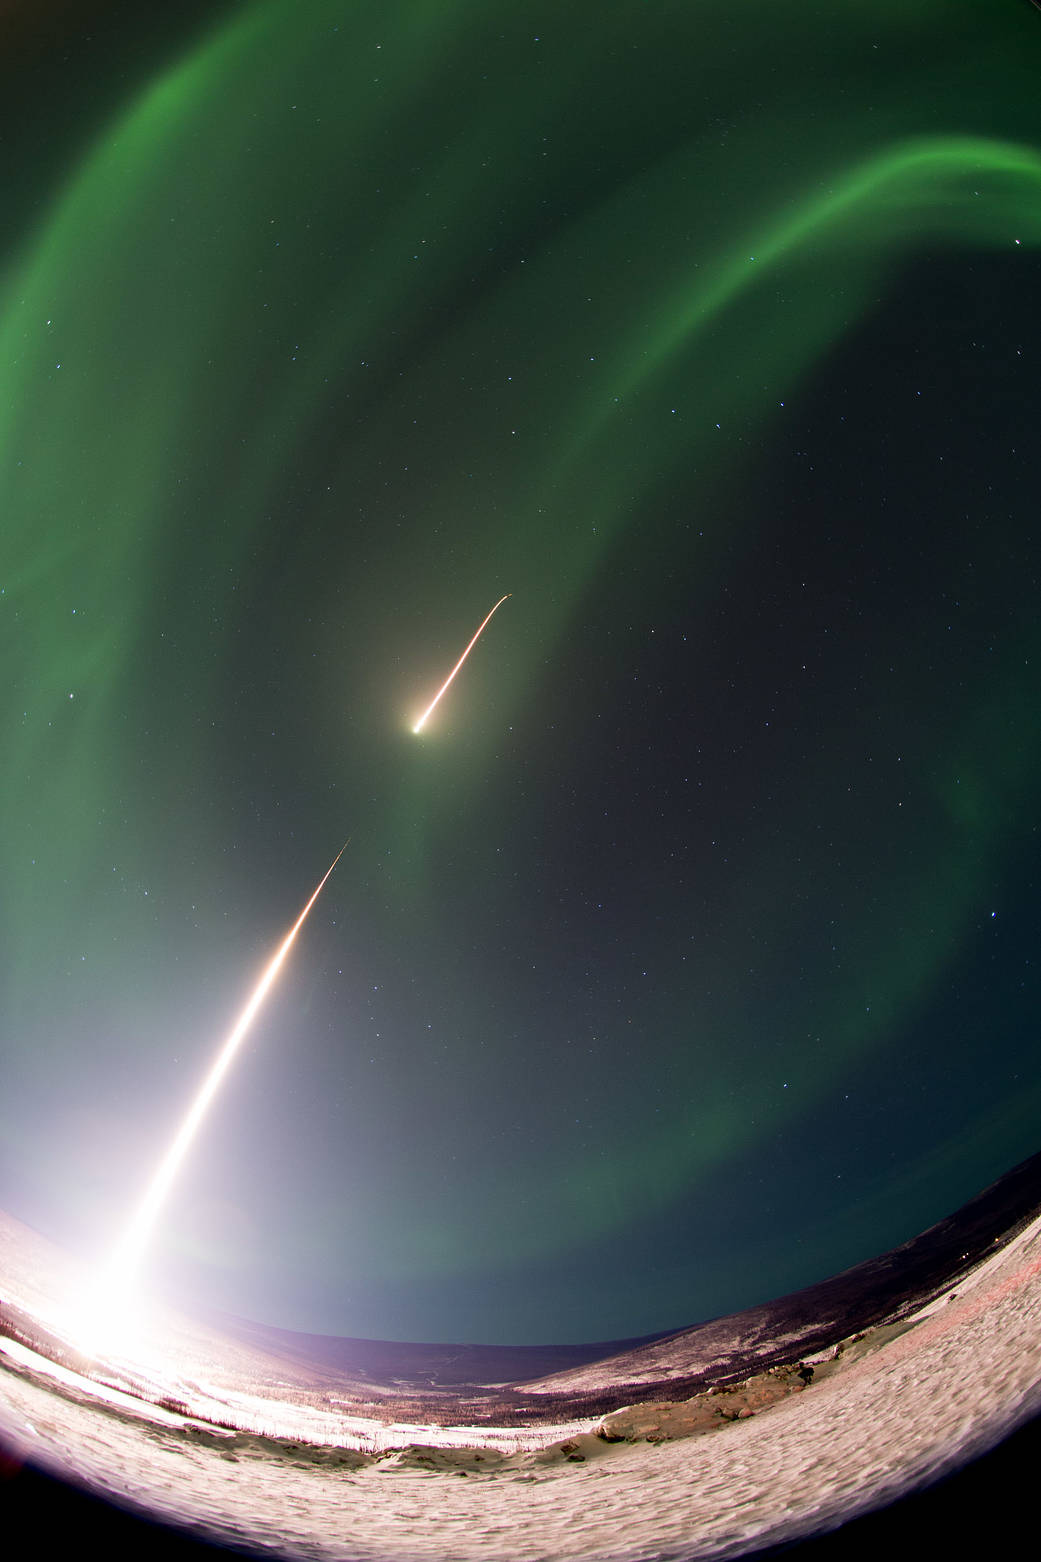
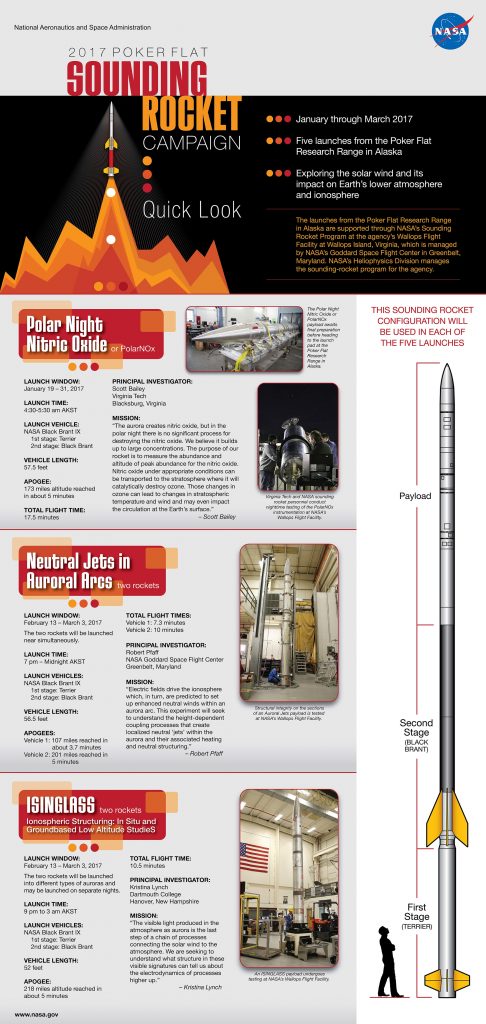
A NASA Black Brant IX sounding rocket soars skyward into an aurora over Alaska during the launch on 5:13 a.m. EST, Feb. 22, 2017. Credit: NASA/Terry Zaperach

Not only is it aurora season in Alaska, its sounding rocket season! NASA started launching a series of five sounding rockets from the Poker Flat Research Range in Alaska to study the aurora. The first of these rockets for this year, a Black Brant IX, was launched in the early morning hours of February 22, 2017.

The instrument on board was an Ionospheric Structuring: In Situ and Groundbased Low Altitude StudieS (ISINGLASS) instrumented payload, which studies the structure of an aurora.

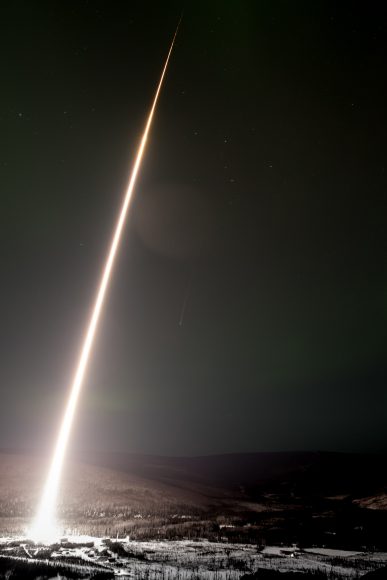
The Black Brant IX sounding rocket carried instruments to an altitude of 225 miles as part of the Ionospheric Structuring: In Situ and Groundbased Low Altitude StudieS or ISINGLASS mission. Credit: NASA/Terry Zaperach.

This is not the first sounding rocket flight from Poker Flats to launch into an aurora. Starting in 2009, this research has been taking place to help refine current models of aurora structure, and provide insight on the high-frequency waves and turbulence generated by aurorae. This helps us to better understand the space weather caused by the charged particles that come from the Sun and how it impacts Earth’s lower atmosphere and ionosphere.

“The visible light produced in the atmosphere as aurora is the last step of a chain of processes connecting the solar wind to the atmosphere,” said Kristina Lynch, ISINGLASS principal investigator from Dartmouth College. “We are seeking to understand what structure in these visible signatures can tell us about the electrodynamics of processes higher up.”

While humans don’t feel any of these effects directly, the electronic systems in our satellites do, and as our reliance on satellite technologies grow, researchers want to have all the data they can to help avert problems than can be caused by space weather.

The rocket sent a stream of real-time data back before landing about 200 miles downrange shortly after the launch.

The launch window for the remaining rockets runs through March 3. ISINGLASS will fly into what is known as a dynamic Alfenic curtain, which is a form of electromagnetic energy thought to be a key driver of “discrete” aurora – the typical, well-defined band of shimmering lights about six miles thick and stretching east to west from horizon to horizon.

NASA says that the five launches in the 2017 sounding rocket campaign will add to our body of information about this space through which our spacecraft and astronauts travel near Earth. By studying the interaction of the sun and its solar wind with Earth’s upper atmosphere, scientists are also able to apply the knowledge to other planetary bodies — helping us understand these interactions throughout the universe as well.

Here’s an infographic from NASA about the 2017 sounding rocket launches from Poker Flats:

Read more: NASA

Planet 9 Can’t Run Forever. Two Asteroids Give Up Some Clues

The six most distant known objects in the solar system with orbits exclusively beyond Neptune (magenta) all mysteriously line up in a single direction. Also, when viewed in three dimensions, they tilt nearly identically away from the plane of the solar system. Batygin and Brown show that a planet with 10 times the mass of the earth in a distant eccentric orbit anti-aligned with the other six objects (orange) is required to maintain this configuration. Credit: Caltech/R. Hurt (IPAC); [Diagram created using WorldWide Telescope.]

Last year, Caltech astronomers Mike Brown and Konstantin Batygin found indirect evidence for the existence of a large planet in the outer reaches of our Solar System — likely located out past Pluto — and since then, the search has been on. The latest research continues to show signs of an unseen planet, the hypothetical Planet 9.

Astronomers using the Gran Telescopio CANARIAS (GTC) in the Canary Islands looked at two distant asteroids called Extreme Trans Neptunian Objects’ (ETNOs), and spectroscopic observations show and their present-day orbits could be the result of a past interaction with a large “superearth”-type object orbiting the Sun at a distance between 300 to 600 AU.

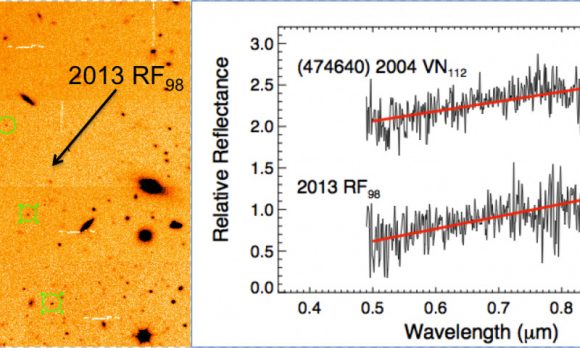
Researchers say the orbits of asteroids 2004 VN112 and 2013 RF98 suggest that the two were once a binary asteroid which separated after an encounter a large body, with a mass of between 10 and 20 Earth masses.

“The similar spectral gradients observed for the pair 2004 VN112 – 2013 RF98 suggests a common physical origin,” said Julia de León, the first author of a new paper, and who is an astrophysicist at the Instituto de Astrofísica de Canarias (IAC). “We are proposing the possibility that they were previously a binary asteroid which became unbound during an encounter with a more massive object.”

Sequence of images taken with the Gran Telescopio CANARIAS (GTC) to identify one of the ETNO´s studied in this article, 2013 RF98, where one can see how it moves during four consecutive nights. Below, right, visible spectra obtained with the GTC of the two objects 2004 VN112 and 2013 RF98. The red lines show the gradients of the spectra. Credit: Julia de León (IAC).

To test their hypothesis, the team performed thousands of simulations to see how the poles of the orbits would separate as time went on. The results of these simulations suggest that a possible Planet 9 could have separated the pair of asteroids around 5 to 10 million years ago.

de León said this could explain, in principle, how these two asteroids, starting as a pair orbiting one another, became gradually separated in their orbits after an encounter with a much more massive object at a particular moment in time.

The tale of Planet 9 started in 2014, when astronomers Chad Trujillo and Scott Shepard were studying the motions of large objects in the Kuiper Belt and realized that a large planet in the outer Solar System must be altering orbits of several ETNOs the in Kuiper Belt.

Brown and Batygin were looking to verify or refute the research of Trujillo and Shepard, and they painstakingly analyzed the movement of various KBOs. They found that six different objects all seem to follow a very similar elliptical orbit that points back to the same region in space.

All the bodies were found to be inclined at a plane of about 30-degrees different from almost everything else in the Solar System. Brown said the odds of these orbits all occurring randomly are about 1 in 100.

But calculations revealed the orbits could be influenced by a massive planet way out beyond the orbit of Pluto, about 200 times further than the distance from the Sun to the Earth. This planet would be Neptune-sized, roughly 10 times more massive than Earth.

It hasn’t been found yet, but the hunt is on by large telescopes around the world, and a new citizen science project allows people around the world to join in the search.

The latest findings of by de León and team could help point the way to where Planet 9 might be lurking.

Source: PhysOrg

Here’s an Aerial View of a Massive Iceberg Shearing away from Antarctica

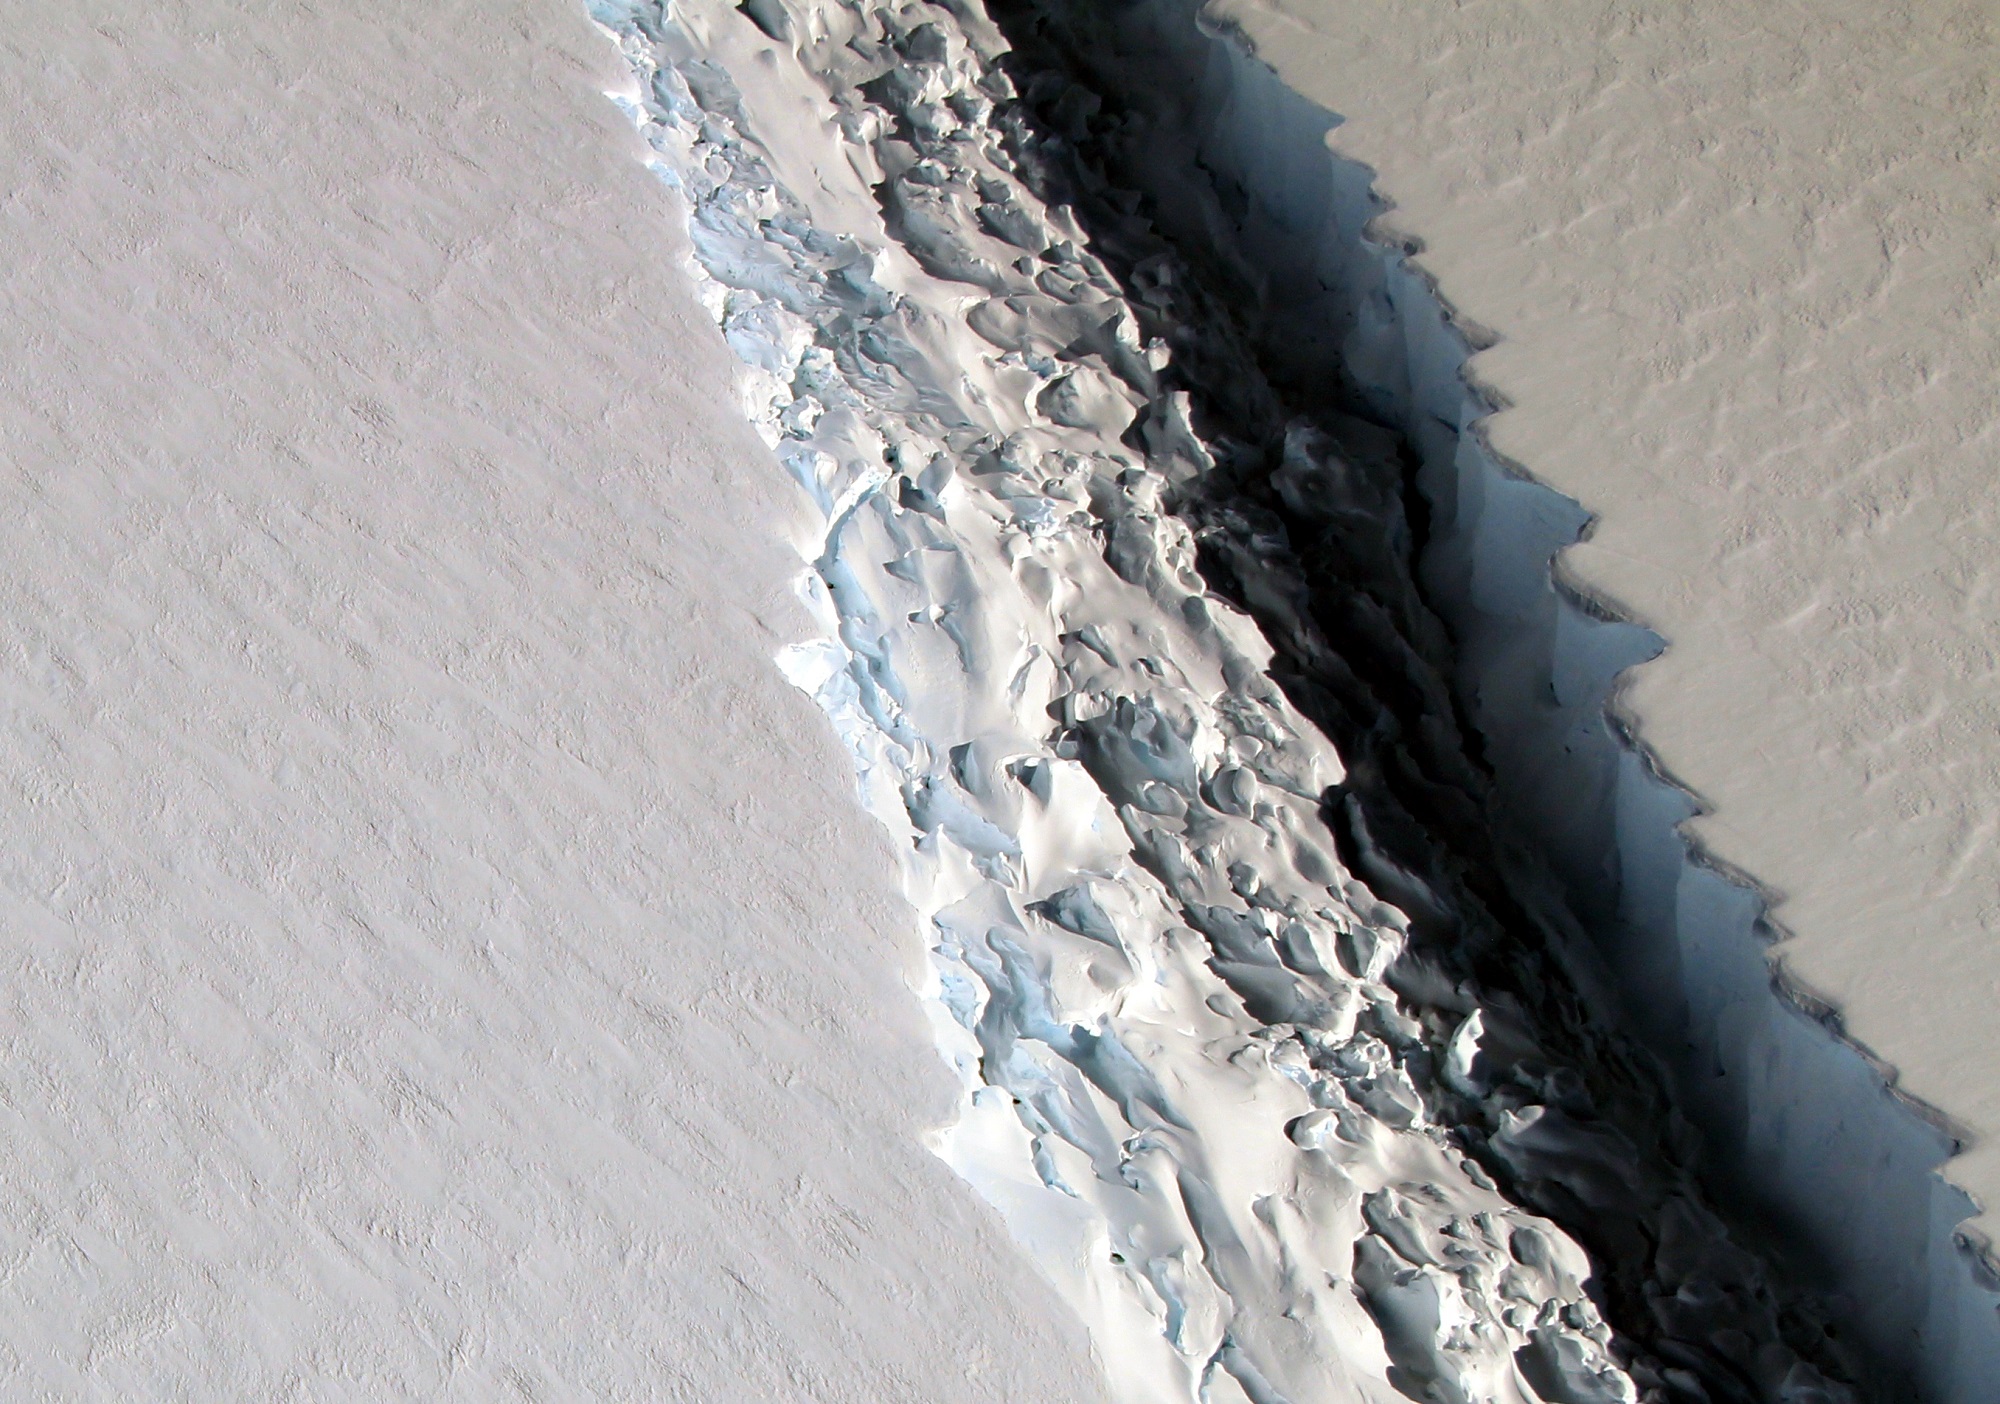
The rift in the Larsen C Ice Shelf. Credit: NASA/John Sonntag

Located along the east coast of the Antarctic Peninsula is the Larsen Ice Shelf. Named after the Norwegian Captain who explored the ice front back in 1893, this ice shelf has been monitored for decades due to its close connection with rising global temperatures. Essentially, since the 1990s, the shelf has been breaking apart, causing collapses of considerable intensity.

According to the British Antarctic Survey (BAS), the section of the ice sheet known as the Larsen C Ice Shelf could be experiencing a collapse of its own soon enough. Based on video footage and satellite evidence of the sizeable rift (which is 457 m or 15oo ft across) in the shelf, it is believed that an ice berg that is roughly 5,000 km² (1930.5 mi²) in size could be breaking off and calving into the ocean in the near future.

An ice shelf is essentially a floating extension of a land-based glacier. In this case, the Larsen Ice Shelf is seaborne section of the larger Larsen Glacier, which flows southeast past Mount Larsen and enters the Ross Sea just south of Victoria Land. These shelves often act as buttresses, holding back glaciers that flow down to the coast, thus preventing them from entering the ocean and contributing to rising sea levels.

In the past twenty-two years, the Larsen A and B ice shelves (which were situated further north along the Antarctic Peninsula) both collapsed into the sea. This resulted in the dramatic acceleration of glaciers behind them, as larger volumes of ice were able to flow down the coast and drop into the ocean. While Larsen C appeared to still be stable, in November of 2016, NASA noted the presence of a large crack in its surface.

This crack was about 110 kilometers (68 mi) long and was more than 91 m (299 ft) wide, reaching a depth of about 500 m (1,600 ft). By December, the rift had extended another 21 km (13 mi), which raised concerns about calving. In February of 2017, satellite observations of the shelf noted that the crack appeared to have grown further, which confirmed what researches from the MIDAS project had previously reported.

This UK-based Antarctic research project – which is based at Swansea University and Aberystwyth University in Wales and supported by the BAS and various international partners – is dedicated to monitoring the Larsen C ice shelf in Antarctica. Through a combination of field work, satellite observations, and computer simulations, they have catalogued how recent warming trends has caused seasonal melts of the ice shelf and affected its structure.

And in recent years, they have been monitoring the large crack, which has been fast-moving, and noted the appearance of several elongations. It was during the current Antarctic field season that members of the project filmed what the crack looked like from the air. In previous surveys, the glaciology research team has conducted research on the ice shelf using seismic techniques to survey the seafloor beneath it.

However, this past season, they did not set up on the ice shelf itself for fear of a calving event. Instead, they made a series of trips to and from the UK’s Rothera Research Station aboard twin otter aircraft. During an outing to retrieve some of their science equipment, the crew noted how the crack looked from above and started filming. As you can see from the footage, the rift is very wide and extremely long.

What’s more, the team estimates that if an iceberg from this shelf breaks off and falls into the ocean, it will likely be over three times the size of cities like London or New York City. And while this sort of thing is common with glaciers, the collapse of a large section of Larsen C could speed the flow of the Larsen Glacier towards the Antarctic Ocean.

As Dr Paul Holland, an ice and ocean modeller at the British Antarctic Survey, said in a recent press release:

“Iceberg calving is a normal part of the glacier life cycle, and there is every chance that Larsen C will remain stable and this ice will regrow.  However, it is also possible that this iceberg calving will leave Larsen C in an unstable configuration.  If that happens, further iceberg calving could cause a retreat of Larsen C. We won’t be able to tell whether Larsen C is unstable until the iceberg has calved and we are able to understand the behavior of the remaining ice. The stability of ice shelves is important because they resist the flow of the grounded ice inland.  After the collapse of Larsen B, its tributary glaciers accelerated, contributing to sea-level rise.”

One of the greatest concerns about climate change is the feedback mechanisms it creates. In addition to increased warming trends caused by rising levels of CO² in the atmosphere, the melting of glaciers and the breakup of ice shelves can have a pronounced effect on sea levels. In the end, the depletion of glaciers in Antarctica could have dramatic consequences for the rest of the planet.

Further Reading: British Antarctic Survey

Get Ready for the First Pictures of a Black Hole’s Event Horizon

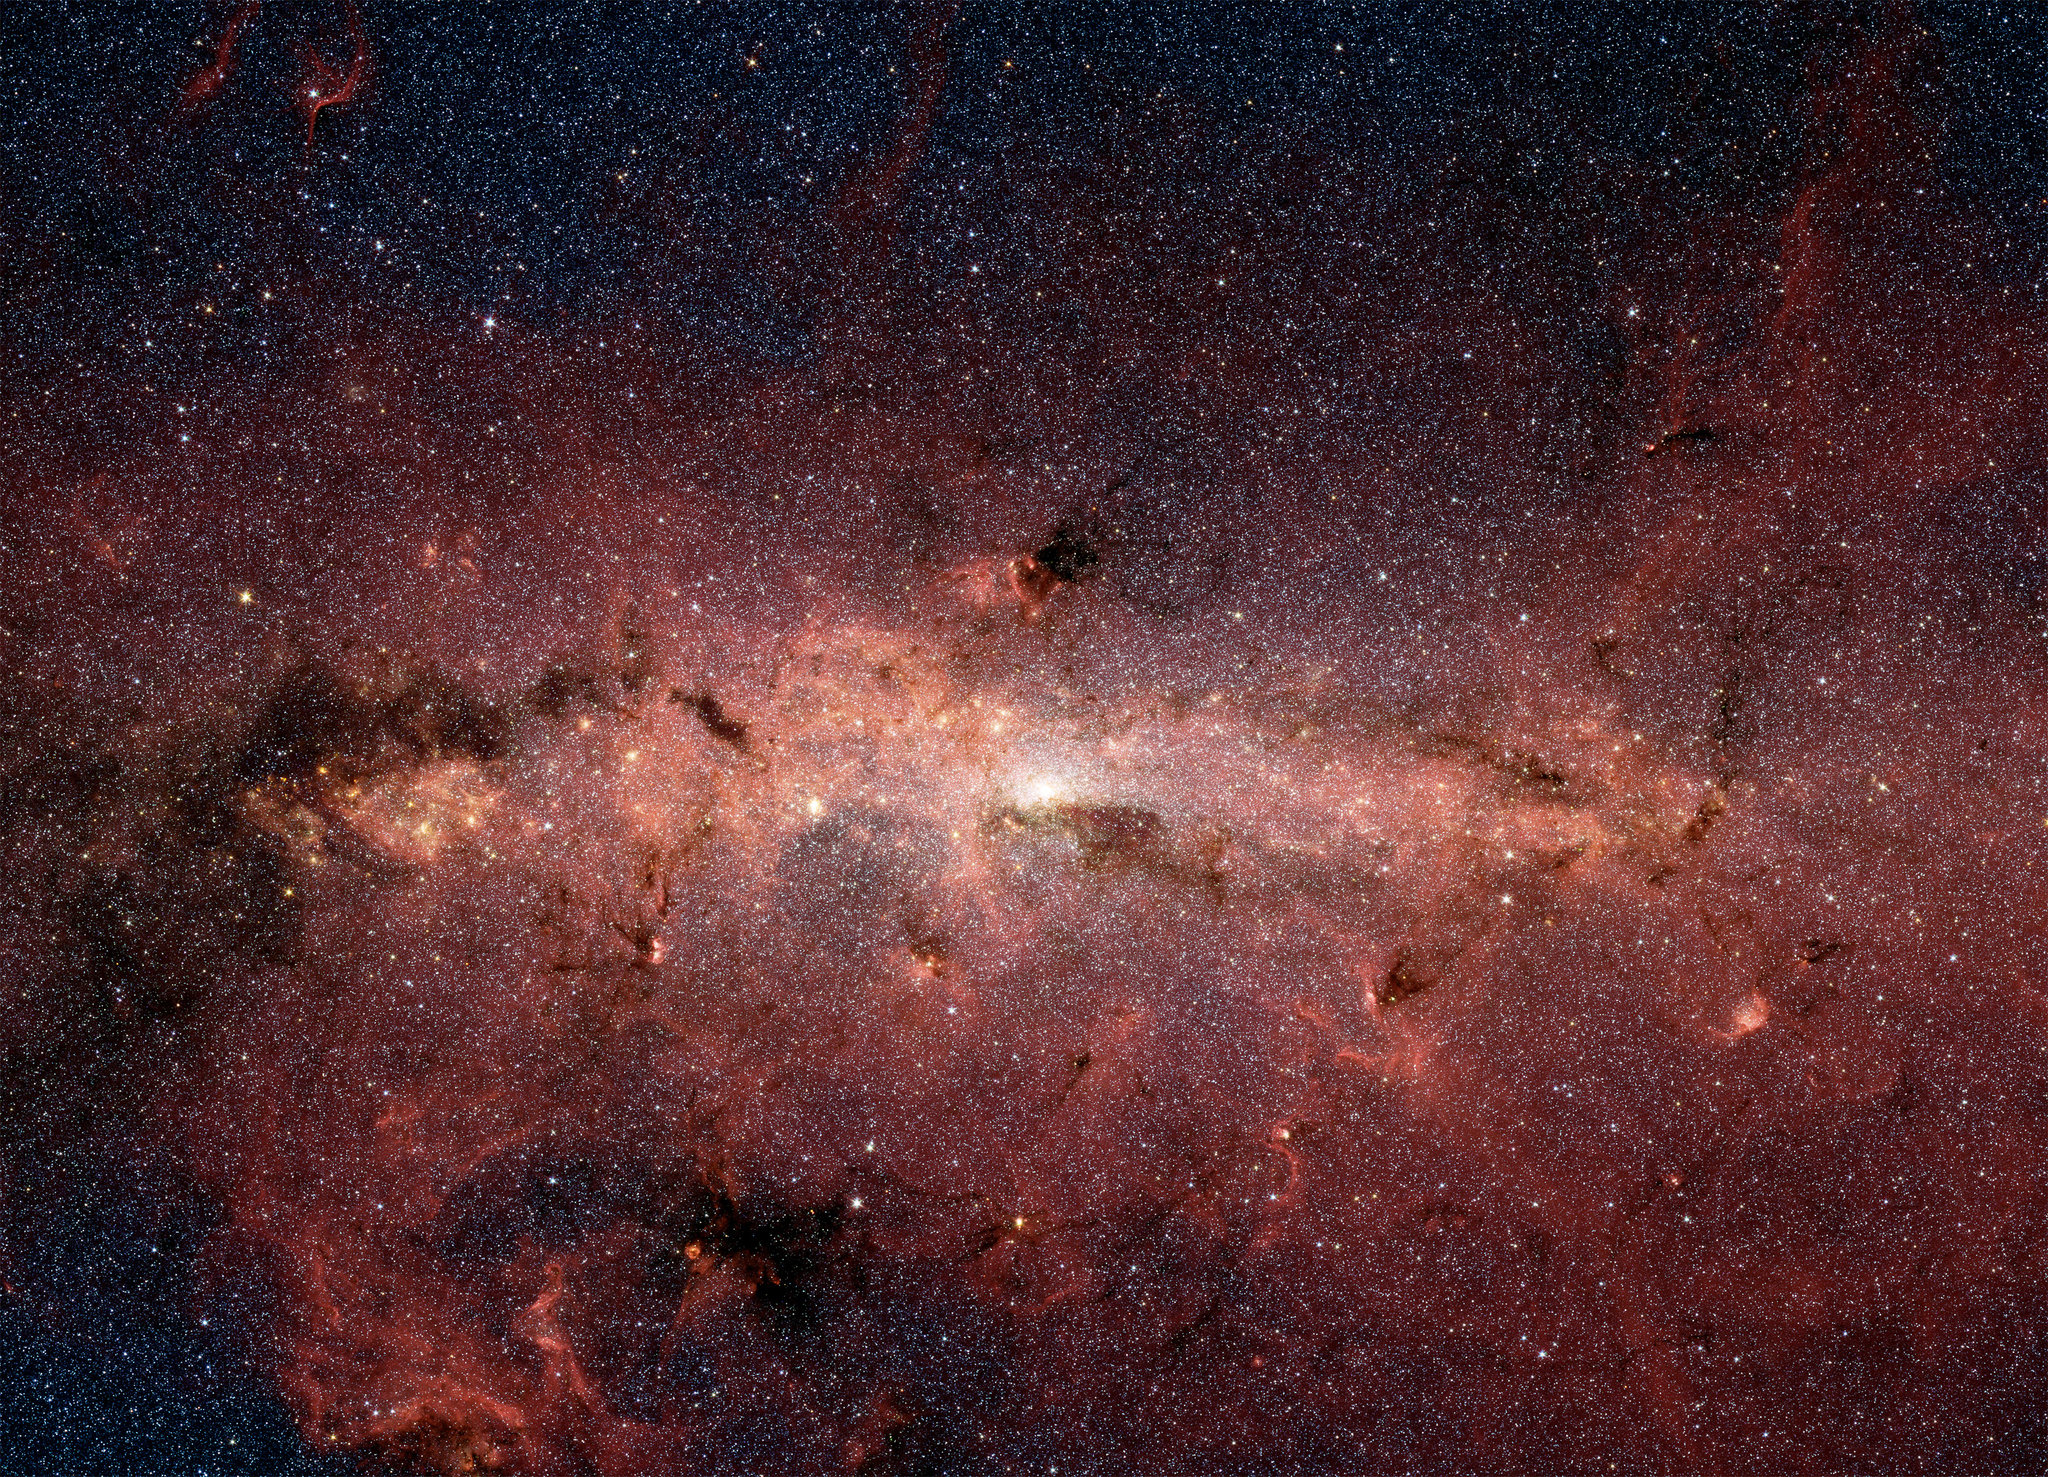
NASA's Spitzer Space Telescope captured this stunning infrared image of the center of the Milky Way Galaxy, where the black hole Sagitarrius A resides. Credit: NASA/JPL-Caltech

It might sound trite to say that the Universe is full of mysteries. But it’s true.

Chief among them are things like Dark Matter, Dark Energy, and of course, our old friends the Black Holes. Black Holes may be the most interesting of them all, and the effort to understand them—and observe them—is ongoing.

That effort will be ramped up in April, when the Event Horizon Telescope (EHT) attempts to capture our first image of a Black Hole and its event horizon. The target of the EHT is none other than Sagittarius A, the monster black hole that lies in the center of our Milky Way Galaxy. Though the EHT will spend 10 days gathering the data, the actual image won’t be finished processing and available until 2018.

The EHT is not a single telescope, but a number of radio telescopes around the world all linked together. The EHT includes super-stars of the astronomy world like the Atacama Large Millimeter Array (ALMA) as well as lesser known ‘scopes like the South Pole Telescope (SPT.) Advances in very-long-baseline-interferometry (VLBI) have made it possible to connect all these telescopes together so that they act like one big ‘scope the size of Earth.

The ALMA array in Chile. Once ALMA was added to the Event Horizon Telescope, it increased the EHT’s power by a factor of 10. Image: ALMA (ESO/NAOJ/NRAO), O. Dessibourg

The combined power of all these telescopes is essential because even though the EHT’s target, Sagittarius A, has over 4 million times the mass of our Sun, it’s 26,000 light years away from Earth. It’s also only about 20 million km across. Huge but tiny.

The EHT is impressive for a number of reasons. In order to function, each of the component telescopes is calibrated with an atomic clock. These clocks keep time to an accuracy of about a trillionth of a second per second. The effort requires an army of hard drives, all of which will be transported via jet-liner to the Haystack Observatory at MIT for processing. That processing requires what’s called a grid computer, which is a sort of virtual super-computer comprised of 800 CPUs.

But once the EHT has done its thing, what will we see? What we might see when we finally get this image is based on the work of three big names in physics: Einstein, Schwarzschild, and Hawking.

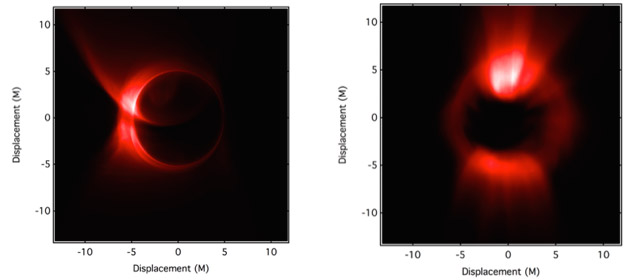
A simulation of what the EHT might show us. Image: Event Horizon Telescope Organization

As gas and dust approach the black hole, they speed up. They don’t just speed up a little, they speed up a lot, and that makes them emit energy, which we can see. That would be the crescent of light in the image above. The black blob would be a shadow cast over the light by the hole itself.

Einstein didn’t exactly predict the existence of Black Holes, but his theory of general relativity did. It was the work of one of his contemporaries, Karl Schwarzschild, that actually nailed down how a black hole might work. Fast forward to the 1970s and the work of Stephen Hawking, who predicted what’s known as Hawking Radiation.

Taken together, the three give us an idea of what we might see when the EHT finally captures and processes its data.

Einstein’s general relativity predicted that super massive stars would warp space-time enough that not even light could escape them. Schwarzschild’s work was based on Einstein’s equations and revealed that black holes will have event horizons. No light emitted from inside the event horizon can reach an outside observer. And Hawking Radiation is the theorized black body radiation that is predicted to be released by black holes.

The power of the EHT will help us clarify our understanding of black holes enormously. If we see what we think we’ll see, it confirms Einstein’s Theory of General Relativity, a theory which has been confirmed observationally over and over. If EHT sees something else, something we didn’t expect at all, then that means Einstein’s General Relativity got it wrong. Not only that, but it means we don’t really understand gravity.

In physics circles they say that it’s never smart to bet against Einstein. He’s been proven right time and time again. To find out if he was right again, we’ll have to wait until 2018.

Huge News, Seven Earth-Sized Worlds Orbiting a Red Dwarf, Three in the Habitable Zone

Illustration showing the possible surface of TRAPPIST-1f, one of the newly discovered planets in the TRAPPIST-1 system. Credits: NASA/JPL-Caltech
Illustration showing the possible surface of TRAPPIST-1f, one of the newly discovered planets in the TRAPPIST-1 system. It's a very active flare star. Credits: NASA/JPL-Caltech

In what is surely the biggest news since the hunt for exoplanets began, NASA announced today the discovery of a system of seven exoplanets orbiting the nearby star of TRAPPIST-1. Discovered by a team of astronomers using data from the TRAPPIST telescope in Chile and the Spitzer Space Telescope, this find is especially exciting since all of these planets are believed to be Earth-sized and terrestrial (i.e. rocky).

But most exciting of all is the fact that three of these rocky exoplanets orbit within the star’s habitable zone (aka. “Goldilocks Zone”). This means, in effect, that these planets are capable of having liquid water on their surfaces and could therefore support life. As far as extra-solar planet discoveries go, this is without precedent, and the discovery heralds a new age in the search for life beyond our Solar System.

Continue reading “Huge News, Seven Earth-Sized Worlds Orbiting a Red Dwarf, Three in the Habitable Zone”

Here’s Something We Never Thought We’d See on a Comet: Shifting Dunes

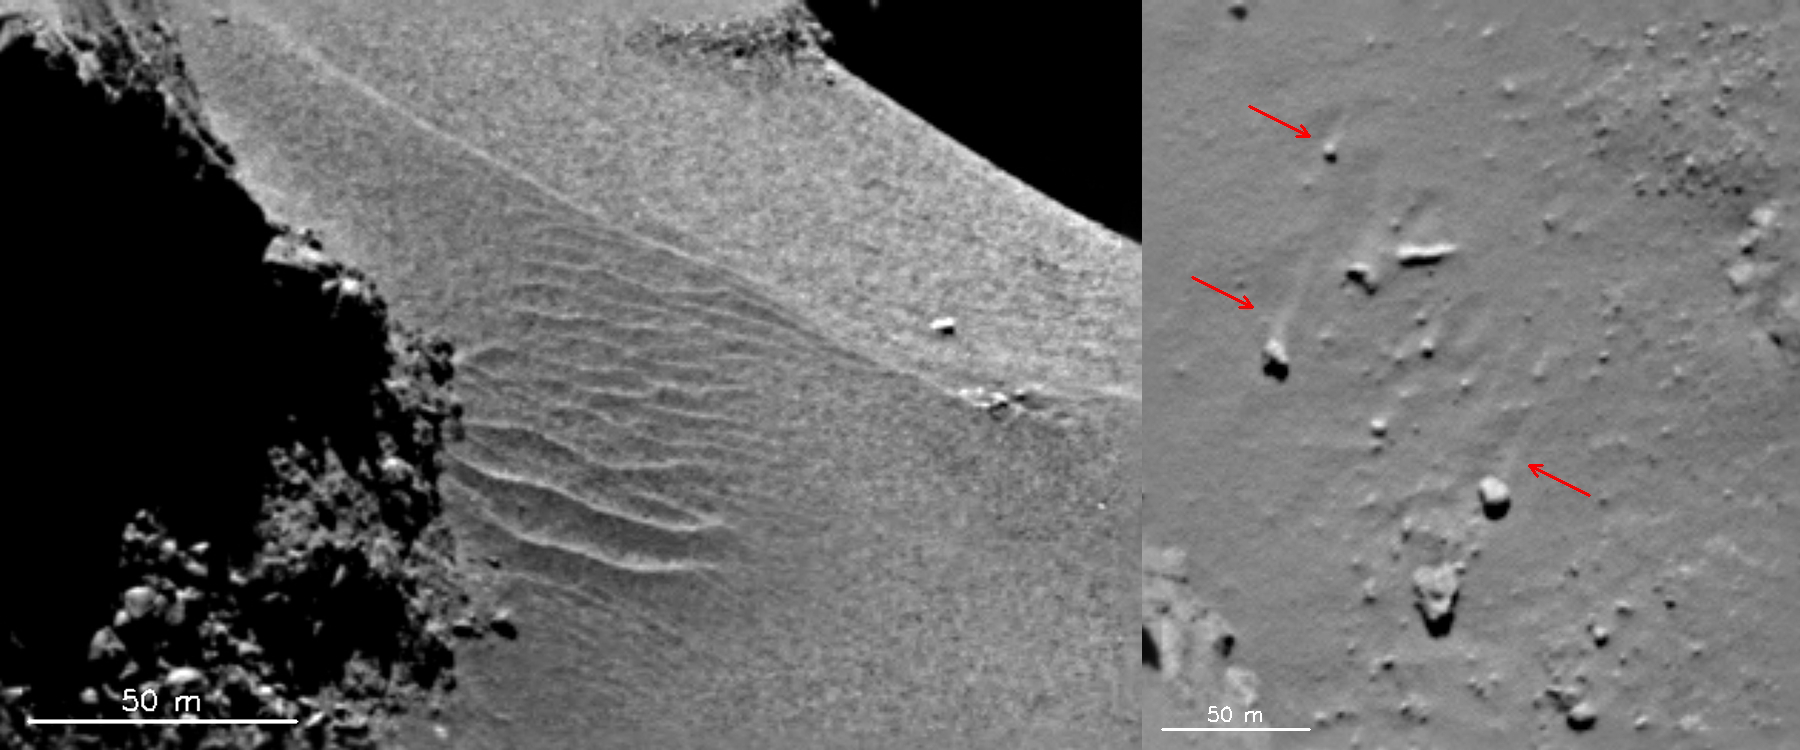
Features in the Hapi region show evidence of local gas-driven transport producing dune-like ripples (left) and boulders with ‘wind-tails’ (right) – where the boulder has acted as a natural obstacle to the direction of the gas flow, creating a streak of material ‘downwind’ of it. The images were taken with the OSIRIS narrow-angle camera on 18 September 2014. Credit: ESA/Rosetta/MPS for OSIRIS Team MPS/UPD/LAM/IAA/SSO/INTA/UPM/DASP/IDA

The Rosetta mission’s close-up views of the curiously-shaped Comet 67P/Churyumov-Gerasimenko have already changed some long-held ideas about comets. But here’s more: there’s a ‘wind’ blowing across the comet’s surface, creating moving shifting dunes.

“The approach to comet 67P/Churyumov–Gerasimenko by the spacecraft Rosetta has revealed the presence of astonishing dune-like patterns,” wrote Philippe Claudin, of the Institute of Industrial Physics and Chemistry, Paris, France, in his new paper, noting the unusual and unexpected conditions found on Comet 67P.

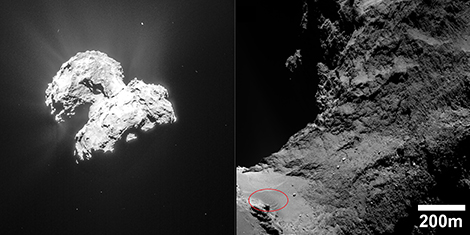
Left, an image of comet Chury showing outgassing of water vapor, which entrains dust (© ESA/Rosetta/NAVCAM). Right, the neck region, between the comet’s two lobes. Various types of relief can be seen, including the dunes, at bottom left (circled in red), in the sandy region. Credit: ESA/Rosetta/MPS for OSIRIS Team MPS/UPD/LAM/IAA/SSO/INTA/UPM/DASP/IDA).

Images from Rosetta’s cameras revealed the dusty covering of the comet may be several meters thick in places, which was surprising. But even more surprising was seeing active dunes that are changing. The dunes were seen on both of the ‘lobes’ of the comet as well as on the neck that connects them. Comparisons images taken 16 months of the same region shows evidence that the dunes moved, and are therefore active.

Claudin and his team said that the formation of sedimentary dunes requires the presence of grains and of winds that are strong enough to transport them along the ground. However, comets do not have a dense, permanent and active atmosphere like Earth does. Also, Comet 67P’s gravity is so weak – only about 1/50,000 that of Earth’s – that fast moving grains might be ‘launched’ into space.

What could be creating a wind strong enough that not only moved the grains, but also some boulders up to a meter wide?

There is indeed a wind blowing along the comet’s surface, said Claudin, coming from gases that escape from the surface.
Gases escape at ‘sunset’ on the comet, caused by the pressure difference between the sunlit side, where the surface ice can sublimate due to the energy provided by the sunlight, and the night side.

“This transient atmosphere is still extremely tenuous, with a maximum pressure at perihelion, when the comet is closest to the Sun, 100,000 times lower than on Earth,” the team said in a press release. “However, gravity on the comet is also very weak, and an analysis of the forces exerted on the grains at the comet’s surface shows that these thermal winds can transport centimeter-scale grains, whose presence has been confirmed by images of the ground. The conditions required to allow the formation of dunes, namely winds able to transport the grains along the ground, are thus met on Chury’s surface.”

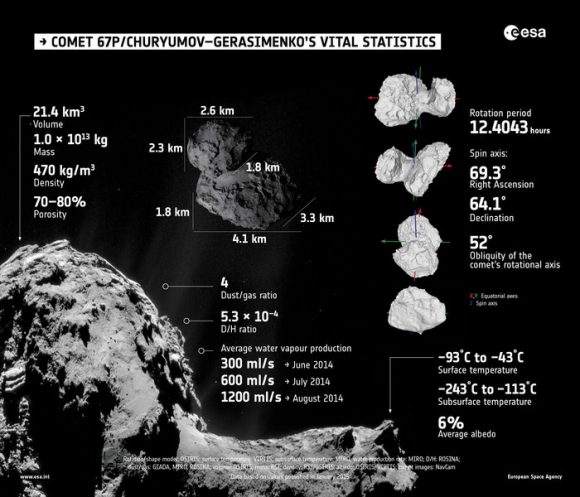
Summary of properties of Comet 67P/Churyumov–Gerasimenko, as determined by Rosetta’s instruments during the first few months of its comet encounter. Credit: ESA.

The transportation of dust has created dune-like ripples, and boulders with ‘wind-tails’ – the boulders act as natural obstacles to the direction of the gas flow, creating streaks of material ‘downwind’ of them.

Claudin said this finding represents a step forward in understanding the various processes at work on cometary surfaces, and also shows the Rosetta mission still has many surprises and discoveries in store.

Paper: Giant ripples on comet 67P/Churyumov–Gerasimenko sculpted by sunset thermal wind

Press release