Hubble Telescope Zooms In On Mars

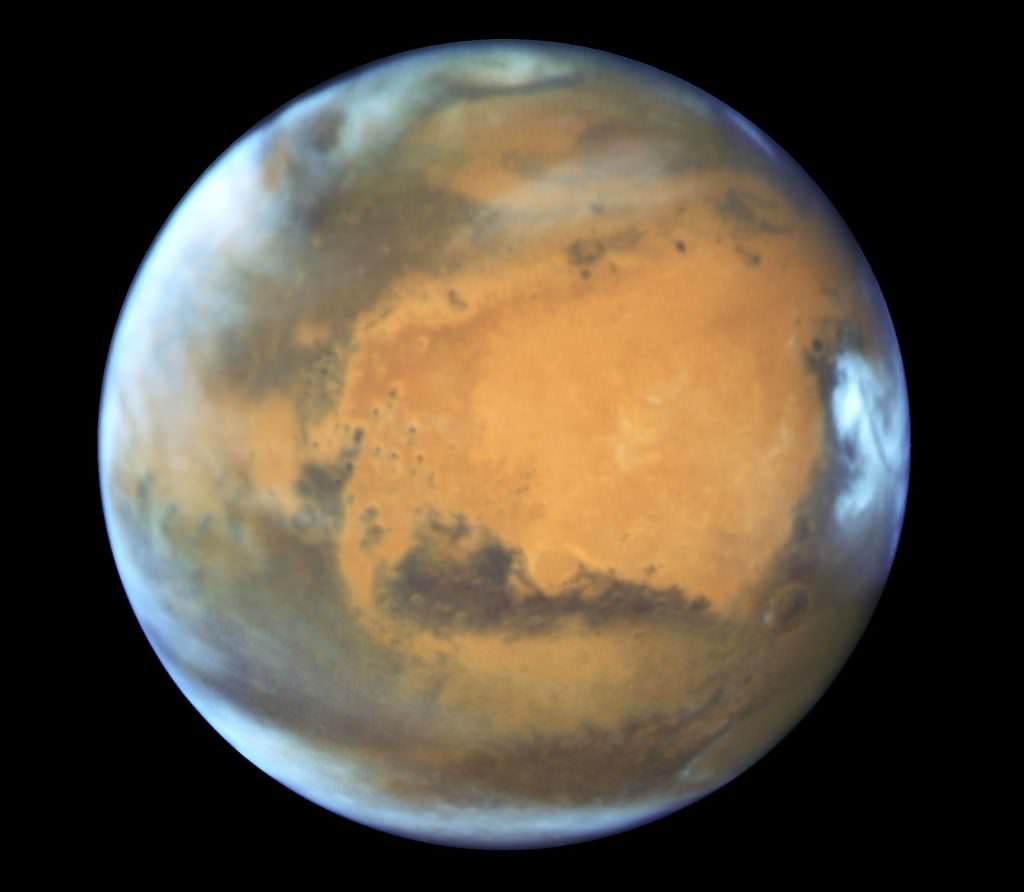
Mars snapped with the Hubble Space Telescope on May 12 just days before opposition. Credit: NASA/ESA
This image shows our neighbouring planet Mars, as it was observed shortly before opposition in 2016 by the NASA/ESA Hubble Space Telescope. Some prominent features of the planet are clearly visible: the ancient and inactive shield volcano Syrtis Major; the bright and oval Hellas Planitia basin; the heavily eroded Arabia Terra in the centre of the image; the dark features of Sinus Sabaeous and Sinus Meridiani along the equator; and the small southern polar cap.
On May 12, the Hubble Space Telescope took this photo of Mars. Some prominent features of the planet are clearly visible: the ancient and inactive shield volcano Syrtis Major (far right and partly covered by clouds); the heavily eroded Arabia Terra in the center of the image; the dark features of Sinus Sabaeous and Sinus Meridiani below center and the small north polar cap (top).

We’re in store for an exciting weekend as the Earth and Mars get closer to each other than at any time in the last ten years. To take advantage of this special opportunity, the Hubble Space Telescope, normally busy eyeing remote galaxies, was pointed at our next door neighbor to capture this lovely close-up image.
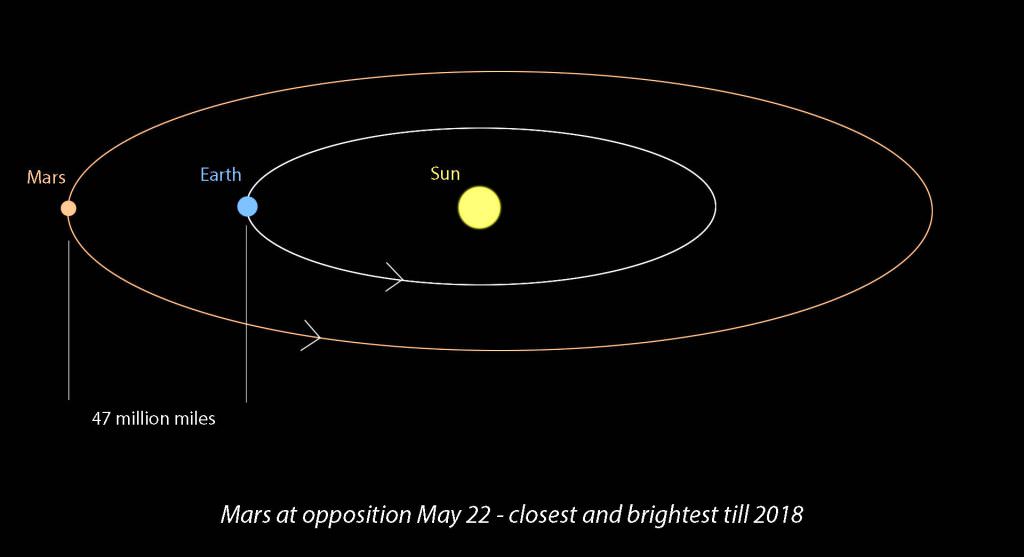
Opposition occurs when Mars and Earth line up on the same side of the Sun. The two planets are closest together at that time. Mars opposition occurs on May 22, when the planet will shine at magnitude -2.0 and with an apparent diameter of 18.6 arc seconds, its largest in years. Credit: Bob King
Opposition occurs when Mars and Earth line up on the same side of the Sun. The two planets are closest together around that time. Mars opposition occurs on May 22, when the planet will shine at magnitude -2.0 and with an apparent diameter of 18.6 arc seconds, its largest in over 10 years. Credit: Bob King

As Universe Today writer David Dickinson described in his excellent Mars guide, the planet reaches opposition on Sunday morning May 22. That’s when the planet will be directly opposite the Sun in the sky and rise in the east around the same time the Sun sets in the west. Earth sits squarely in between. Opposition also marks the planet’s close approach to Earth, so that Mars appears bigger and brighter in the sky than usual. A perfect time for detailed studies whether through both amateur and professional telescopes.

Although opposition for most outer planets coincides with the date of closest approach, that’s not true in the case of Mars. If Mars is moving away from the Sun in its orbit when Earth laps it, closest approach occurs a few days before opposition.  But if the planet is moving toward the Sun when our planet passes by, closest approach occurs a few days after opposition. This time around, Mars is headed sunward, so the date of closest approach of the two planets occurs on May 30.

It’s all goes back to Mars’ more eccentric orbit, which causes even a few days worth of its orbital travels to make a difference in the distance between the two planets when Earth is nearby.  On May 22, Mars will be 47.4 million miles away vs. 46.77 million on the 30th, a difference of about 700,000 miles.
asdf
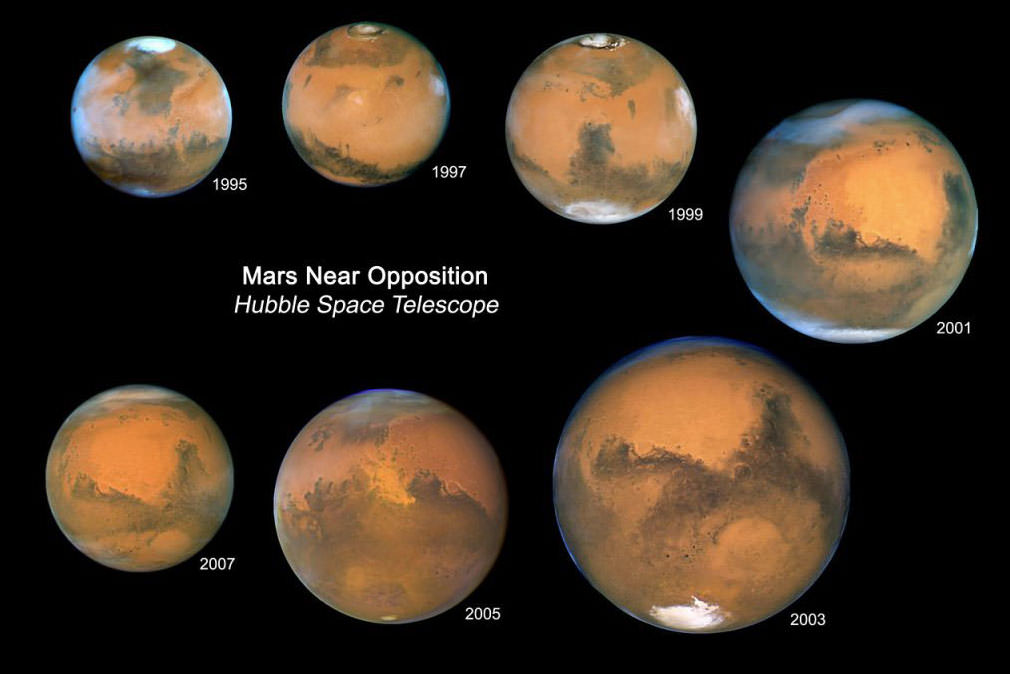
Every 26 months Mars reaches opposition. This mosaic of photos taken by Hubble show seven different oppositions since 1995. Because of Mars’ elliptical orbit, it shows variations in apparent size from opposition to opposition.  Mars was the closest in 2003 when it came within 34.8 million miles (56 million kilometer) of Earth. The part of Mars that is tilted towards the Earth also shifts over time, resulting in the changing visibility of the polar caps. Clouds and dust storms, as well as the size of the ice caps, can change the appearance of Mars on time scales of days, weeks, and months. Other features of Mars, such as some of the large dark markings, have remained unchanged for centuries. Credit: NASA/ESA

On May 12, Hubble took advantage of this favorable alignment and turned its gaze towards Mars to take an image of our rusty-hued neighbor, From this distance the telescope could see Martian features as small as 18.6 miles (30 kilometers) across. The image shows a sharp, natural-color view of Mars and reveals several prominent geological features, from smaller mountains and erosion channels to immense canyons and volcanoes.
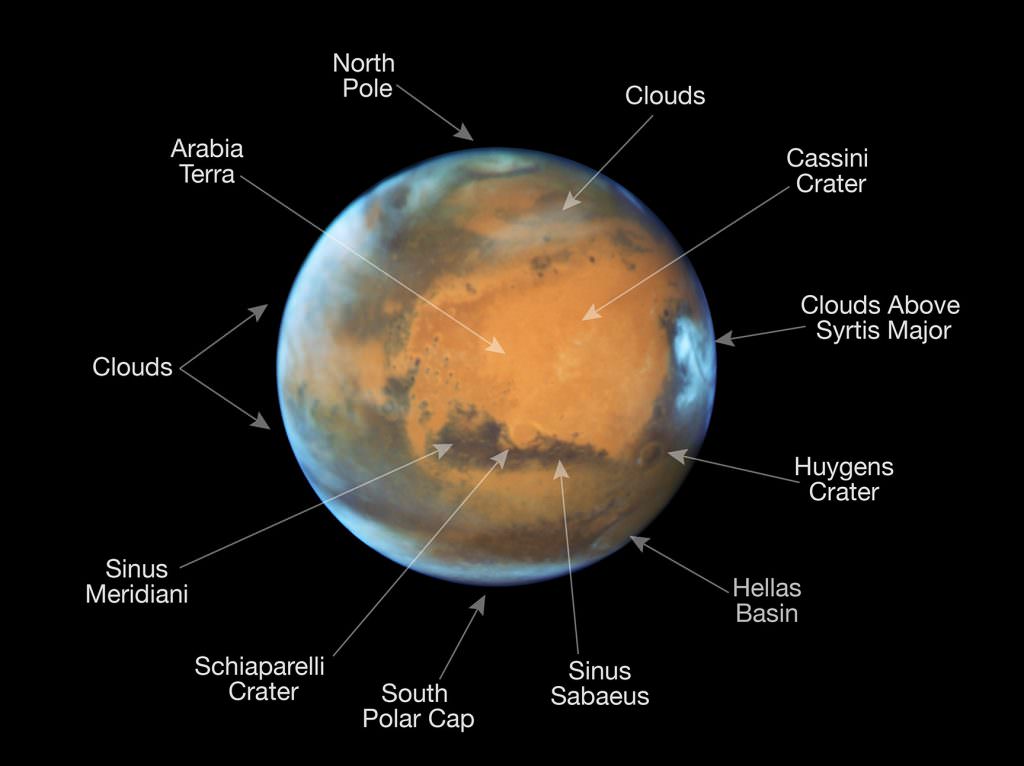
This image shows our neighbouring planet Mars, as it was observed shortly before opposition in 2016 by the NASA/ESA Hubble Space Telescope. Some prominent features on the surface of the planet have been annotated.
Some of the more prominent features in the Hubble photo of Mars are marked here. Limb hazes are visible in modest-sized telescopes as a pale edging around the planet’s rim. The planet’s distinctive red color is created by rust. Billions of years ago, it’s thought that ultraviolet light from the Sun split water in the Martian atmosphere into hydrogen and oxygen. The hydrogen escaped, but the oxygen combined with iron in the planet’s surface rocks to form iron oxide or rust. Many of Earth’s red rock formations are similarly “oxidized.” Credit: NASA/ESA

The orange area in the center of the image is Arabia Terra, a vast upland region. The landscape is densely cratered and heavily eroded, indicating that it could be among the oldest features on the planet.
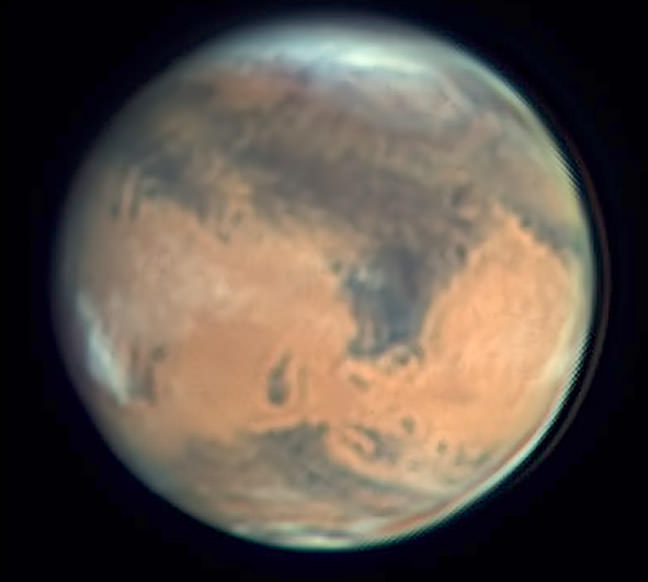
While the polar caps aren't currently visible, telescope users will be treated to nice views of India-shaped Syrtis Major. The large crater Hellas at the top (south) limb is currently covered in winter clouds. Credit: Christopher Go
While the polar caps aren’t currently visible, telescope users will be treated to nice views of India-shaped Syrtis Major. The large crater Hellas at the top (south) limb is currently covered in winter clouds. Credit: Christopher Go

South of Arabia Terra, running east to west along the equator, is the long dark feature named Sinus Sabaeus that terminates in a larger, dark blob called and Sinus Meridiani. These darker regions are covered by bedrock from ancient lava flows and other volcanic features. An extended blanket of clouds can be seen over the southern polar cap where it’s late winter. The icy northern polar cap has receded to a comparatively small size because it’s now late summer in the northern hemisphere.
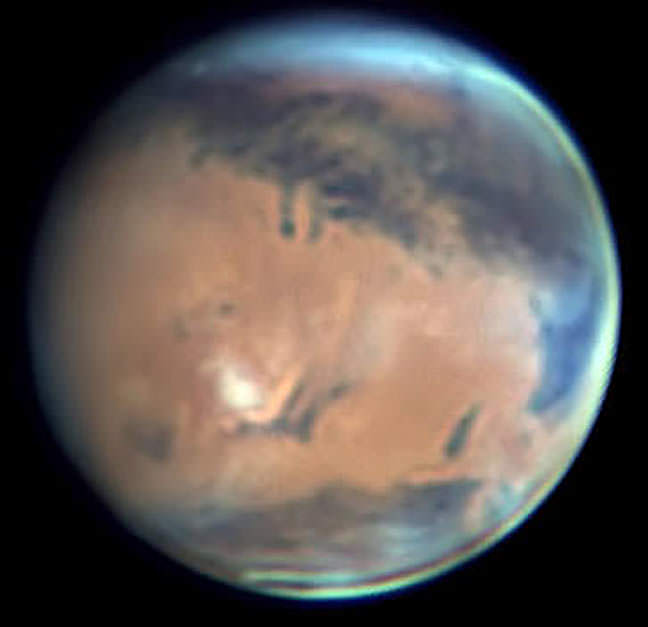
Mars on May 2 shows Syrtis Major off to the east (right). Crossing the top of the photo are Mare Tyrrhenum to the right of the planet's central meridian and Mare Cimmerium, to the left. Credit: Christopher Go
Mars on May 2 shows Syrtis Major off to the east (right). Crossing the top of the photo are Mare Tyrrhenum to the right of the planet’s central meridian and Mare Cimmerium, to the left. Credit: Christopher Go

So the question now is how much will you see as we pull up alongside the Red Planet this weekend? With the naked eye, Mars looks like a fiery “star” in the head of Scorpius the scorpion not far from the similarly-colored Antares, the brightest star in the constellation. It’s unmistakable. Even through the haze it caught my eye last night, rising in the southeast around 10 o’clock with its signature hue.

Through a 4-inch or larger telescope, you can see limb hazes/clouds and prominent dark features such as Syrtis Major, Utopia, clouds over Hellas, Mare Tyrrhenum (to the west of Syrtis Major) and Mare Cimmerium (west of M. Tyrrhenum).
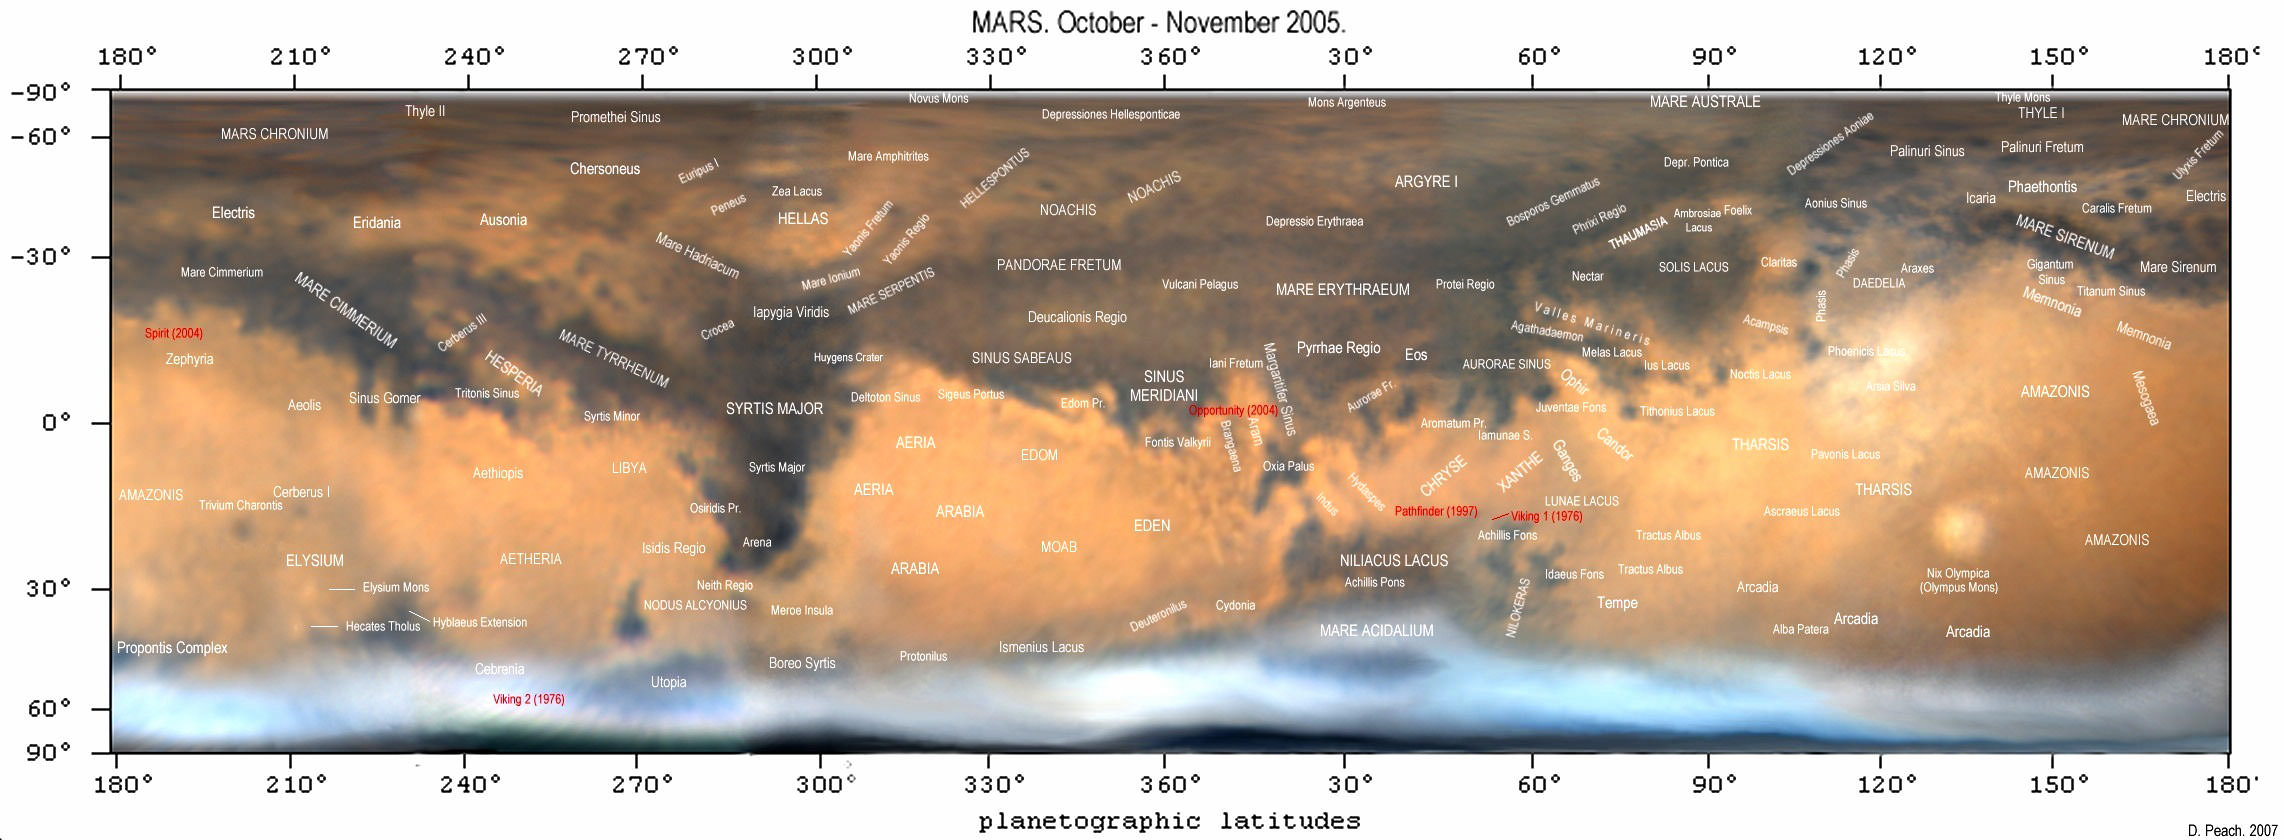
Expert imager Damian Peach created this photographic map of Mars labeled with its most prominent features visible in amateur telescopes. Click for a larger version. Credit: Damian Peach
Expert astroimager Damian Peach created this photographic map of Mars labeled with its most prominent features visible in amateur telescopes. Click for a large version. Credit: Damian Peach

These features observers across the America will see this week and early next between about 11 p.m. and 2 a.m. local time. As Mars rotation period is 37 minutes longer than Earth’s, these markings will gradually rotate out of view, and we’ll see the opposite hemisphere in the coming weeks. You can use the map to help you identify particular features or Sky & Telescope’s handy Mars Profiler to know which side of the planet’s visible when.
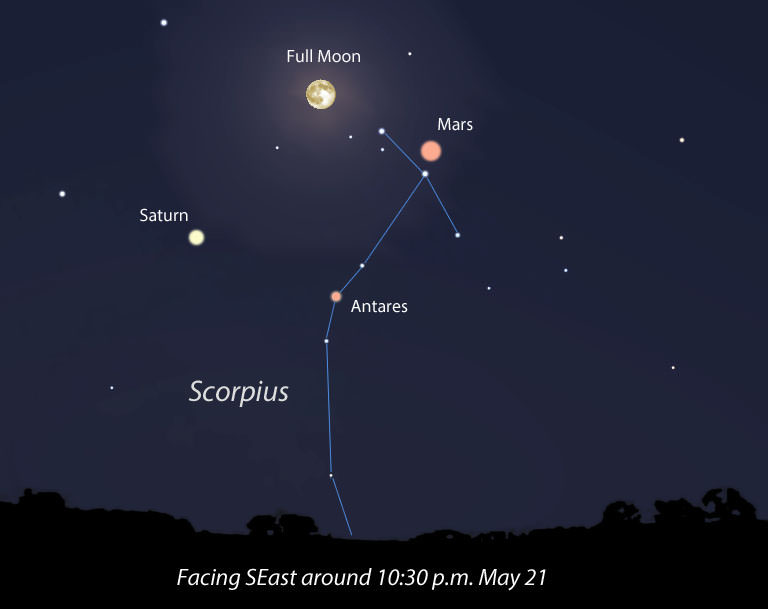
The Full Moon, Mars only hours before opposition, Saturn and Antares gather in the southern sky for a special, diamond-shaped grouping. Diagram: Bob King, source: Stellarium

To top off all the good stuff happening with Mars, the Full Flower Moon will join up with that planet, Saturn and Antares Saturday night May 21 to create what I like to call a “diamond of celestial lights” visible all night. Don’t miss it!

Italian astronomer Gianluca Masi will offer up two online Mars observing sessions in the coming week, on May 22 and 30, starting at 5 p.m. CDT (22:00 UT). Yet another opportunity to get acquainted with your inner Mars.

New Horizons Sends Back First Science On Distant Kuiper Belt Object

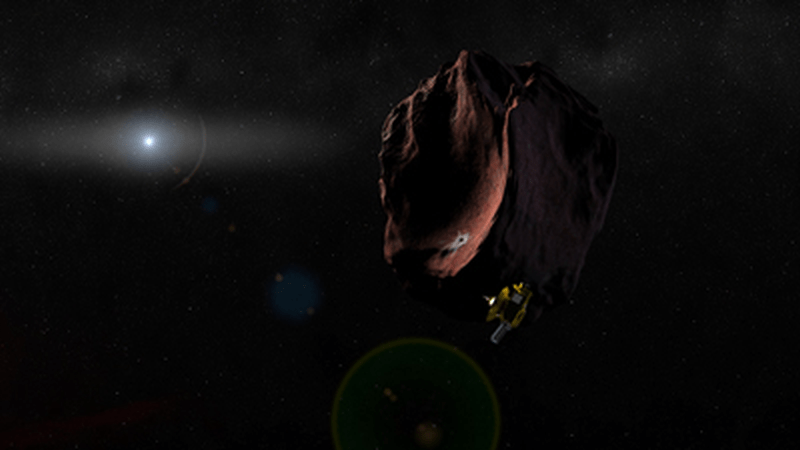
This artist's impression shows the New Horizons spacecraft encountering a Pluto-like object in the distant Kuiper Belt. (Credit: NASA/Johns Hopkins University Applied Physics Laboratory/Southwest Research Institute/Steve Gribben)

Even the most curmudgeonly anti-space troll has to admit that the New Horizons mission to Pluto has been an overwhelming success.

It’s not like New Horizons discovered life or anything, but it did bring an otherwise cold, distant lump to life for humanity. Vivid images and detailed scientific data revealed Pluto as a dynamic, changing world, with an active surface and an atmosphere. And we haven’t even received all of the data from New Horizons’ mission to Pluto yet.

Fresh off its historic visit to Pluto, New Horizons is headed for the Kuiper Belt, and just sent back its first science on one of the denizens of the distant belt of objects. The target in this case is 1994 JR1, a 145 km (90 mi.) wide Kuiper Belt Object (KBO). that orbits the Sun at a distance greater than 5 billion km. (3 billion mi.) New Horizons has now observed 1994 JR1 twice, and the team behind the mission has garnered new insights into this KBO based on these observations.

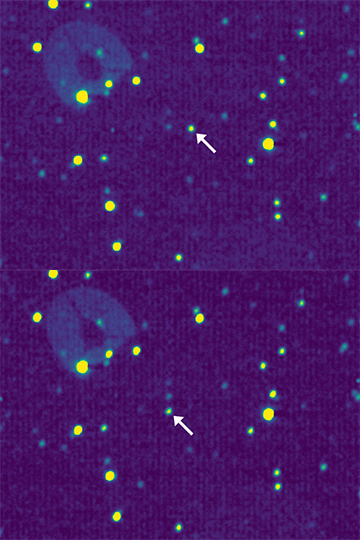
The spacecraft’s Long Range Reconnaissance Imager (LORRI) captured images of 1994 JR1 on April 7th-8th from a distance of 111 million km. (69 million mi.). That’s far closer than the images New Horizons captured in November 2015 from a distance of 280 million km (170 million miles).

This image, taken with the LORRI instrument aboard New Horizons, shows 2 of the 20 images captured in April. The moving dots are 1994 JR1, shown against a backdrop of stationary stars. The circular object in the top left of the image is a reflective artifact of the camera itself, showing LORRI's three support arms. Image: NASA/Johns Hopkins University Applied Physics Laboratory/Southwest Research Institute
This image, taken with the LORRI instrument aboard New Horizons, shows 2 of the 20 images captured in April. The moving dots are 1994 JR1, shown against a backdrop of stationary stars. The circular object in the top left of the image is a reflective artifact of the camera itself, showing LORRI’s three support arms. Image: NASA/Johns Hopkins University Applied Physics Laboratory/Southwest Research Institute

New Horizons science team member Simon Porter, of the Southwest Research Institute (SwRI) in Boulder Colorado, commented on the importance of these images. “Combining the November 2015 and April 2016 observations allows us to pinpoint the location of JR1 to within 1,000 kilometers (about 600 miles), far better than any small KBO,” Porter said.

Porter added that this accurate measurement of the KBO’s orbit allows New Horizons science team members to quash the idea that JR1 is a quasi-satellite of Pluto.

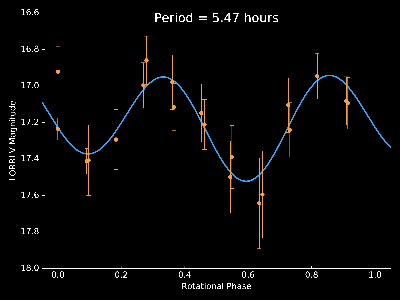
The team was also able to determine, by measuring the light reflected from the surface, that JR1’s rotational period is only 5.4 hours. That’s fast for a KBO. John Spencer, another New Horizons science team member from SwRI, said “This is all part of the excitement of exploring new places and seeing things never seen before.”

Variations in the brightness of light reflected from the  surface of 1994 JR1 allowed science team members to pinpoint the object's  rotation period at 5.4 hours.    Credit: NASA/Johns Hopkins University Applied Physics Laboratory/Southwest Research Institute
Variations in the brightness of light reflected from the surface of 1994 JR1 allowed science team members to pinpoint the object’s rotation period at 5.4 hours.
Credit: NASA/Johns Hopkins University Applied Physics Laboratory/Southwest Research Institute

KBOs are ancient remnants of the early days of the Solar System. Whereas the inner regions of the Solar System were largely swept clean as the planets formed, the Kuiper Belt remained mostly as it is, untouched by the gravity of the planets.

There are trillions of objects in this cold, distant part of the Solar System. The Kuiper Belt itself spans a distance that is 30 to 50 times greater than the distance from the Earth to the Sun. It’s similar to the asteroid belt between Mars and Jupiter, but Kuiper Belt objects are icy, whereas asteroid belt objects are rocky, for the most part.

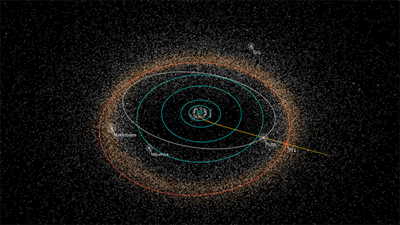
The New Horizons team has requested a mission extension, and if that extension is approved, the target is already chosen. In August 2015, NASA selected the KBO 2014 MU69, which resides in an orbit almost a billion miles beyond Pluto. There were two potential destinations for the spacecraft after it departed Pluto, and 2014 MU69 was recommended by the New Horizons team, and chosen by NASA.

If New Horizons' mission is extended, this is the path it will take to its next destination, 2014 MU69. (Credit: NASA/Johns Hopkins University Applied Physics Laboratory/Southwest Research Institute/Alex Parker)
If New Horizons’ mission is extended, this is the path it will take to its next destination, 2014 MU69. (Credit: NASA/Johns Hopkins University Applied Physics Laboratory/Southwest Research Institute/Alex Parker)

Choosing New Horizons’ next target early was important for fuel use. Fuel conservation allows the spacecraft to perform the maneuvers necessary to reach 2014 MU69. If all goes well, New Horizons should reach its next target by January 2019.

According to Alan Stern, New Horizons Principal Investigator, there are good reasons to visit 2014 MU69. “2014 MU69 is a great choice because it is just the kind of ancient KBO, formed where it orbits now, that the Decadal Survey desired us to fly by,” he said. “Moreover, this KBO costs less fuel to reach [than other candidate targets], leaving more fuel for the flyby, for ancillary science, and greater fuel reserves to protect against the unforeseen.”

The Decadal Survey in 2003 strongly recommended that flybys of Pluto and small KBOs should be conducted. The KBO is an unexplored region, and these flybys will allow us to sample the diversity of objects in the belt.

If New Horizons makes it to its next target, 2014 MU69, and delivers the types of results it has so far in its journey, it will be an unprecedented success. The kind of success that will make it harder and harder to be a curmudgeonly anti-space troll.

Wait. Who am I kidding.

Haters gonna hate.

30 km Wide Asteroid Impacted Australia 3.4 Billion Years Ago

This is an artist’s depiction of a 10-kilometer (6-mile) diameter asteroid striking the Earth. New evidence in Australia suggests an asteroid 2 to 3 times larger than this struck Earth early in its life. Credit: Don Davis/Southwest Research Institute.

New evidence found in northwestern Australia suggests that a massive asteroid, 20 to 30 kilometres in diameter, struck Earth about 3.5 billion years ago. This impact would have dwarfed anything experienced by humans, and dinosaurs, releasing as much energy as millions of nuclear weapons. Impacts this large can trigger earthquakes and tsunamis, and change the geological history of Earth.

The evidence was uncovered by Andrew Glikson and Arthur Hickman from the Australian National University. While drilling for the Geological Survey of Western Australia, the two obtained drilling cores from some of the oldest known sediments on Earth. Sandwiched between two layers of sediment were tiny glass beads called spherules, which were formed from vaporized material from the asteroid impact.

Impact spherules formed from material vaporized by an asteroid impact. Image: A. Glikson/Australian National University

The enormity of this impact cannot be overstated. “The impact would have triggered earthquakes orders of magnitude greater than terrestrial earthquakes, it would have caused huge tsunamis and would have made cliffs crumble,” said Dr. Glikson, from the ANU Planetary Institute.

This asteroid impact is the second oldest one that we know of. It is also one of the largest found yet, and at 20 to 30 kilometers in diameter, it is 2 the 3 times the size of the famous Chicxulub asteroid that struck the Yucatan in Mexico. That impact is thought to be responsible for ending the age of dinosaurs on Earth.

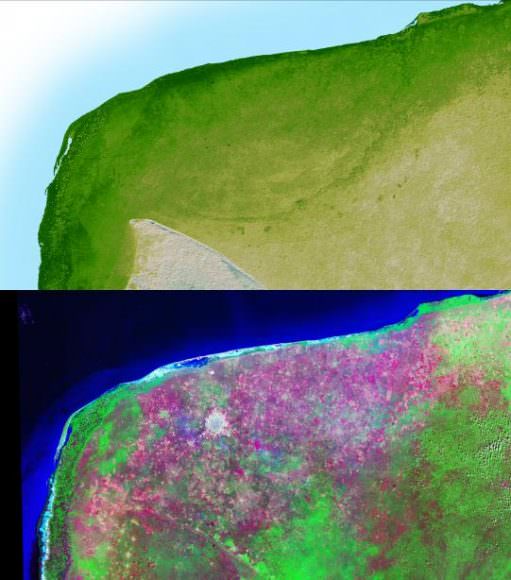
This image shows a very faint circular outline of the Chicxulub crater. After 65 million years, it is barely visible. All evidence of craters billions of years old would now be gone. Image: NASA/JPL

The crater itself would have been hundreds of kilometers in diameter, though all traces of it are now gone. “Exactly where this asteroid struck the earth remains a mystery,” Dr. Glikson said. “Any craters from this time on Earth’s surface have been obliterated by volcanic activity and tectonic movements.”

“Material from the impact would have spread worldwide. These spherules were found in sea floor sediments that date from 3.46 billion years ago,” said Glikson.

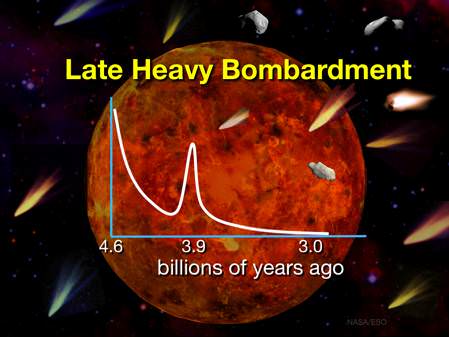
At 3.46 billion years ago, this puts this impact event close to a period of time 4.1 to 3.8 billion years ago known as the Late Heavy Bombardment. This was a period of time when a disproportionate number of asteroids struck the Earth and the Moon, and probably Mercury, Venus, and Mars, too. The Late Heavy Bombardment was probably caused by the gas giants in our Solar System. As these planets migrated, their gravity caused enormous disruption, pulling objects in the asteroid belt and the Kuiper Belt into trajectories that sent them towards the inner Solar System.

The Late Heavy Bombardment is thought to be a period of time when the Earth, and the rest of the bodies in the inner Solar System, were repeatedly struck by asteroids. Image: NASA/ESA

The surfaces of Mercury and the Moon are covered in impact craters. Samples of rock from the lunar surface, brought back to Earth by the Apollo astronauts, have been subjected to isotopic dating. Their age is constrained to a fairly narrow band of time, corresponding to the Late Heavy Bombardment. Obviously, the Earth would have been subjected to the same thing. But on geologically active Earth, most traces of impact events have been erased. It’s the sediment that hints at these events.

Australia is geologically ancient, and contains some of the most ancient rocks on Earth. Glikson and Hickman found the glass spherules in cores while drilling at Marble Bar in north-western Australia. Because the sediment layer containing the spherules was preserved between two volcanic layers, its age was determined with great precision.

The sediments at Marble Bar, north-western Australia, where the spherules were found. Image: A Glikson/Australian National University

For over 20 years, Dr. Glikson has been searching for evidence of asteroid impacts. When these glass beads were found in the core samples, he suspected an asteroid impact. Testing confirmed that the levels of elements such as platinum, nickel and chromium, matched those in asteroids.

This is not the first evidence of impact events that Glikson has uncovered. In 2015, Glikson discovered evidence of another massive asteroid strike in the Warburton Basin in Central Australia. At that site, buried in the crust 30 kilometers deep, in rock that is 300 to 500 million years old, Glikson found evidence of a double impact crater covering an area 400 kilometers wide.

This crater was believed to be the result of an asteroid that broke into two before slamming into Earth. “The two asteroids must each have been over 10 kilometers (6.2 miles) across — it would have been curtains for many life species on the planet at the time,” said Glikson.

“There may have been many more similar impacts, for which the evidence has not been found, said Dr. Glikson. “This is just the tip of the iceberg. We’ve only found evidence for 17 impacts older than 2.5 billion years, but there could have been hundreds.”

Finding the sites of ancient impacts is not easy. Advances in satellite imaging helped locate and pinpoint the Chicxulub crater, and others. If there have been hundreds of enormous asteroid impacts, like Dr. Glikson suggests, then they would have had an equally enormous impact on Earth’s evolution. But pinpointing these sites remains elusive.

Haumean Moons Deepen The Dwarf Planet Mystery

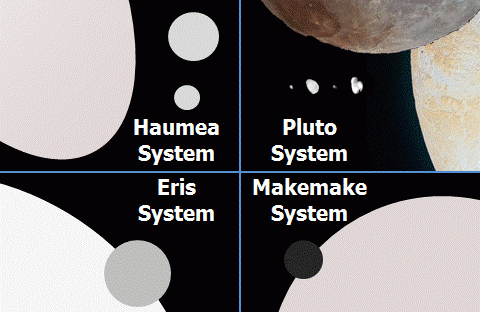
This image shows the moons of our Solar System's four icy dwarf planets. Pluto and Haumea have been considered as cousin planets because it's thought that their moons were formed in collisions. A new study focussed on Haumea's moons raises some interesting questions. Image: D. Ragozzine (FIT)/NASA/JHU/SwRI

The dwarf planets in our Solar System are some of the most interesting objects around. Of course, all of the Solar System objects–and anything in nature, really–are fascinating when you really focus on them. Now, a new study puts the focus squarely on the dwarf planet Haumea, and deepens the mystery surrounding its origins.

Dwarf planets Pluto and Haumea are considered cousins. Both of them, and their respective moons, are thought to be collisional families. This means they have a common origin in the form of an impact event. But the study, from Luke D. Burkhart, Darin Ragozzine, and Michael E. Brown, shows that Haumea doesn’t have the same kinds of moons as Pluto, which has astronomers puzzling over Haumea’s origins.

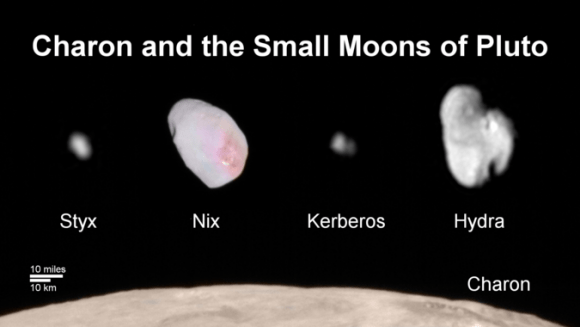
Pluto and Haumea are the only two bodies in the outer Solar System that have more than one Moon. Pluto has five moons (Charon, Styx, Nix, Kerberos, and Hydra) while Haumea has two moons, Hi’iaka and Namaka. Haumea is also the parent of a number of icy bodies which were parts of its surface, but now orbit the Sun on their own. The two other dwarf planets in the Kuiper Belt, Eris and Makemake, each have only one moon.

The five moons of Pluto. Image: NASA/JHUAPL/SwRI

One thing that differentiates Haumea from Pluto is Haumea’s family of small icy bodies that came from its surface. While Pluto has a number of small icy moons, Haumea’s icy bodies orbit the Sun independently, and are not moons. Other properties of Haumea, like its inordinately high rate of spin, make Haumea a very interesting object to study. They also differentiate Haumea from Pluto, and are leading to questions about the cousin relationship between the two. If they are indeed cousins, then shouldn’t they share the same formation method?

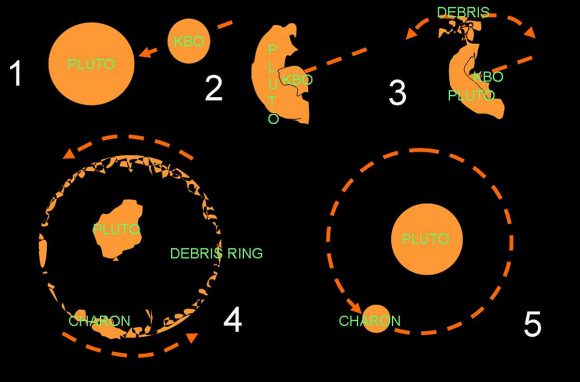
This shows how Pluto's moon Charon was created. 1: a Kuiper belt object approaches Pluto; 2: it impacts Pluto; 3: a dust ring forms around Pluto; 4: the debris aggregates to form Charon; 5: Pluto and Charon relax into spherical bodies. It's thought that the same collision created Pluto's other Moons as well. Image: Acom, Public Domain.
This shows how Pluto’s moon Charon was created. 1: a Kuiper belt object approaches Pluto; 2: it impacts Pluto; 3: a dust ring forms around Pluto; 4: the debris aggregates to form Charon; 5: Pluto and Charon relax into spherical bodies. It’s thought that the same collision created Pluto’s other Moons as well. Image: Acom, Public Domain.

Haumea’s lack of icy moons similar to Pluto’s was noted by researcher Darin Ragozzine. “While we’ve known about Pluto’s and Haumea’s moons for years, we now know that Haumea does not share tiny moons like Pluto’s, increasing our understanding of this intriguing object,” Ragozzine said.

There are definite similarities between Pluto and Haumea, but this study suggests that the satellite systems of the icy cousins, or former cousins, formed differently. “There is no self-consistent formation hypothesis for either set of satellites,” said Ragozzine.

Two things were at the heart of this new study. The first is the workhorse Hubble Space Telescope. In 2010, the Hubble focussed on Haumea, and captured 10 consecutive orbits to try to understand its family of satellites better.

The second thing at the heart of the study is called a “non-linear shift and stack method.” This is a novel technique which allows the detection of extremely faint and distant objects. When used in this study, it specifically ruled out the existence of small moons like the ones that orbit Pluto. This method may allow for future detection of other moons and Kuiper Belt Objects.

The study itself outlines some of Haumea’s properties that make it such an object of fascination for astronomers. It’s the fastest-rotating large body in the Solar System. In fact it rotates so quickly, that it’s near the rate at which the dwarf planet would break up. Haumea also has an unexpectedly high density, and a high albedo resulting from a surface of water ice. It’s two moons are in dynamically excited orbits, and its family of icy fragments is not near as dispersed as it should be. As the paper says, “There is no simple high-probability formation scenario that naturally explains all of these observational constraints.”

In the paper, the authors emphasize the puzzling nature of Haumea’s formation. To quote the paper, “Though multiple explanations and variations have been proposed, none have adequately and self-consistently explained all of the unique features of this interesting system and its family.”

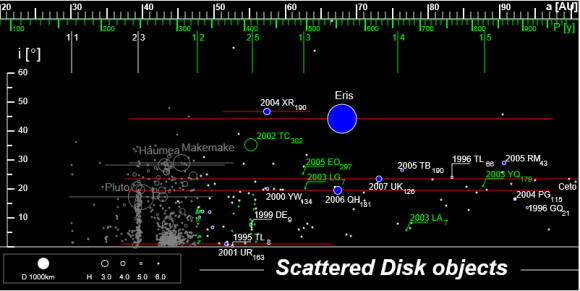
The semi-major axes and inclinations of all known scattered-disc objects (in blue) up to 100 AU together with Kuiper-belt objects (in grey) and resonant objects (in green). The eccentricity of the orbits is represented by segments (extending from the perihelion to the aphelion) with the inclination represented on Y axis. Image: EuroCommuter http://creativecommons.org/licenses/by-sa/3.0/

Some of the explanations proposed in other studies include a collision between objects in the scattered disk, which overlaps the Kuiper Belt and extends much further, rather than objects in the Kuiper Belt itself. Another proposes that Haumea’s two largest moons–Hi’iaka and Namaka–are themselves second generation moons formed from the breakup of a progenitor moon.

Though the study shows that the Pluto system and the Haumea system, erstwhile cousins in the Solar System, have followed different pathways to formation, it also concludes that a collision was indeed the main event for both dwarf planets. But what happened after that collision, and where exactly those collisions took place, are still intriguing questions.

ESA Regrets Not Buying Windshield Insurance

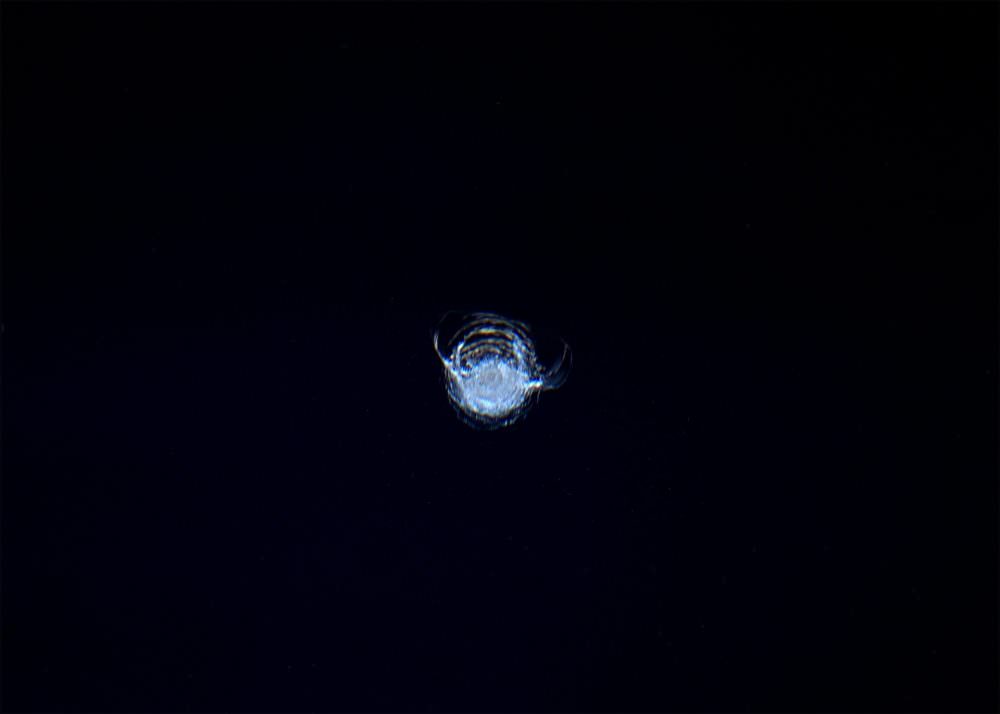
The chip in the ISS' Cupola window, photographed by astronaut Tim Peake. Credit: ESA/NASA/Tim Peake

It is known as the Cupola, an observation and work area that was installed aboard the International Space Station in 2010. In addition to giving the crew ample visibility to support the control of the Station’s robotic arms, it is also the best seat in the house when it comes to viewing Earth, celestial objects and visiting vehicles. Little wonder then why sp many breathtaking pictures have been taken from inside it over the years.

So you can imagine how frustrating it must be for the crew when a tiny artificial object (aka. space debris) collides with the Cupola’s windows and causes it to chip. And thanks to astronaut Tim Peake and a recent photo he chose to share with the world, people here on Earth are able to see just how this looks from the receiving end for the first time.

Continue reading “ESA Regrets Not Buying Windshield Insurance”

Japanese 3D Galaxy Map Confirms Einstein Was One Smart Dude

An international team of researchers have produced the largest 3-D map of the universe to date, which validates Einstein's theory of General Relativity. Credit: NAOJ/CFHT/ SDSS

On June 30th, 1905, Albert Einstein started a revolution with the publication of theory of Special Relativity. This theory, among other things, stated that the speed of light in a vacuum is the same for all observers, regardless of the source. In 1915, he followed this up with the publication of his theory of General Relativity, which asserted that gravity has a warping effect on space-time. For over a century, these theories have been an essential tool in astrophysics, explaining the behavior of the Universe on the large scale.

However, since the 1990s, astronomers have been aware of the fact that the Universe is expanding at an accelerated rate. In an effort to explain the mechanics behind this, suggestions have ranged from the possible existence of an invisible energy (i.e. Dark Energy) to the possibility that Einstein’s field equations of General Relativity could be breaking down. But thanks to the recent work of an international research team, it is now known that Einstein had it right all along.

Continue reading “Japanese 3D Galaxy Map Confirms Einstein Was One Smart Dude”

Rock Around the Comet Clock with Hubble

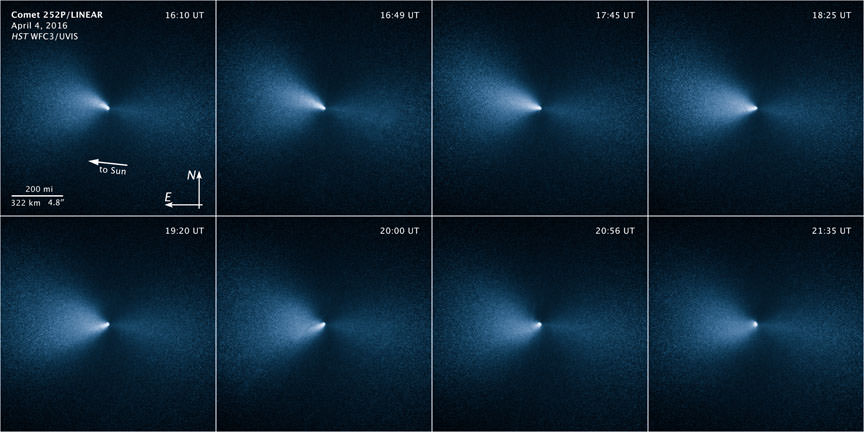
Views of the rotating jet in comet 252P/LINEAR on April 4, 2016. Credit: Credit: NASA, ESA, and J.-Y. Li (Planetary Science Institute)
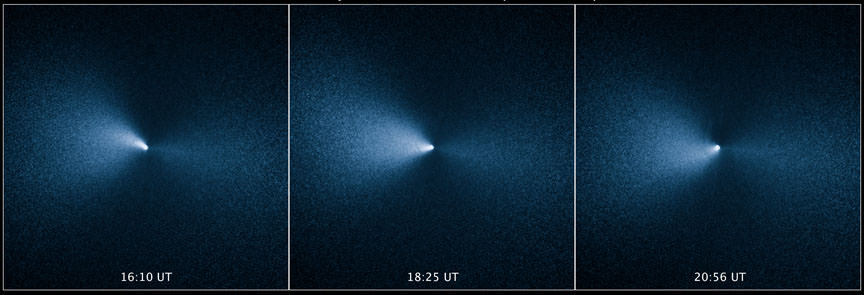
These photos, taken on April 4, 2016 over the span of 4 1/2 hours, reveal a narrow, well-defined jet of dust ejected by the comet's icy nucleus. With a diameter of only about a mile, the nucleus is too small for Hubble to see. The jet is illuminated by sunlight and changes direction like the hour hand on a clock as the comet spins on its axis. Credit: NASA, ESA, and J.-Y. Li (Planetary Science Institute)
These photos, taken on April 4, 2016 over the span of 4 1/2 hours, reveal a narrow, well-defined jet of dust ejected by the comet’s icy nucleus. With a diameter of only about a mile, the nucleus is too small for Hubble to see. The jet is illuminated by sunlight and changes direction like the hour hand on a clock as the comet spins on its axis. Credit: NASA, ESA, and J.-Y. Li (Planetary Science Institute)

Remember 252P/LINEAR? This comet appeared low in the morning sky last month and for a short time grew bright enough to see with the naked eye from a dark site. 252P swept closest to Earth on March 21, passing just 3.3 million miles away or about 14 times the distance between our planet and the moon. Since then, it’s been gradually pulling away and fading though it remains bright enough to see in small telescope during late evening hours.

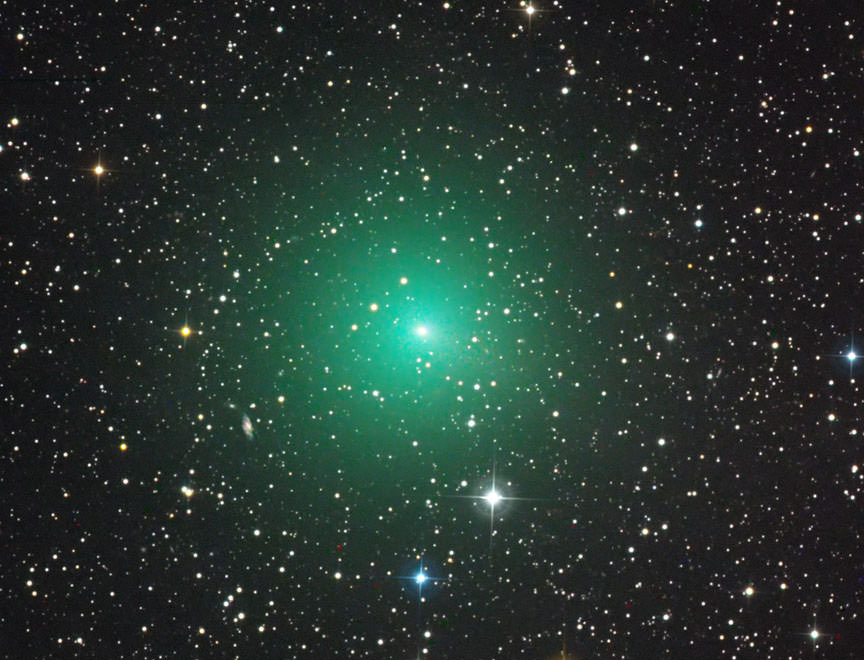
252P LINEAR looks like a big fuzzy ball in this photo taken on April 30. The comet is located in Ophiuchus and rises in the eastern sky at nightfall. At this scale, the jet shown in the Hubble photos is too tiny to see. See map below to find the comet yourself. Credit: Rolando Ligustri

While amateurs set their clocks to catch the comet before dawn, astronomers using NASA’s Hubble Space Telescope captured close-up photos of it two weeks after closest approach. The images reveal a narrow, well-defined jet of dust ejected by the comet’s fragile, icy nucleus spinning like a water jet from a rotating lawn sprinkler. These observations also represent the closest celestial object Hubble has observed other than the moon.

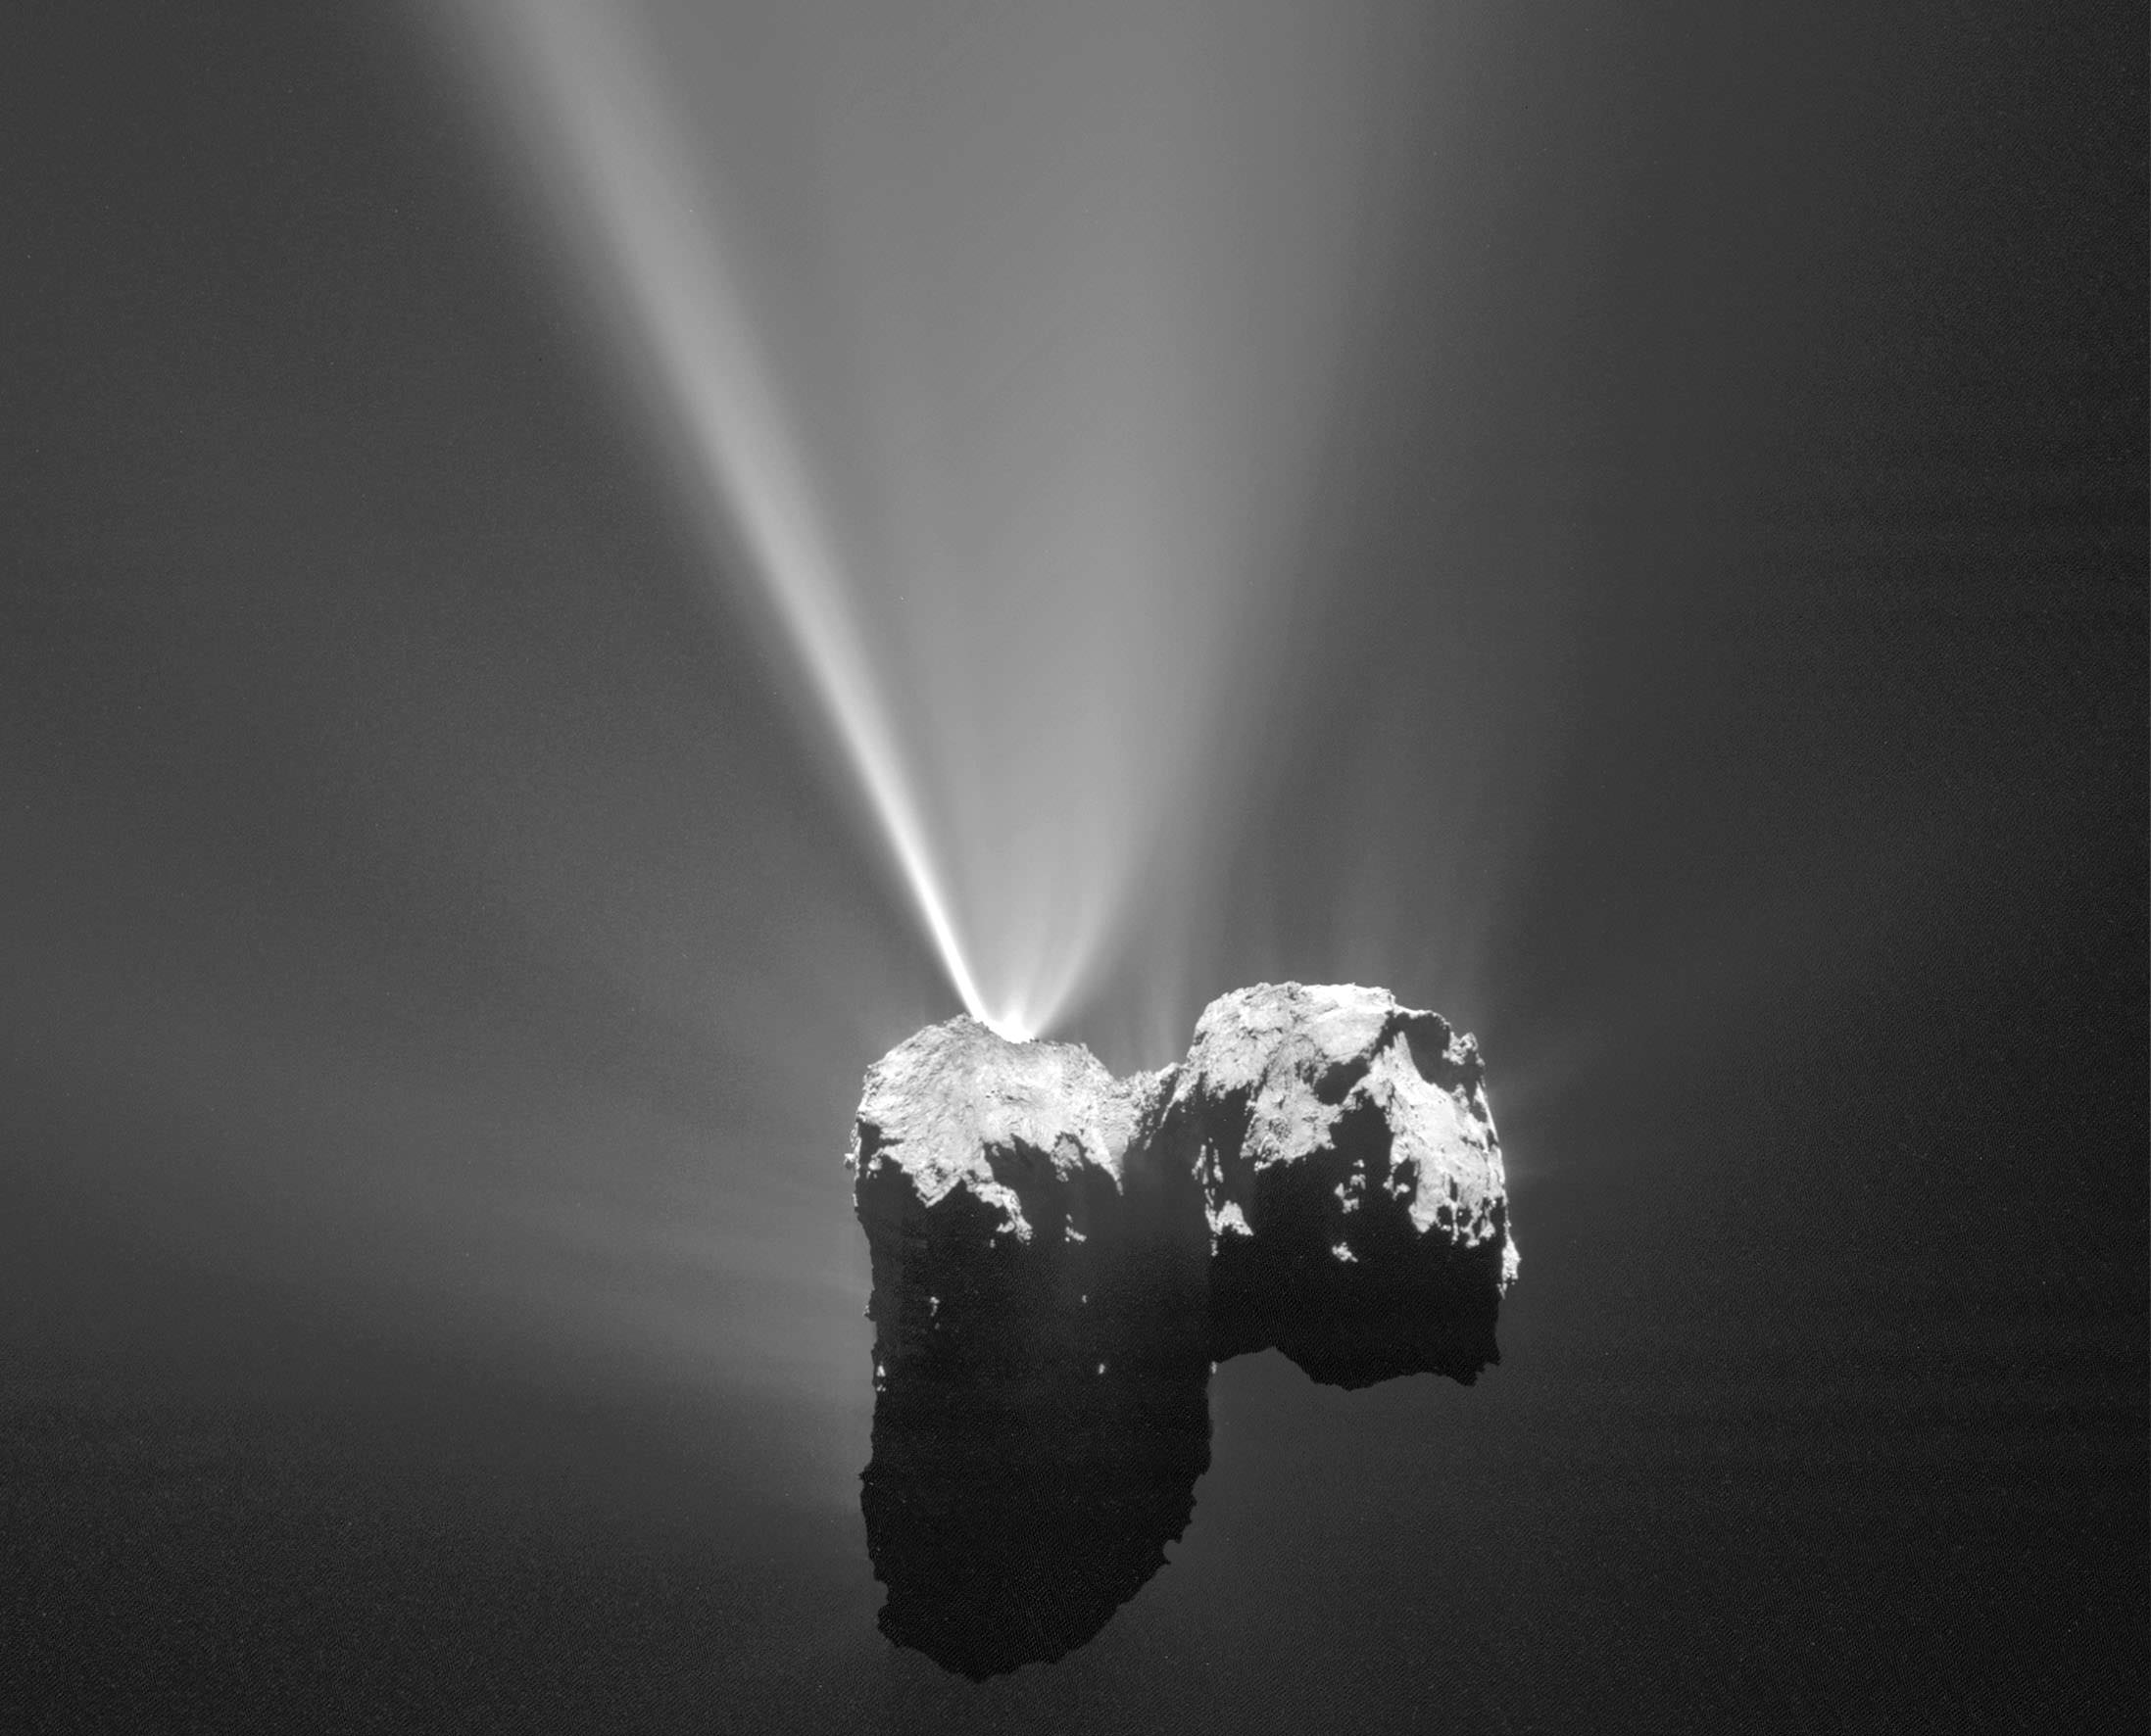
Want to get a good look at a comet's tiny nucleus and its jets of vapor and dust? Get up close in the spaceship. This photo was taken by the European Space Agency's Rosetta probe which has been orbiting Comet 67P/Churyumov-Gerasimenko since the fall of 2014. Credit: ESA
Want to get a good look at a comet’s tiny nucleus and its jets of vapor and dust? Get up close in the spaceship. This photo was taken by the European Space Agency’s Rosetta probe which has been orbiting Comet 67P/Churyumov-Gerasimenko since the fall of 2014. Credit: ESA

Sunlight warms a comet’s nucleus, vaporizing ices below the surface. In a confined space, the pressure of the vapor builds and builds until it finds a crack or weakness in the comet’s crust and blasts into space like water from a whale’s blowhole. Dust and other gases go along for the ride. Some of the dust drifts back down to coat the surface, some into space to be shaped by the pressure of sunlight into a dust tail.

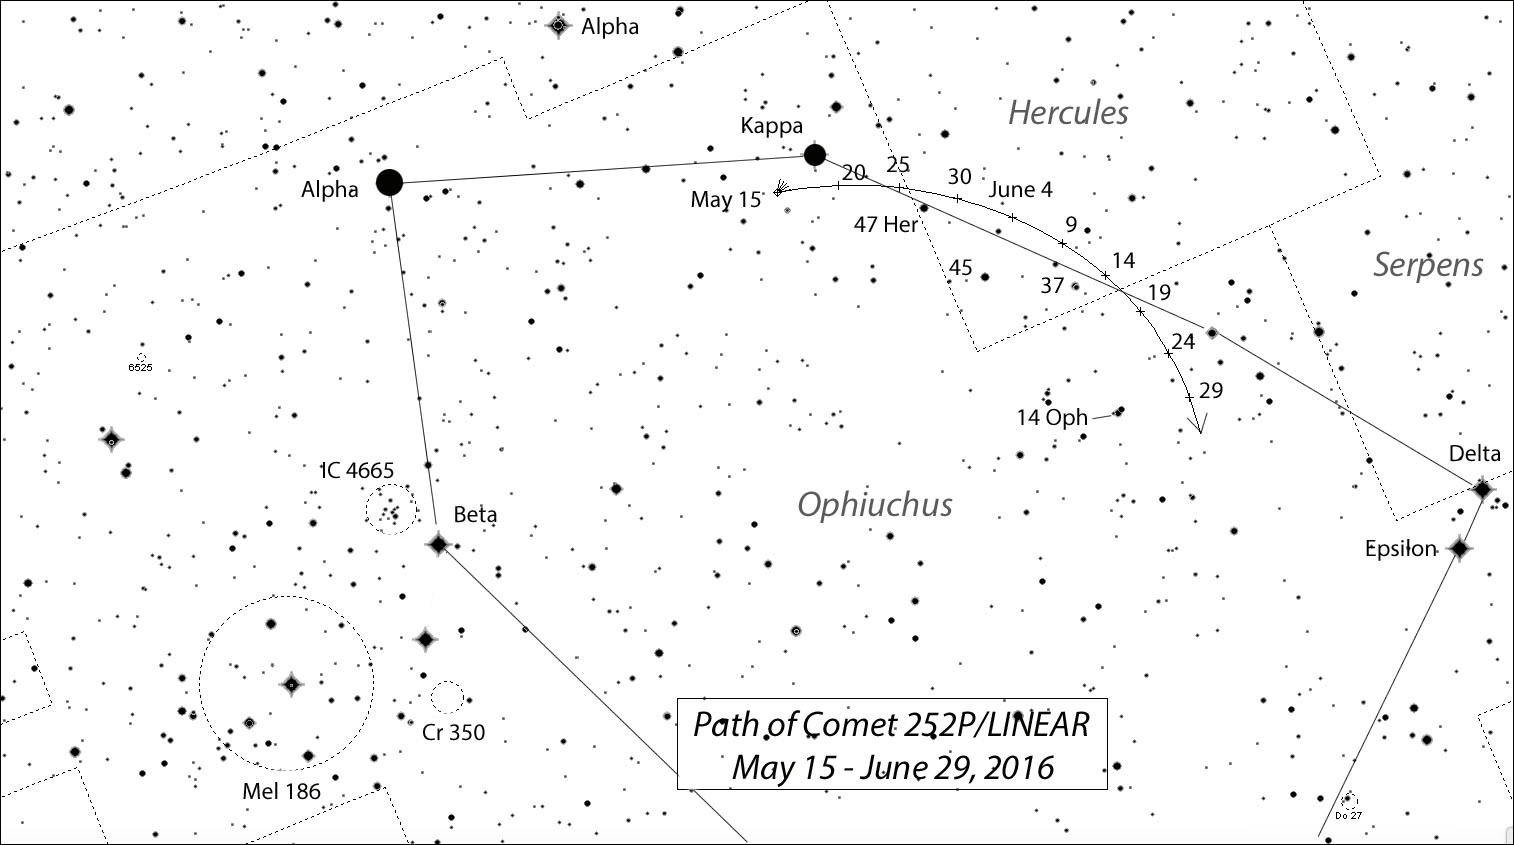
This map shows the path -- marked off every five nights -- of 252P/LINEAR along the border of Ophiuchus and Hercules through the end of June. Bright stars are labeled by Greek letter or number. Stars shown to magnitude 8.5. Diagram: Bob King, source: Chris Marriott's SkyMap
This map shows the path — marked off every five nights at 11:30 p.m. CDT (4:30 UT) — of 252P/LINEAR along the border of Ophiuchus and Hercules through the end of June. Bright stars are labeled by Greek letter or number. Stars shown to magnitude 8.5. Click to enlarge. Diagram: Bob King, source: Chris Marriott’s SkyMap

You can still see 252P/LINEAR if you have a 4-inch or larger telescope. Right now it’s a little brighter than magnitude +9 as it slowly arcs along the border of Ophiuchus and Hercules. With the moon getting brighter and brighter as it fills toward full, tonight and tomorrow night will be best for viewing the comet. After that you’re best to wait till after the May 21st full moon when darkness returns to the evening sky. 252P will spend much of the next couple weeks near the 3rd magnitude star Kappa Ophiuchi, a convenient guidepost for aiming your telescope in the comet’s direction.

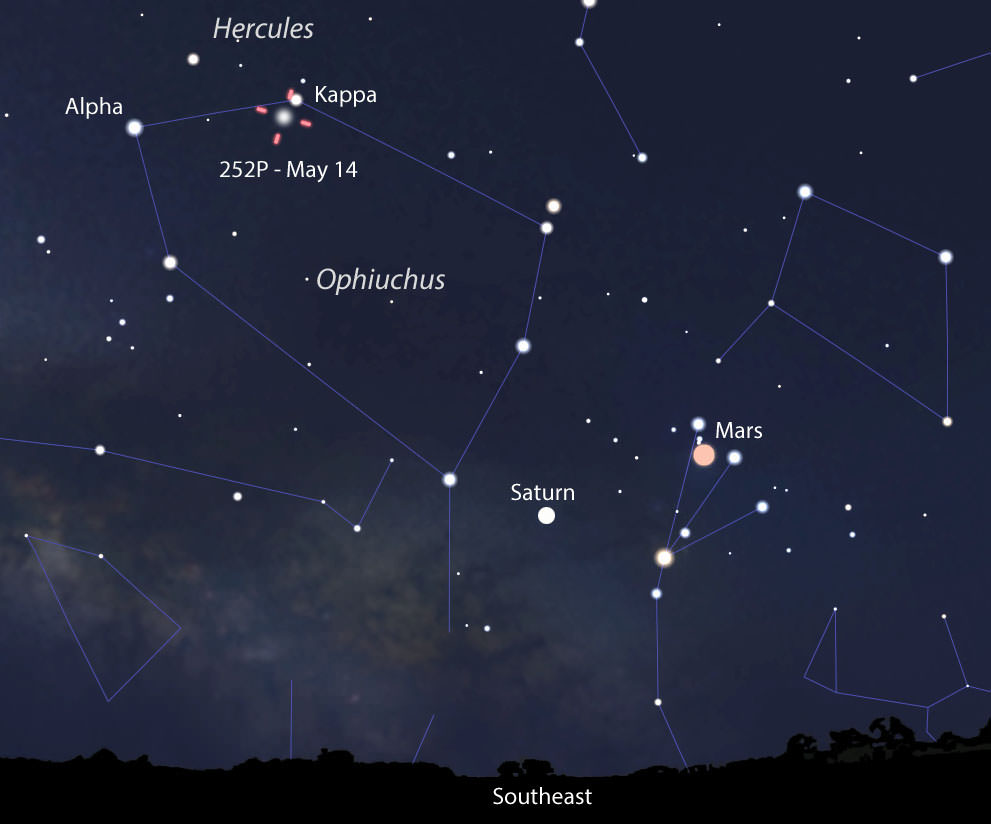
Orient yourself on the comet's location by using this map, which shows the sky facing southeast around 11-11:30 p.m. local daylight time in mid-May. Mars and Saturn are excellent guides to help you find Kappa Oph, located very near the comet. Diagram: Bob King , source: Stellarium
Get oriented on where to look for the comet by first using this map, which shows the sky facing southeast around 11-11:30 p.m. local daylight time in mid-May. Mars and Saturn make excellent guides to help you find Kappa Oph, located very near the comet. Diagram: Bob King , source: Stellarium

While you probably won’t see any jets in amateur telescopes, they’re there all the same and helped created this comet’s distinctive and large, fuzzy coma. Happy hunting!

The full sequence of images of the spinning jet in 252P/LINEAR seen by Hubble. Credit: NASA, ESA, and Z. Levay (STScI)


Super Secret X-37B Nears One Year In Orbit Doing ???

The X-37B Orbital Test Vehicle taxiing on the flightline on March 30th, 2010, at the Astrotech facility in Titusville, Florida. Credit: USAF

For years now, the program to develop the X-37B spacecraft has been shrouded in secrecy. Originally intended as part of a NASA project to develop a reusable unmanned spacecraft, this Boeing-designed spaceplane was taken over by the Department of Defense in 2004. And while it has been successfully tested on multiple occasions, there remain some unanswered questions as to its intended purpose and what has been taking place during these flights.

This, predictably, has lead to all kinds of rumors and speculation, with some suggesting that it could be a spy plane while others think that it is intended to deliver space-based weapons. It’s latest mission – which was dubbed OTV-4 (Orbital Test Vehicle-4) – has been especially clandestine. And after nearly a year in orbit, it remains unclear what the X37B has been doing up there all this time.

Continue reading “Super Secret X-37B Nears One Year In Orbit Doing ???”

Is Earth’s Magnetic Field Ready to Flip?

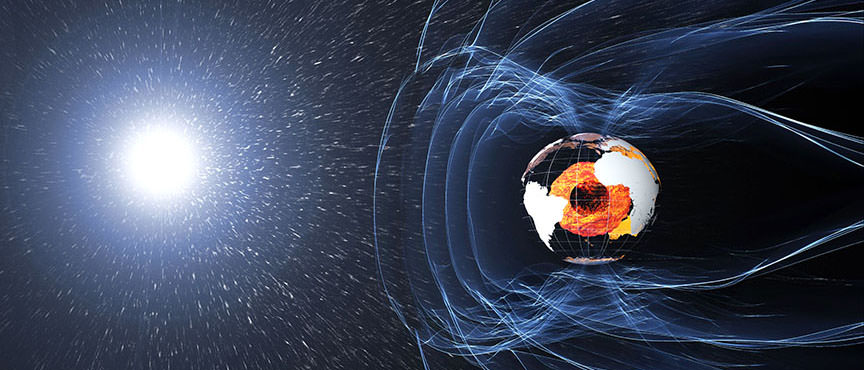
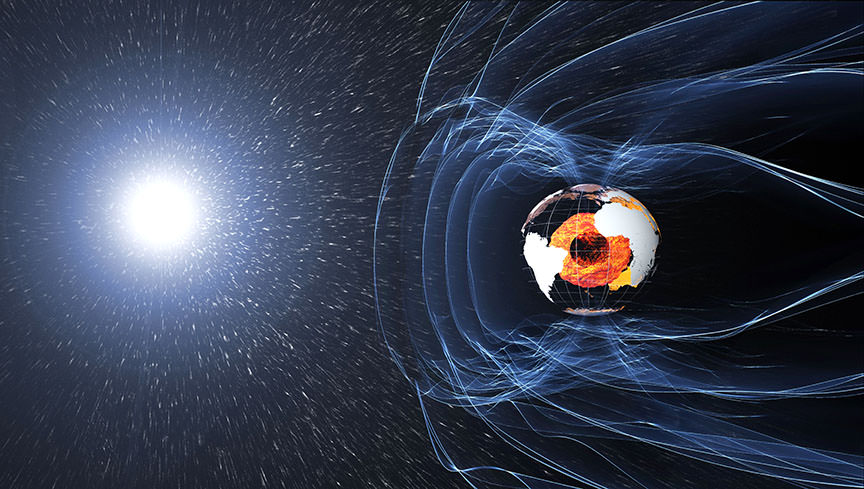
The magnetic field and electric currents in and around Earth generate complex forces that have immeasurable impact on every day life. The field can be thought of as a huge bubble -- called the magnetosphere --, protecting us from cosmic radiation and charged particles that bombard Earth in solar winds. Credit: ESA/ATG medialab
The magnetic field and electric currents in and around Earth generate complex forces that have immeasurable impact on every day life. The field can be thought of as a huge bubble -- called the magnetosphere -- protecting us from cosmic radiation and charged particles that bombard Earth in solar winds. Credit: ESA/ATG medialab
Illustration of the invisible magnetic field lines generated by the Earth. Unlike a classic bar magnet, the matter governing Earth's magnetic field moves around. The flow of liquid iron in Earth's core creates electric currents, which in turn creates the magnetic field. Credit and copyright: Peter Reid, University of Edinburgh
Illustration of the invisible magnetic field lines generated by the Earth. Unlike a classic bar magnet, the matter governing Earth’s magnetic field moves around. The flow of liquid iron in Earth’s core creates electric currents, which in turn creates the magnetic field. Credit and copyright: Peter Reid, University of Edinburgh

Although invisible to the eye, Earth’s magnetic field plays a huge role in both keeping us safe from the ever-present solar and cosmic winds while making possible the opportunity to witness incredible displays of the northern lights. Like a giant bar magnet, if you could sprinkle iron filings around the entire Earth, the particles would align to reveal the nested arcs of our magnetic domain. The same field makes your compass needle align north to south.

We can picture our magnetic domain as a huge bubble, protecting us from cosmic radiation and electrically charged atomic particles that bombard Earth in solar winds. Satellites and instruments on the ground keep a constant watch over this bubble of magnetic energy surrounding our planet. For good reason: it’s always changing.

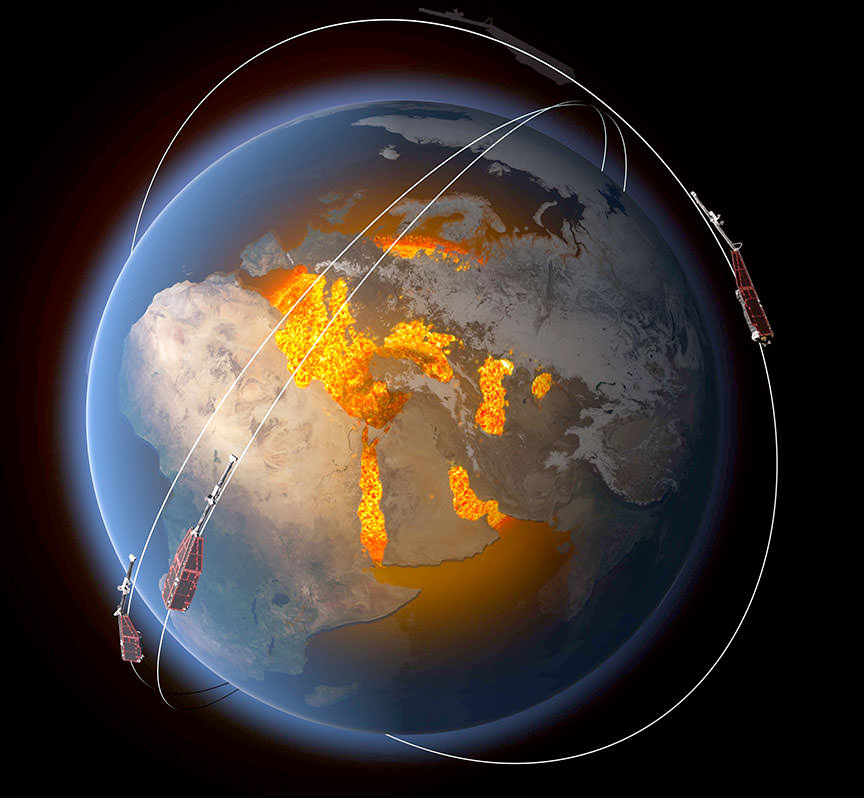
Earth's magnetic field is thought to be generated by an ocean of super-heated, swirling liquid iron that makes up its the outer core 1,860 miles (3000 kilometers) under our feet. Acting like the spinning conductor in one of those bicycle dynamos or generators that power lights, it generates electrical currents and a constantly changing electromagnetic field. Other sources of magnetism come from minerals in Earth’s mantle and crust, while the ionosphere, magnetosphere and oceans also play a role. The three Swarm satellites precisely identify and measure precisely these different magnetic signals. Copyright: ESA/ATG Medialab
Earth’s magnetic field is thought to be generated by an ocean of super-heated, swirling liquid iron that makes up its the outer core 1,860 miles (3000 kilometers) under our feet. Acting like the spinning conductor similar to a bicycle dynamo that powers a headlight, it generates electrical currents and a constantly changing electromagnetic field. Other sources of magnetism come from minerals in Earth’s mantle and crust, while the ionosphere, magnetosphere and oceans also play a role. The three Swarm satellites precisely identify and measure precisely these different magnetic signals. Copyright: ESA/ATG Medialab

The European Space Agency’s Swarm satellite trio, launched at the end of 2013, has been busy measuring and untangling the different magnetic signals from Earth’s core, mantle, crust, oceans, ionosphere (upper atmosphere where the aurora occurs) and magnetosphere, the name given to the region of space dominated by Earth’s magnetic field.

At this week’s Living Planet Symposium in Prague, Czech Republic, new results from the constellation of Swarm satellites show where our protective field is weakening and strengthening, and how fast these changes are taking place.


Based on results from ESA’s Swarm mission, the animation shows how the strength of Earth’s magnetic field has changed between 1999 and mid-2016. Blue depicts where the field is weak and red shows regions where the field is strong. The field has weakened by about 3.5% at high latitudes over North America, while it has grown about 2% stronger over Asia. Watch also the migration of the north geomagnetic pole (white dot).

Between 1999 and May 2016 the changes are obvious. In the image above, blue depicts where the field is weak and red shows regions where it is strong. As well as recent data from the Swarm constellation, information from the CHAMP and Ørsted satellites were also used to create the map.


The animation shows changes in the rate at which Earth’s magnetic field strengthened and weakened between 2000 and 2015. Regions where changes in the field have slowed are shown in blue while red shows where changes sped up. For example, in 2015 changes in the field have slowed near South Africa but changes got faster over Asia. This map has been compiled using data from ESA’s Swarm mission.

The animation show that overall the field has weakened by about 3.5% at high latitudes over North America, while it has strengthened about 2% over Asia. The region where the field is at its weakest – the South Atlantic Anomaly – has moved steadily westward and weakened further by about 2%. Moreover, the magnetic north pole is also on the move east, towards Asia. Unlike the north and south geographic poles, the magnetic poles wander in an erratic way, obeying the movement of sloshing liquid iron and nickel in Earth’s outer core. More on that in a minute.

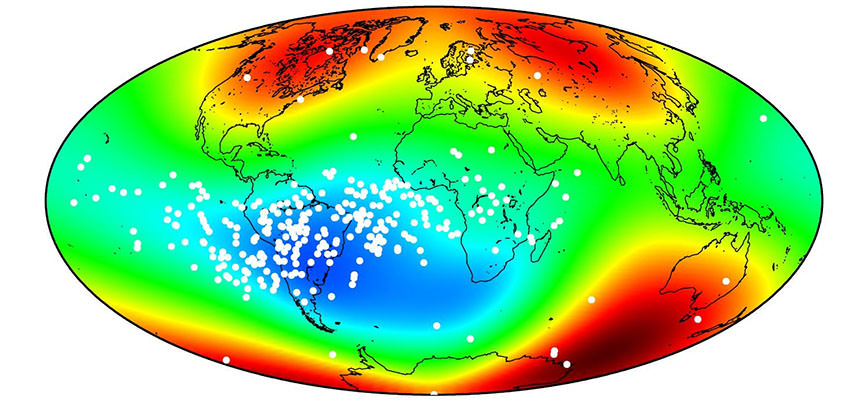
The ‘South Atlantic Anomaly’ refers to an area where Earth's protective magnetic shield is weak. The white spots on this map indicate where electronic equipment on a TOPEX/Poseidon satellite was affected by radiation as it orbited above. Credit: ESA/DTU Space
The ‘South Atlantic Anomaly’ refers to an area where Earth’s protective magnetic shield is weak. The white spots on this map indicate where electronic equipment on a TOPEX/Poseidon satellite was affected by radiation as it orbited above. The colors indicate the strength of the planet’s magnetic field with red the highest value and blue the lowest.  Credit: ESA/DTU Space

The anomaly is a region over above South America, about 125-186 miles (200 – 300 kilometers) off the coast of Brazil, and extending over much of South America, where the inner Van Allen radiation belt dips just 125-500 miles (200 – 800 kilometers) above the Earth’s surface. Satellites passing through the anomaly experience extra-strong doses of radiation from fast-moving, charged particles.

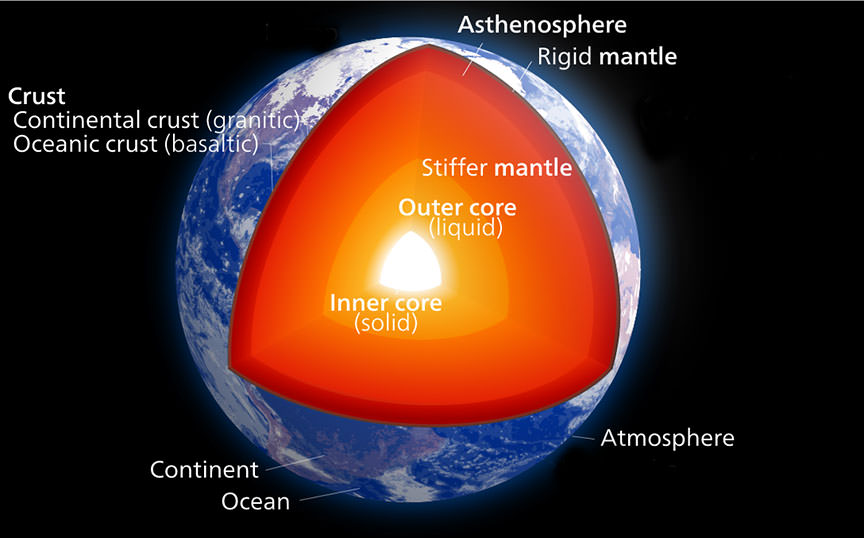
This cutaway of planet Earth shows the familiar exterior of air, water and land as well as the interior: from the mantle down to the outer and inner cores. Currents in hot, liquid iron-nickel in the outer core create our planet's protective but fluctuating magnetic field. Credit: Kelvinsong / Wikipedia
This cutaway of planet Earth shows the familiar exterior of air, water and land as well as the interior: from the mantle down to the outer and inner cores. Currents in hot, liquid iron-nickel in the outer core create our planet’s protective but fluctuating magnetic field. Credit: Kelvinsong / Wikipedia

The magnetic field is thought to be produced largely by an ocean of molten, swirling liquid iron that makes up our planet’s outer core, 1,860 miles (3000 kilometers) under our feet. As the fluid churns inside the rotating Earth, it acts like a bicycle dynamo or steam turbine. Flowing material within the outer core generates electrical currents and a continuously changing electromagnetic field. It’s thought that changes in our planet’s magnetic field are related to the speed and direction of the flow of liquid iron and nickel in the outer core.

Chris Finlay, senior scientist at DTU Space in Denmark, said, “Swarm data are now enabling us to map detailed changes in Earth’s magnetic field. Unexpectedly, we are finding rapid localized field changes that seem to be a result of accelerations of liquid metal flowing within the core.”

The magnetic field and electric currents in and around Earth generate complex forces that have immeasurable impact on every day life. The field can be thought of as a huge bubble, protecting us from cosmic radiation and charged particles that bombard Earth in solar winds. It’s shaped by winds of particles blowing from the sun called the solar wind, the reason it’s flattened on the “sun-side” and swept out into a long tail on the opposite side of the Earth. Credit: ESA/ATG medialab

Further results are expected to yield a better understanding as why the field is weakening in some places, and globally. We know that over millions of years, magnetic poles can actually flip with north becoming south and south north. It’s possible that the current speed up in the weakening of the global field might mean it’s ready to flip.

Although there’s no evidence previous flips affected life in a negative way, one thing’s for sure. If you wake up one morning and find your compass needle points south instead of north, it’s happened.

2007 OR10 Needs A Name. We Suggest Dwarfplanet McDwarfplanetyface

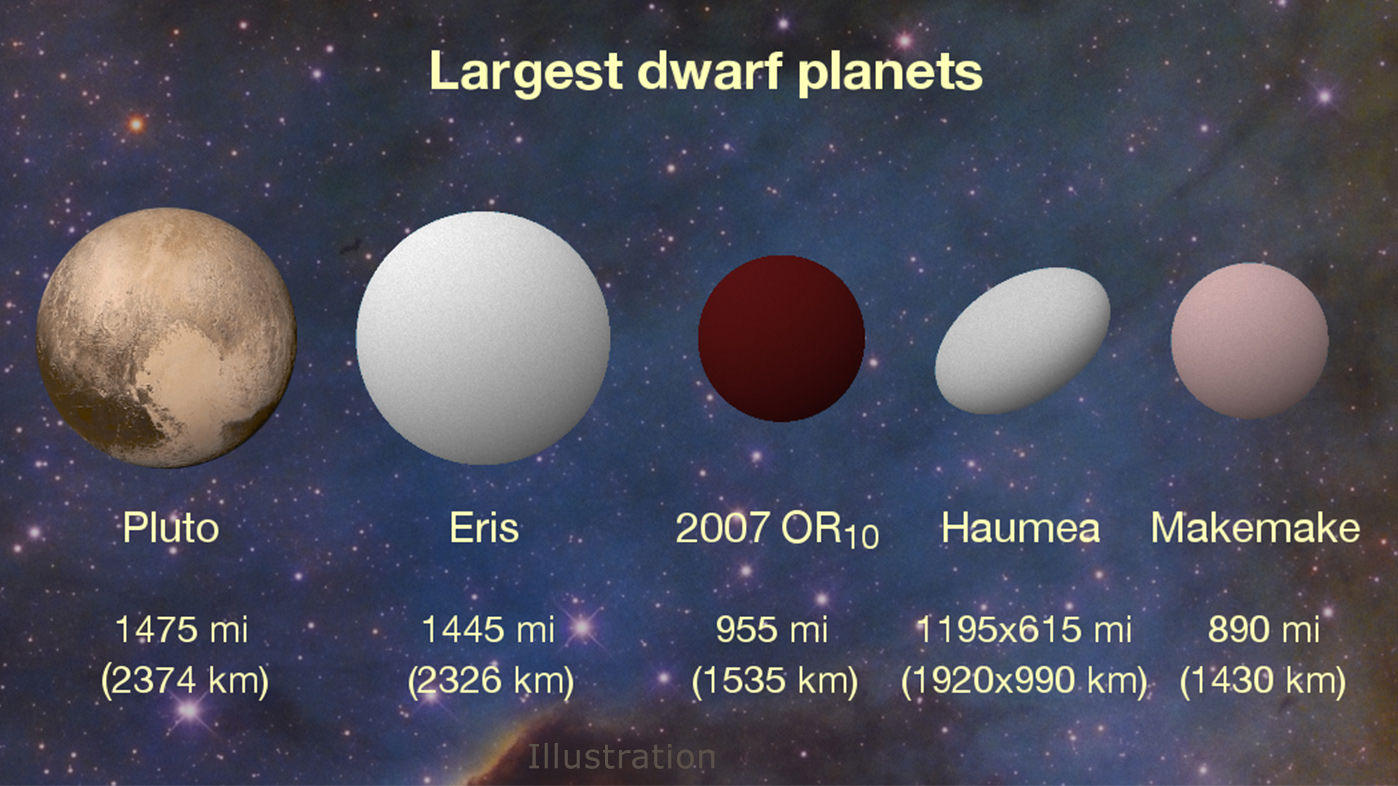
Results of a study combining Kepler observations with Herschel data show that 2007 OR10 is the largest unnamed dwarf planet in our Solar System, and the third largest overall. Illustration: Konkoly Observatory/András Pál, Hungarian Astronomical Association/Iván Éder, NASA/JHUAPL/SwRI

Depending on shifting definitions of what exactly is or isn’t a dwarf planet, our Solar System has about half a dozen dwarf planets. They are: Pluto, Eris, Haumea, Makemake, Ceres, and 2007 OR10.

Even though 2007 OR10’s name makes it stand out from the rest, dwarf planets as a group are an odd bunch. They spend their time in the cold, outer reaches of the Solar System, with Ceres being the only exception. Ceres resides in the asteroid belt between Mars and Jupiter.

Their distance from Earth makes them difficult targets for observation, even with the largest telescopes we have. Even the keen eye of the Hubble Telescope, orbiting above Earth’s view-inhibiting atmosphere, struggles to get a good look at the dwarf planets. But astronomers using the Kepler spacecraft discovered that its extreme light sensitivity have made it a useful tool to study the dwarves.

In a paper published in The Astronomical Journal, a team led by Andras Pal, at Konkoly Observatory in Budapest, Hungary, have refined the measurement of 2007 OR10. Using the Kepler’s observational prowess, and combining it with archival data from the Herschel Space Observatory, the team has come up with a much more detailed understanding of 2007 OR10.

Previously, 2007 OR10 was thought to be about 1280 km (795 miles) in diameter. But the problem is the dwarf planet was only a faint, tiny, and distant point of light. Astronomers knew it was there, but didn’t know much else. Objects as far away as 2007 OR10, which is currently twice as far away from the Sun as Pluto is, can either be small, bright objects, or much larger, dimmer objects that reflect less light.

This is where the Kepler came in. It has exquisite sensitivity to tiny changes in light. Its whole mission is built around that sensitivity. It’s what has made Kepler such an effective tool for identifying exo-planets. Pointing it towards a tiny target like 2007 OR10, and monitoring the reflected light as the object rotates, is a logical use for Kepler.

Even so, Kepler alone wasn’t able to give the team a thorough understanding of the dwarf planet with the clumsy name.

Enter the Herschel Space Observatory, a powerful infrared space telescope. Herschel and its 3.5 metre (11.5 ft.) mirror were in operation at LaGrange 2 from 2009 to 2013. Herschel discovered many things in its mission-span, including solid evidence for comets being the source of water for planets, including Earth.

But the Herschel Observatory also bequeathed an enormous archive of data to astronomers and other space scientists. And that data was crucial to the new measurement of 2007 OR10.

Combining data and observations from multiple sources is not uncommon, and is often the only way to learn much about distant, tiny objects. In this case, the two telescopes were together able to determine the amount of sunlight reflected by the dwarf planet, using Kepler’s light sensitivity, and then measure the amount of that light later radiated back as heat, using Herschel’s infrared capabilities.

Combining those datasets gave a much clearer idea of the size, and reflectivity, of 2007 OR10. In this case, the team behind the new paper was able to determine that 2007 OR10 was significantly larger than previously thought. It’s measured size is now 1535 km (955 mi) in diameter. This is 255 km (160 mi) larger than previously measured.

It also tells us that the dwarf planet’s gravity is stronger, and the surface darker, than previously measured. This further cements the oddball status of 2007 OR10, since other dwarf planets are much brighter. Other observations of the planet have shown that is has a reddish color, which could be the result of methane ice on the surface.

Lead researcher Andras Pal said, “Our revised larger size for 2007 OR10 makes it increasingly likely the planet is covered in volatile ices of methane, carbon monoxide and nitrogen, which would be easily lost to space by a smaller object. It’s thrilling to tease out details like this about a distant, new world — especially since it has such an exceptionally dark and reddish surface for its size.”

Now that more is known about 2007 OR10, perhaps its time it was given a better name, something that’s easier to remember and that helps it fit in with its peer planets Pluto, Ceres, Eris, Haumea, and Makemake. According to convention, the honor of naming it goes to the planet’s discoverers, Meg Schwamb, Mike Brown and David Rabinowitz. They discovered it in 2007 during a search for distant bodies in the Solar System.

According to Schwamb, “The names of Pluto-sized bodies each tell a story about the characteristics of their respective objects. In the past, we haven’t known enough about 2007 OR10 to give it a name that would do it justice. I think we’re coming to a point where we can give 2007 OR10 its rightful name.”

The Universe is vast, and we need some numbered, structured way to name everything. And these names have to mean something scientifically. That’s why objects end up with names like 2007 OR10, or SDSS J0100+2802, the name given to a distant, ancient quasar. But objects closer to home, and certainly everything in our Solar System, deserves a more memory-friendly name.

So what’s it going to be? If you think you have a great name for the oddball dwarf named 2007 OR10, let us hear it in a tweet, or in the comments section.