The Biggest Astrophoto… Ever!

This illustration shows the wealth of information on scales both small and large available in the SDSS-III’s new image. The picture in the top left shows the SDSS-III view of a small part of the sky, centered on the galaxy Messier 33 (M33). The middle top picture is a further zoom-in on M33, showing the spiral arms of this galaxy, including the blue knots of intense star formation known as “HII regions.” The top right-hand picture is a further zoom into M33 showing the object NGC 604, which is one of the largest HII regions in that galaxy. The figure at the bottom is a map of the whole sky derived from the SDSS-III image, divided into the northern and southern hemispheres of our galaxy. Visible in the map are the clusters and walls of galaxies that are the largest structures in the entire universe.

[/caption]

Today, the Sloan Digital Sky Survey-III (SDSS-III) is releasing the largest digital color image of the sky ever made, and it’s free to all. Just how big? Step inside and find out…

According to the American Astronomical Society press release, the image has been put together over the last decade from
millions of 2.8-megapixel images, thus creating a color image of more than a trillion pixels. Just how does that relate? Even a large format professional CCD camera will only produce about 11 million pixels and really big screen to view – but this terapixel image is so big and detailed that it would take 500,000 high-definition TVs to view it at its full resolution. Can you imagine?! “This image provides opportunities for many new scientific discoveries in the years to come,” exclaims Bob Nichol, a professor at the University of Portsmouth and Scientific Spokesperson for the SDSS-III collaboration.

Where did this huge astrophoto come from? The new image is at the heart of new data being released today by the SDSS-III collaboration at 217th American Astronomical Society meeting in Seattle. This new information, along with the previous data releases which it builds upon, gives astronomers the most comprehensive view of the night sky ever made. SDSS data have already been used to discover nearly half a billion astronomical objects, including asteroids, stars, galaxies and distant quasars. The latest, most precise positions, colors and shapes for all these objects are also being released today. (Time to update our software programs!) “This is one of the biggest bounties in the history of science,” says Professor Mike Blanton from New York University, who is leading the data archive work in SDSS-III. Blanton and many other scientists have been working for months preparing the release of all this data. “This data will be a legacy for the ages,” explains Blanton, “as previous ambitious sky surveys like the Palomar Sky Survey of the 1950s are still being used today.” And who among us hasn’t used the POSS program to confirm something we’ve seen or perhaps caught unexpectedly on an astrophotograph? “We expect the SDSS data to have that sort of shelf life,” comments Blanton.

So when did all of this begin? The image was started in 1998 using what was then the world’s largest digital camera: a 138-megapixel imaging detector on the back of a dedicated 2.5-meter telescope at the Apache Point Observatory in New Mexico, USA. Over the last decade, the Sloan Digital Sky Survey has scanned a third of the whole sky. Now, this imaging camera is being retired, and it will rightfully become a part of the permanent collection at the Smithsonian in recognition of its contributions to astronomy. “It’s been wonderful to see the science results that have come from this camera,” says Connie Rockosi, an astronomer from the University of California, Santa Cruz, who started working on the camera in the 1990s as an undergraduate student with Jim Gunn, Professor of Astronomy at Princeton University and SDSS-I/II Project Scientist. Rockosi’s entire career so far has paralleled the history of the SDSS camera. “It’s a bittersweet feeling to see this camera retired, because I’ve been working with it for nearly 20 years,” she says.

But what next? Thanks to such incredible resolution, the enormous image will form the cornerstone for new surveys of the Universe using the SDSS telescope. These surveys rely on other forms of data, such as spectra – an astronomical technique which employs specialized instruments to break the light from a star or galaxy into its component wavelengths. Spectra can be used to find the distances to distant galaxies, and the properties (such as temperature and chemical composition) of different
types of stars and galaxies. “We have upgraded the existing SDSS instruments, and we are using them to measure distances to over a million galaxies detected in this image,” explains David Schlegel, an astronomer from Lawrence Berkeley National Laboratory, and the Principal Investigator of the new SDSS-III Baryon Oscillation Spectroscopic Survey (BOSS). Schlegel
explains that measuring distances to galaxies is more time-consuming than simply taking their pictures, but in return, it provides a detailed three-dimensional map of the galaxies’ distribution in space. This is the type of accuracy we could only dream of five decades ago.

According to the press release, BOSS started taking data in 2009 and will continue until 2014, explains Schlegel. Once finished, BOSS will be the largest 3-D map of galaxies ever made, extending the original SDSS galaxy survey to a much larger volume of the Universe. The goal of BOSS is to precisely measure how so-called “Dark Energy” has changed over the recent history of the universe. These measurements will help astronomers understand the nature of this mysterious substance. “Dark energy is the biggest conundrum facing science today,” says Schlegel, “and the SDSS continues to lead the way in trying to figure out what the heck it is!” In addition to BOSS, the SDSS-III collaboration has been studying the properties and motions of hundreds of thousands of stars in the outer parts of our Milky Way Galaxy. The survey, known as the Sloan Extension for Galactic Understanding and Exploration or SEGUE started several years ago but has now been completed as part of the first year of SDSS-III.

Need more? In conjunction with the image being released today, astronomers from SEGUE are also releasing the largest map of the outer galaxy ever released. “This map has been used to study the distribution of stars in our galaxy,” says Rockosi, the Principal Investigator of SEGUE. “We have found many streams of stars that originally belonged to other galaxies that were torn apart by the gravity of our Milky Way. We’ve long thought that galaxies evolve by merging with others; the SEGUE observations confirm this basic picture.”

So what’s next? SDSS-III is also undertaking two other surveys of our galaxy through 2014. The first, called MARVELS, will use a new instrument to repeatedly measure spectra for approximately 8,500 nearby stars like our own Sun, looking for the telltale wobbles caused by large Jupiter-like planets orbiting them. MARVELS is predicted to discover around a hundred new giant planets, as well as potentially finding a similar number of “brown dwarfs” that are intermediate between the most massive planets and the smallest stars. The second survey is the APO Galactic Evolution Experiment (APOGEE), which is using one of the largest infrared spectrographs ever built to undertake the first systematic study of stars in all parts of our galaxy; even stars on the other side of our galaxy beyond the central bulge. Such stars are traditionally difficult to study as their visible light is obscured by large amounts of dust in the disk of our galaxy. However, by working at longer, infrared wavelengths, APOGEE can study them in great detail, thus revealing their properties and motions to explore how the different components of our galaxy were put together. “The SDSS-III is an amazingly diverse project built on the legacy of the original SDSS and SDSS-II surveys,” summarizes Nichol. “This image is the culmination of decades of work by hundreds of people, and has already produced many incredible discoveries. Astronomy has a rich tradition of making all such data freely available to the public, and
we hope everyone will enjoy it as much as we have.”

I do believe we will…

(The SDSS-III Data Release Eight (DR8) can be found at http://www.sdss3.org/dr8. All data published as part of DR8 is freely available to other astronomers, scientists, and the public. Technical journal papers describing DR8 and the SDSS-III project are on the arXiv e-Print server (http://arxiv.org).)

Credits: American Astronomical Society Press Release, M. Blanton and the SDSS-III.

Fermi Telescope Catches Thunderstorms Hurling Antimatter into Space

From a NASA press release:

Scientists using NASA’s Fermi Gamma-ray Space Telescope have detected beams of antimatter produced above thunderstorms on Earth, a phenomenon never seen before.

Scientists think the antimatter particles were formed in a terrestrial gamma-ray flash (TGF), a brief burst produced inside thunderstorms and shown to be associated with lightning. It is estimated that about 500 TGFs occur daily worldwide, but most go undetected.

“These signals are the first direct evidence that thunderstorms make antimatter particle beams,” said Michael Briggs, a member of Fermi’s Gamma-ray Burst Monitor (GBM) team at the University of Alabama in Huntsville (UAH). He presented the findings Monday, during a news briefing at the American Astronomical Society meeting in Seattle.
Continue reading “Fermi Telescope Catches Thunderstorms Hurling Antimatter into Space”

Star Birth and Death in the Andromeda Galaxy

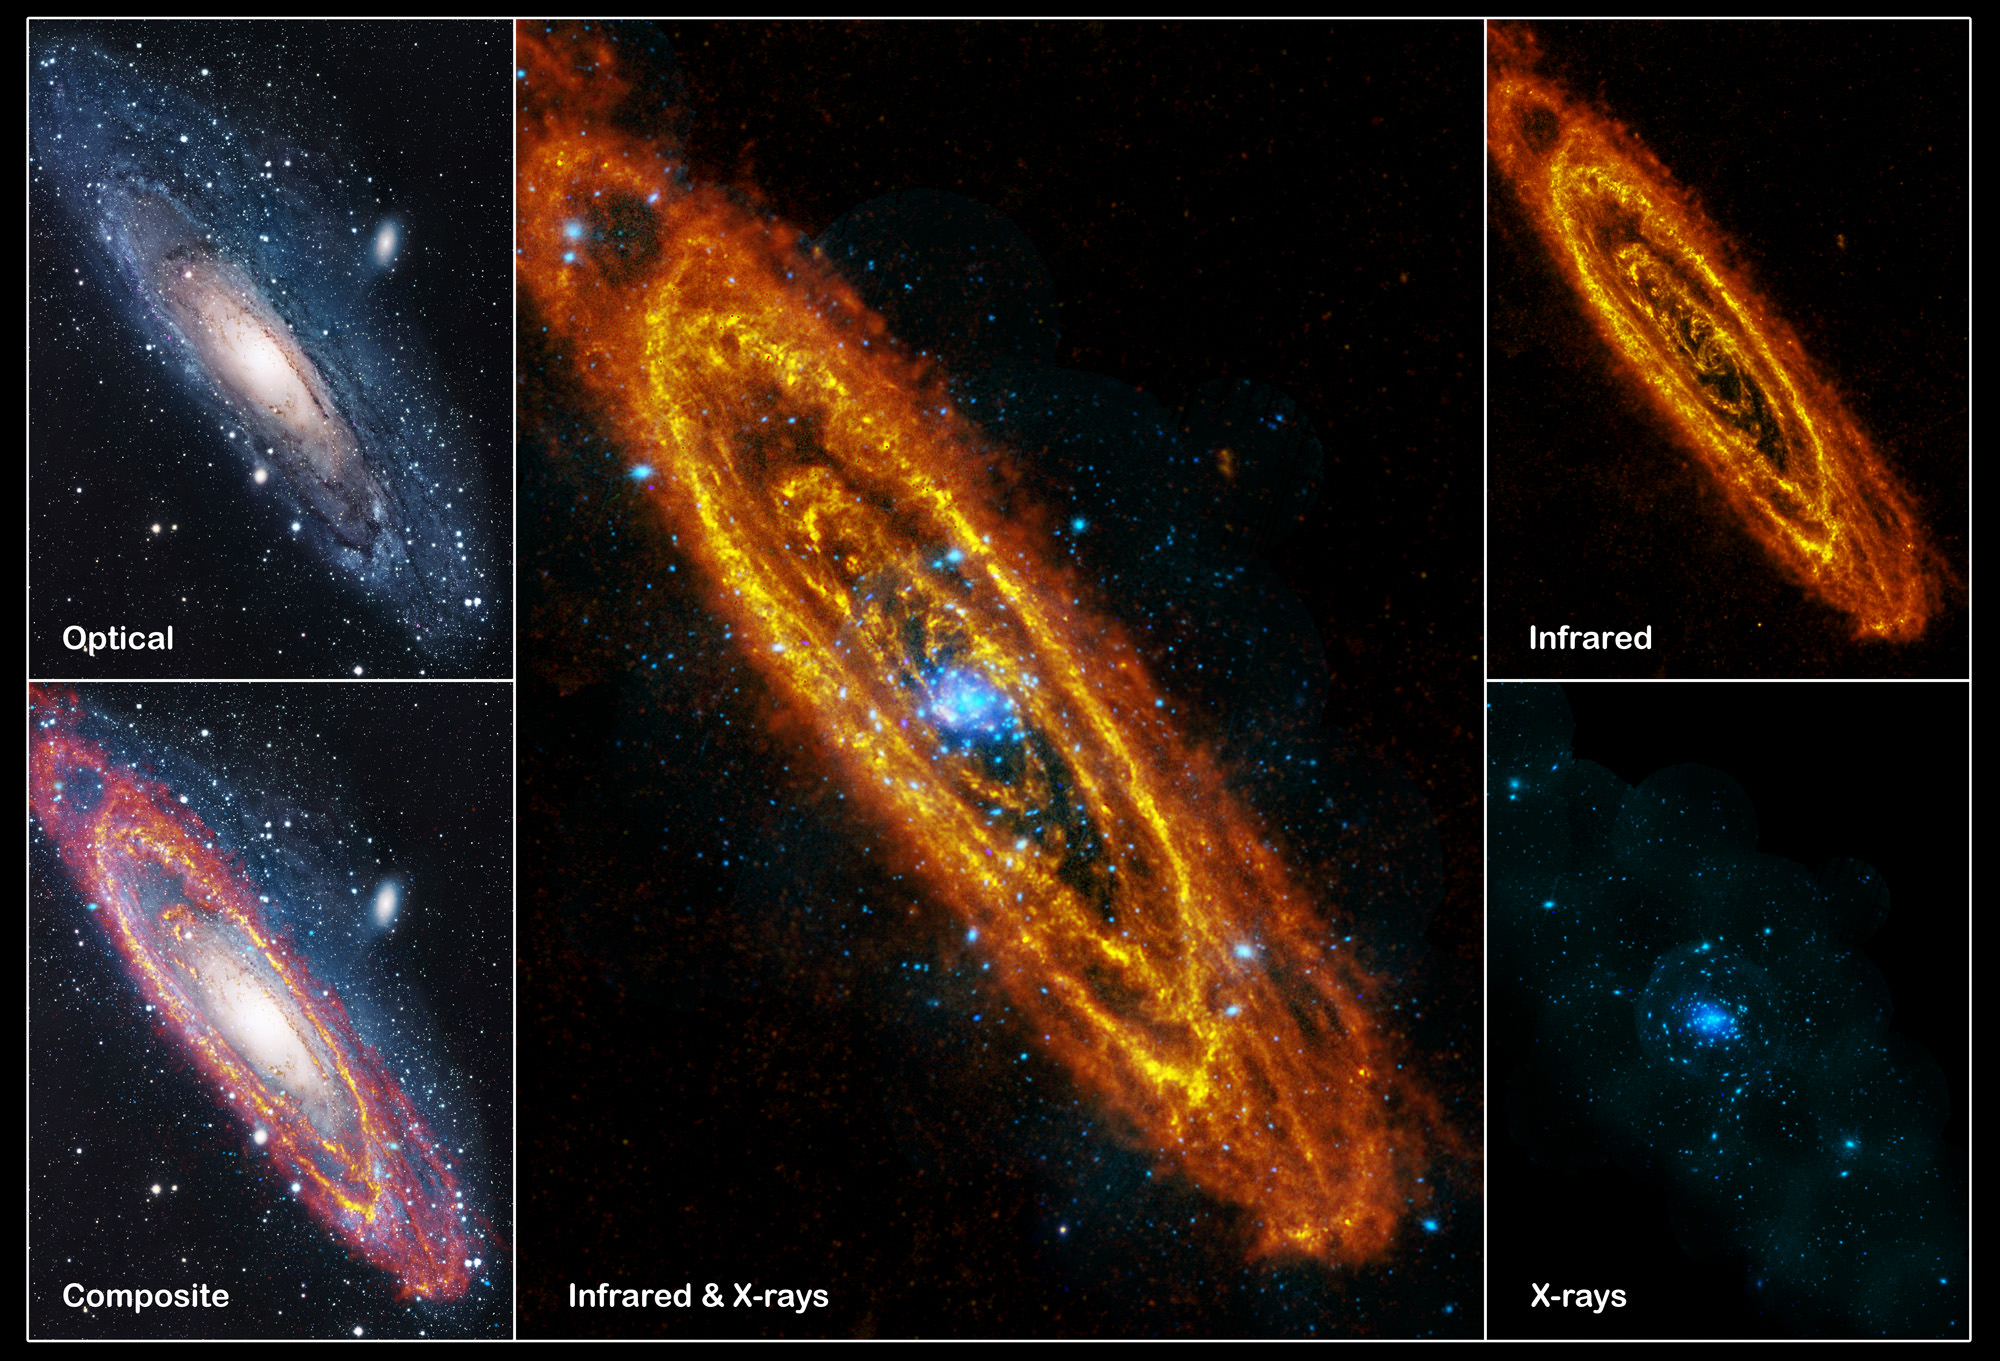
M31, or the Andromeda Galaxy seen in a variety of wavelengths by the Herschel and XMM-Newton space observatories. Credits: infrared: ESA/Herschel/PACS/SPIRE/J. Fritz, U. Gent; X-ray: ESA/XMM-Newton/EPIC/W. Pietsch, MPE; optical: R. Gendle

[/caption]

To the naked eye, the Andromeda galaxy appears as a smudge of light in the night sky. But to the combined powers of the Herschel and XMM-Newton space observatories, these new images put Andromeda in a new light! Together, the images provide some of the most detailed looks at the closest galaxy to our own. In infrared wavelengths, Herschel sees rings of star formation and XMM-Newton shows dying stars shining X-rays into space.

During Christmas 2010, the two ESA space observatories targeted Andromeda, a.k.a. M31.

Andromeda is about twice as big as the Milky Way but very similar in many ways. Both contain several hundred billion stars. Currently, Andromeda is about 2.2 million light years away from us but the gap is closing at 500,000 km/hour. The two galaxies are on a collision course! In about 3 billion years, the two galaxies will collide, and then over a span of 1 billion years or so after a very intricate gravitational dance, they will merge to form an elliptical galaxy.

Let’s look at each of the images:

Herschel’s view in far-infrared:

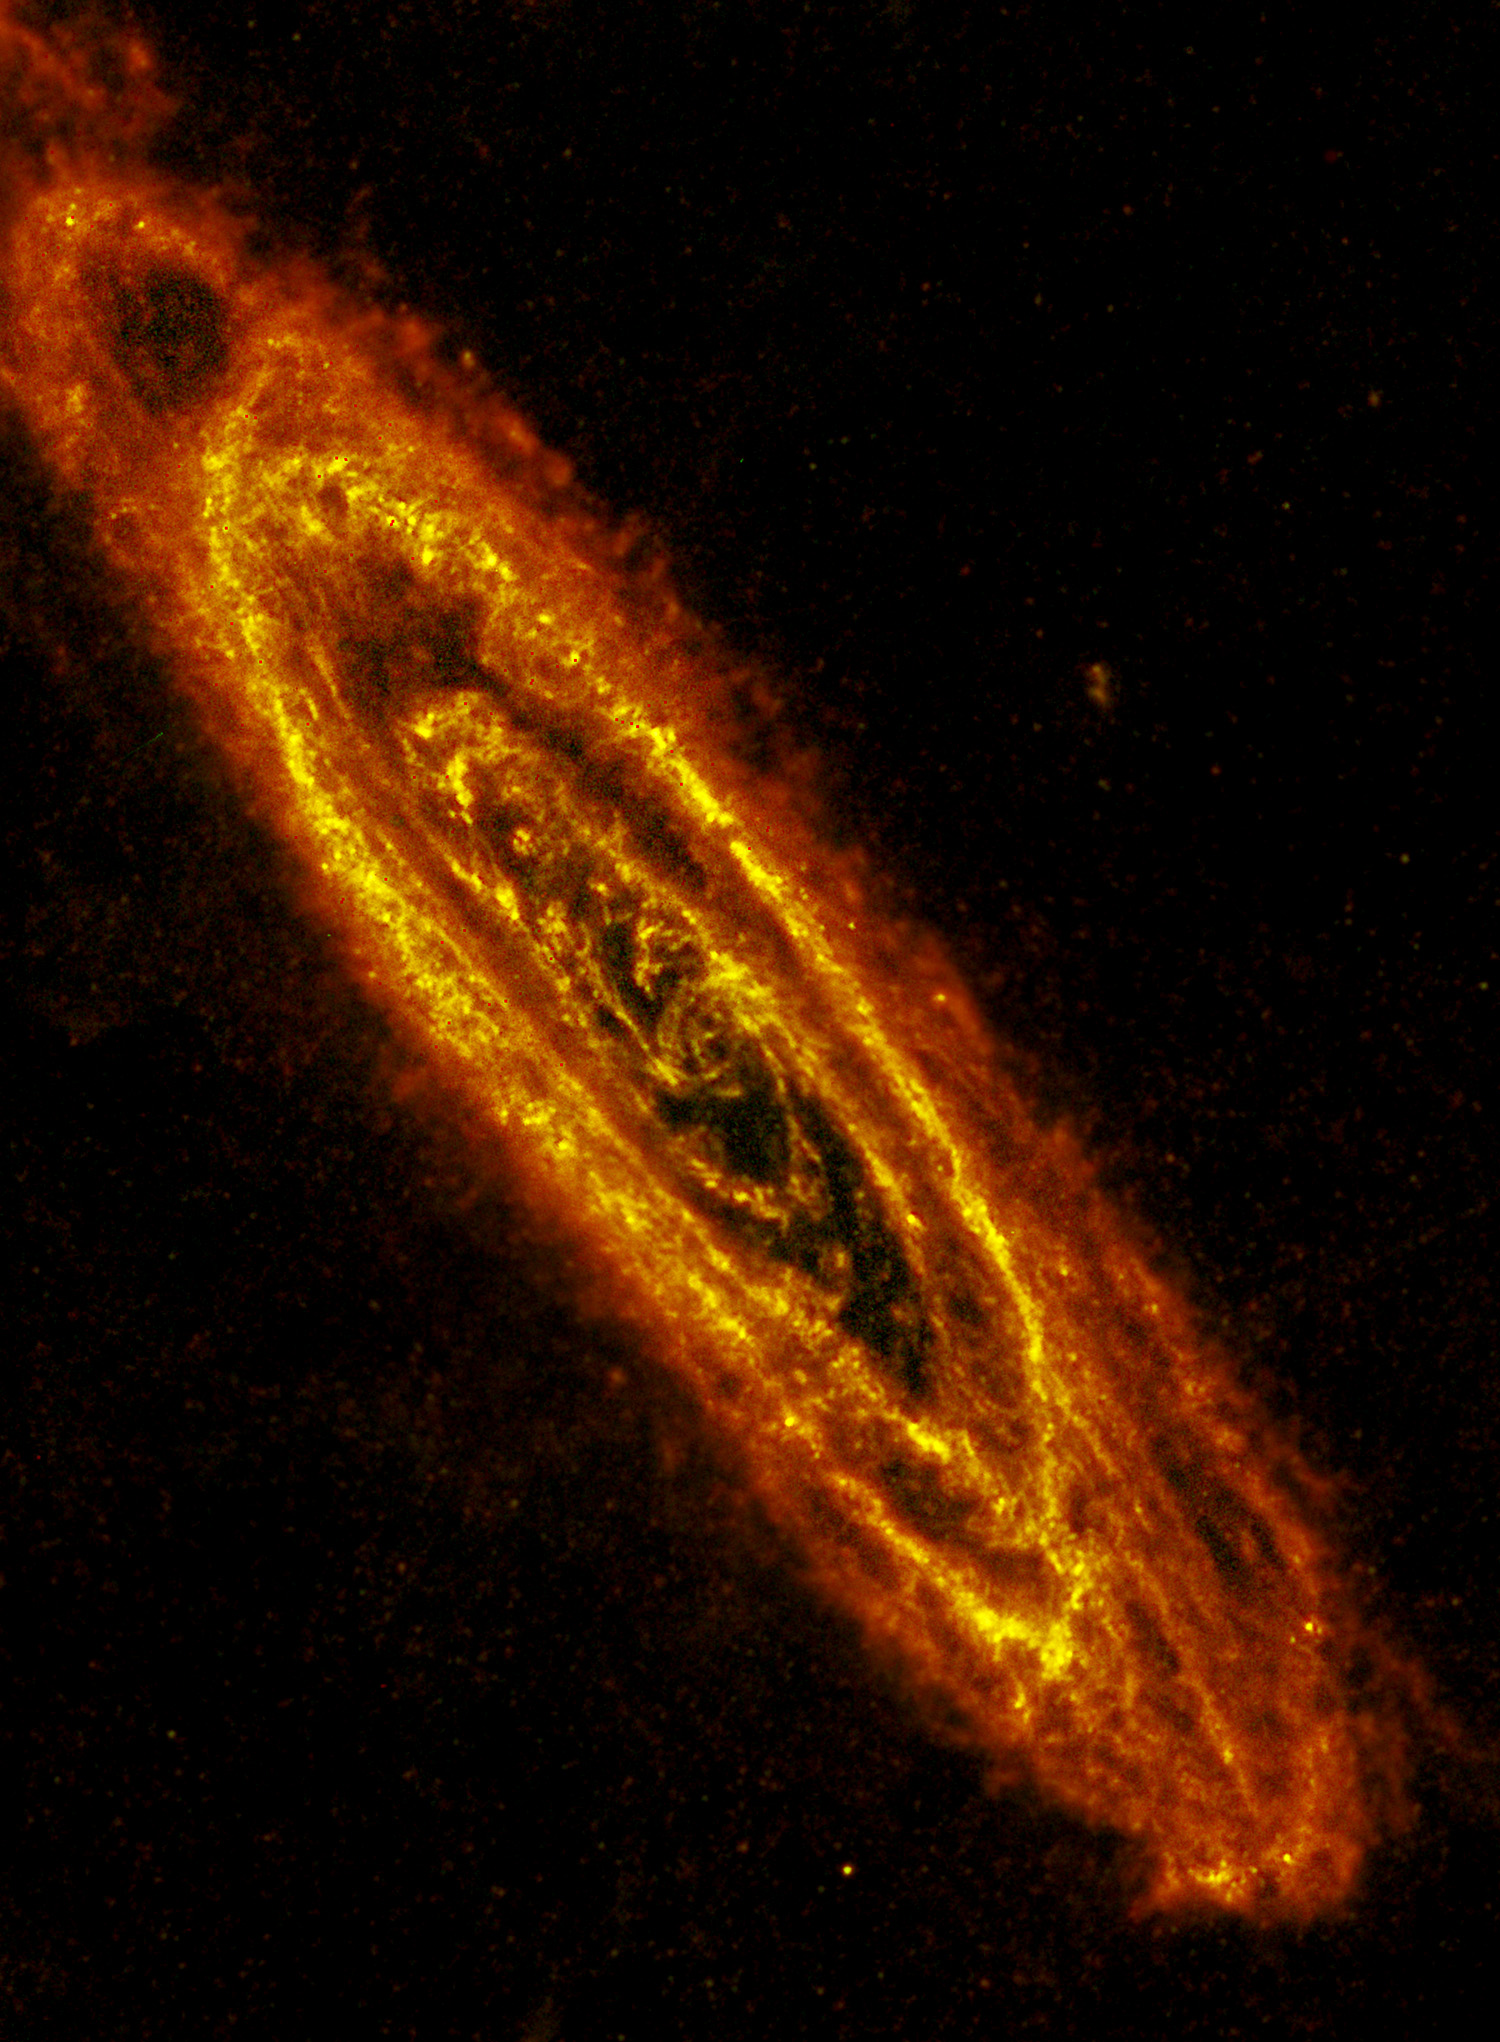
Andromeda in far-infrared from Herschel. Credits: ESA/Herschel/PACS/SPIRE/J. Fritz, U. Gent

Sensitive to far-infrared light, Herschel sees clouds of cool dust and gas where stars can form. Inside these clouds are many dusty cocoons containing forming stars, each star pulling itself together in a slow gravitational process that can last for hundreds of millions of years. Once a star reaches a high enough density, it will begin to shine at optical wavelengths. It will emerge from its birth cloud and become visible to ordinary telescopes.

Many galaxies are spiral in shape but Andromeda is interesting because it shows a large ring of dust about 75,000 light-years across encircling the center of the galaxy. Some astronomers speculate that this dust ring may have been formed in a recent collision with another galaxy. This new Herschel image reveals yet more intricate details, with at least five concentric rings of star-forming dust visible.

XMM Newton’s view in X-rays

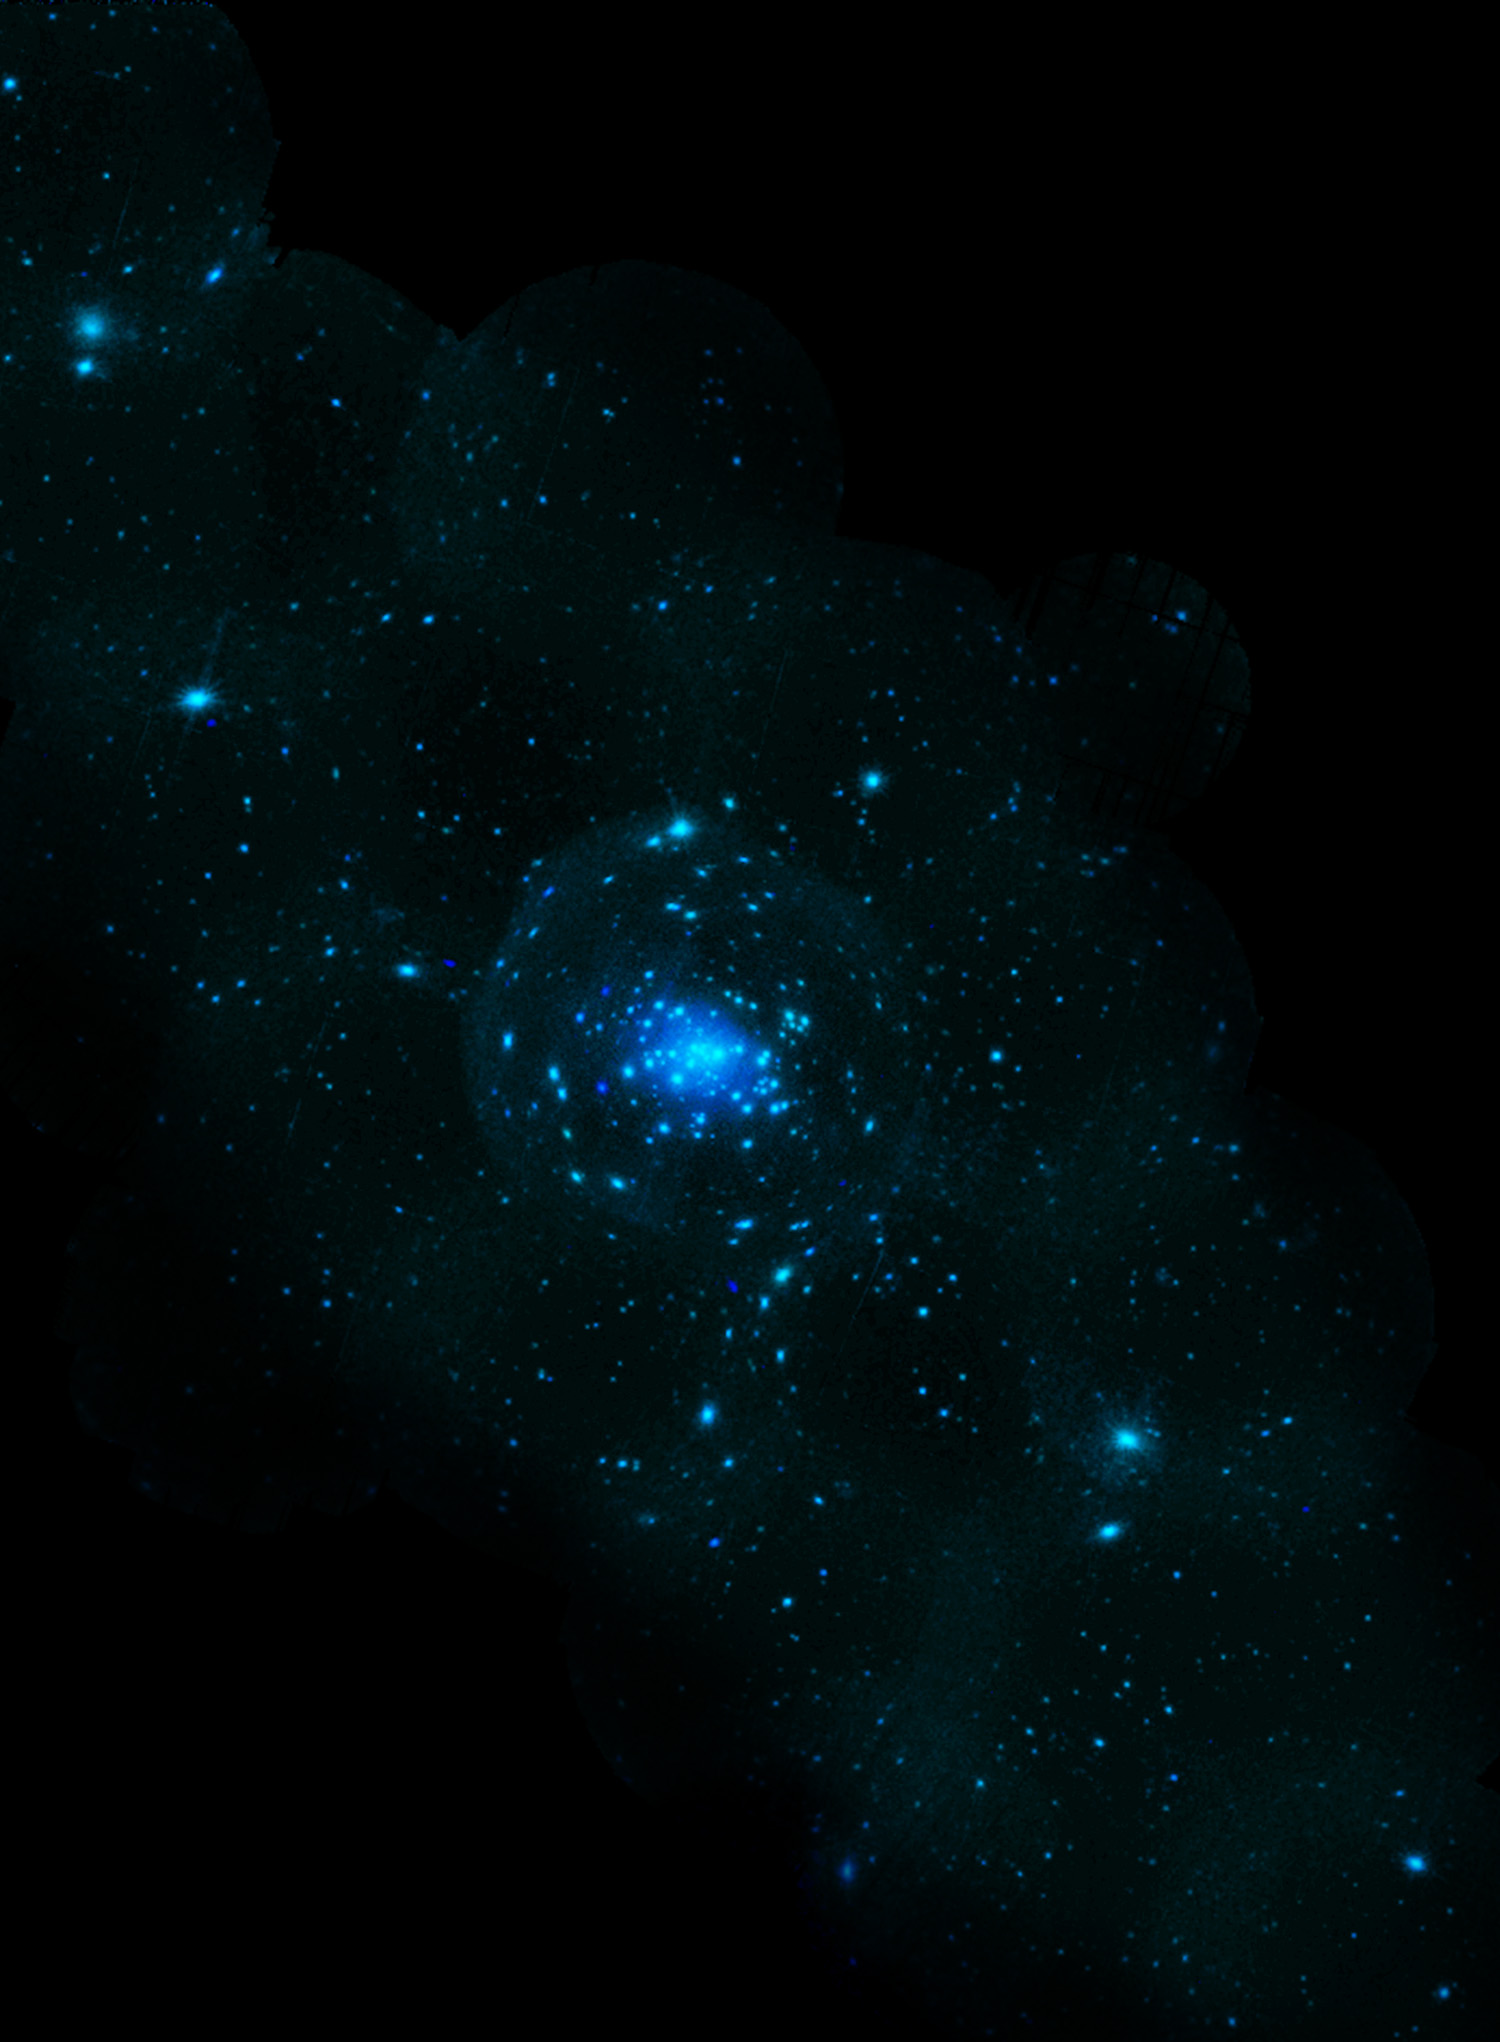
XMM Newton's view in X-Ray. Credits: ESA/XMM-Newton/EPIC/W. Pietsch, MPE

Superimposed on the infrared image is an X-ray view taken almost simultaneously by ESA’s XMM-Newton observatory. Whereas the infrared shows the beginnings of star formation, X-rays usually show the endpoints of stellar evolution.

XMM-Newton highlights hundreds of X-ray sources within Andromeda, many of them clustered around the centre, where the stars are naturally found to be more crowded together. Some of these are shockwaves and debris rolling through space from exploded stars, others are pairs of stars locked in a gravitational fight to the death.

In these deadly embraces, one star has already died and is pulling gas from its still-living companion. As the gas falls through space, it heats up and gives off X-rays. The living star will eventually be greatly depleted, having much of its mass torn from it by the stronger gravity of its denser partner. As the stellar corpse wraps itself in this stolen gas, it could explode.

Together, the infrared and X-ray images show information that is impossible to collect from the ground because these wavelengths are absorbed by Earth’s atmosphere. Visible light shows us the adult stars, whereas infrared gives us the youngsters and X-rays show those in their death throes.

Dive Into the Infrared Lagoon (Nebula)!

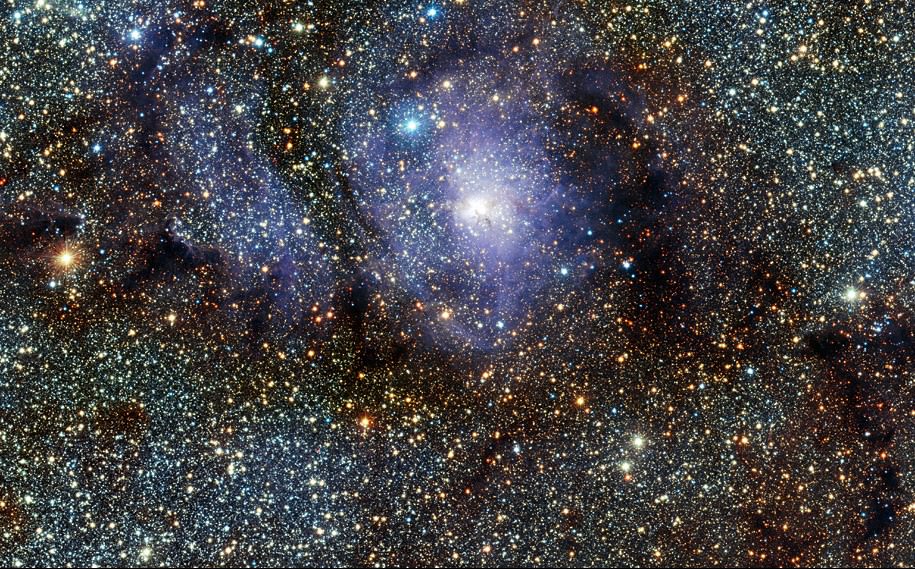
A new infrared view of the star formation region Messier 8, often called the Lagoon Nebula, captured by the VISTA telescope at ESO’s Paranal Observatory in Chile. Credit: ESO/VVV

[/caption]

This rich and stunning new infrared view of the Lagoon Nebula shows detail never seen before. Doesn’t it make you want to dive in for a closer look? Well, you can do just in that in a video below that zooms in on all the detail. The image was captured as part of a five-year study of the Milky Way using ESO’s VISTA telescope at the Paranal Observatory in Chile. This is a small piece of a much larger image of the region surrounding the nebula, which is, in turn, only one part of a huge survey.

The survey is called VISTA Variables in the Via Lactea (VVV), and with ESO’s Visible and Infrared Survey Telescope for Astronomy (VISTA), astronomers can scour the Milky Way’s central regions for variable objects and map its structure in greater detail than ever before.

Loading player…

This image of the Lagoon Nebula (also known as Messier 8,) is part of that survey. The region which lies about 4000–5000 light-years away in the constellation of Sagittarius (the Archer).

Infrared observations allow astronomers to peer behind the veil of dust that prevents them from seeing celestial objects in visible light.

Stars typically form in large molecular clouds of gas and dust, which collapse under their own weight. The Lagoon Nebula, however, is also home to a number of much more compact regions of collapsing gas and dust, called Bok globules. These dark clouds are so dense that, even in the infrared, they can block the starlight from background stars. But the most famous dark feature in the nebula, for which it is named, is the lagoon-shaped dust lane that winds its way through the glowing cloud of gas.

Hot, young stars, which give off intense ultraviolet light, are responsible for making the nebula glow brightly. But the Lagoon Nebula is also home to much younger stellar infants. Newborn stars have been detected in the nebula that are so young that they are still surrounded by their natal accretion discs. Such new born stars occasionally eject jets of matter from their poles. When this ejected material ploughs into the surrounding gas short-lived bright streaks called Herbig–Haro objects are formed, making the new-borns easy to spot. In the last five years, several Herbig–Haro objects have been detected in the Lagoon Nebula, so the baby boom is clearly still in progress here.

Source: ESO

Large Binocular Telescope Achieves First Light

Large Binocular Telescope
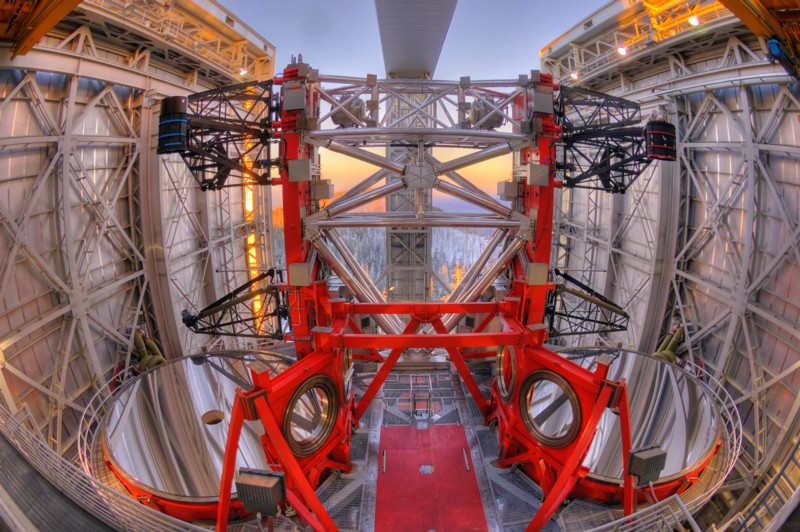
Left: The Large Binocular Telescope at Mt. Graham, Arizona. Right: First light image taken by the Large Binocular Telescope Interferometer, which can search for dust and large exoplanets around nearby stars.

After eight and a half years in the making, the Large Binocular Telescope (LBT) is finally ready to begin operation. Yesterday, it unveiled its first image (shown above), the target of which was Beta Pictoris.

Continue reading “Large Binocular Telescope Achieves First Light”

An Apertif to the Next Radio Astronomy Entrée

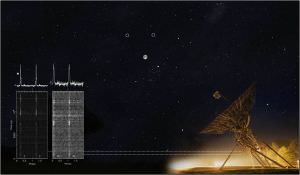
A new detector at the Westerbork Synthesis Radio Telescope (WSRT) allows for a much wider view of the sky in the radio spectrum. In this image, the two pulsars are separated by over 3.5 degrees of arc in the sky. Image Credit: ASTRON

[/caption]

To aid in the digestion of a new era in radio astronomy, a new technique for improving the is unfolding at the Westerbork Synthesis Radio Telescope (WSRT) in the Netherlands. By adding a plate of detectors to the focal plane of just one of the 14 radio antennas at the WSRT, astronomers at the Netherlands Institute for Radio Astronomy (ASTRON) have been able to image two pulsars separated by over 3.5 degrees of arc, which is about 7 times the size of the full Moon as seen from Earth.

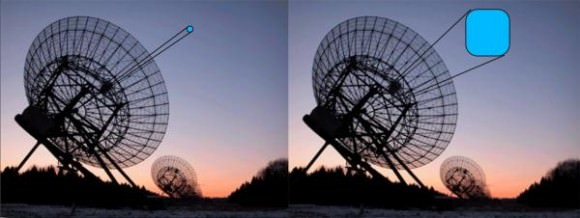
The new project – called Apertif – uses an array of detectors in the focal plane of the radio telescope. This ‘phased array feed’ – made of 121 separate detectors – increases the field of view of the radio telescope by over 30 times. In doing so, astronomers are able to see a larger portion of the sky in the radio spectrum. Why is this important? Well, in keeping with our food course analogy, imagine trying to eat a bowl of soup with a thimble – you can only get a small portion of the soup into your mouth at a time. Then imagine trying to eat it with a ladle.

This same analogy of surveying and observing the sky for radio sources holds true. Dr. Tom Oosterloo, the Principle Investigator of the Apertif project, explains the meat of the new technique:

“The phased array feed consists of 121 small antennas, closely packed together. This matrix covers about 1 square meter. Each WSRT will have such a antenna matrix in its focus. This matrix fully samples the radiation field in the focal plane. By combining the signals of all 121 elements, a ‘compound beams'[sic] can be formed which can be steered to be pointing at any location inside a region of 3×3 degrees on the sky. By combining the signals of all 121 elements, the response of the telescope can be optimised, i.e. all optical distortions can be removed (because the radiation field is fully measured). This process is done in parallel 37 times, i.e. 37 compound beams are formed. Each compound beam basically functions as a separate telescope. If we do this in all WSRT dishes, we have 37 WSRTs in parallel. By steering all the beams to different locations within the 3×3 degree region, we can observe this region entirely.”

In other words, traditional radio telescopes use only a single detector in the focal plane of the telescope (where all of the radiation is focused by the telescope). The new detectors are somewhat like the CCD chip in your camera, or those in use in modern optical telescopes like Hubble. Each separate detector in the array receives data, and by combining the data into a composite image a high-quality image can be captured.

The new array will also widen the field of view of the radio telescope, which allowed for this most recent observation of widely separated pulsars in the sky, a milestone test for the project. As an added bonus, the new detector will increase the efficiency of the “aperture” to around 75%, up from 55% with the traditional antennas.

Dr. Oosterloo explained, “The aperture efficiency is higher because we have much more control over the radiation field in the focal plane. With the classic single antenna systems (as in the old WSRT or as in the eVLA), one measures the radiation field in a single point only. By measuring the radiation field over the entire focal plane, and by cleverly combining the signals of all elements, optical distortion effects can be minimised and a larger fraction of the incoming radiation can be used to image the sky.”

This image illustrates the larger field of view afforded by the new instrument. Image Credit: ASTRON

For now, there is only one of the 14 radio antennas equipped with Apertif. Dr. Joeri Van Leeuwen, a researcher at ASTRON, said in an email interview that in 2011, 12 of the antennas will be outfitted with the new detector array.

Sky surveys have been a boon for astronomers in recent years. By taking enormous amounts of data and making it available to the scientific community, astronomers have been able to make many more discoveries than they would have been able to by applying for time on disparate instruments.

Though there are some sky surveys in the radio spectrum that have been completed so far – the VLA FIRST Survey being the most prominent – the field has a long way to go. Apertif is the first step in the direction of surveying the whole sky in the radio spectrum with great detail, and many discoveries are expected to be made by using the new technique.

Apertif is expected to discover over 1,000 pulsars, based on current modeling of the Galactic pulsar population. It will also be a useful tool in studying neutral hydrogen in the Universe on large scales.

Dr. Oosterloo et. al. wrote in a paper published on Arxiv in July, 2010, “One of the main scientific applications of wide-field radio telescopes operating at GHz frequencies is to observe large volumes of space in order to make an inventory of the neutral hydrogen in the Universe. With such information, the properties of the neutral hydrogen in galaxies as function of mass, type and environment can be studied in great detail, and, importantly, for the first time the evolution of these properties with redshift can be addressed.”

Adding the radio spectrum to the visible and infrared sky surveys would help to fine-tune current theories about the Universe, as well as make new discoveries. The more eyes on the sky we have in different spectra, the better.

Though Apertif is the first such detector in use, there are plans to update other radio telescopes with the technology. Dr. Oosterloo said of other such projects, “Phased array feeds are also being built by ASKAP, the Australia SKA Pathfinder. This is an instrument of similar characteristics as Apertif. It is our main competitor, although we also collaborate on many things. I am also aware of a prototype being tested at Arecibo currently. In Canada, DRAO [Dominion Radio Astrophysical Observatory] is doing work on phased array feed development. However, only Apertif and ASKAP will construct an actual radio telescope with working phased array feeds in the short term.”

On November 22nd and 23rd, a science coordination meeting was held about the Apertif project in Dwingeloo, Drenthe, Netherlands. Dr. Oosterloo said that the meeting was attended by 40 astronomers, from Europe, the US, Australia and South Africa to discuss the future of the project, and that there has been much interest in the potential of the technique.

Sources: ASTRON press release, Arxiv, email interview with Dr. Tom Oosterloo and Dr. Joeri Van Leeuwen

Clash of the Titan Galaxies

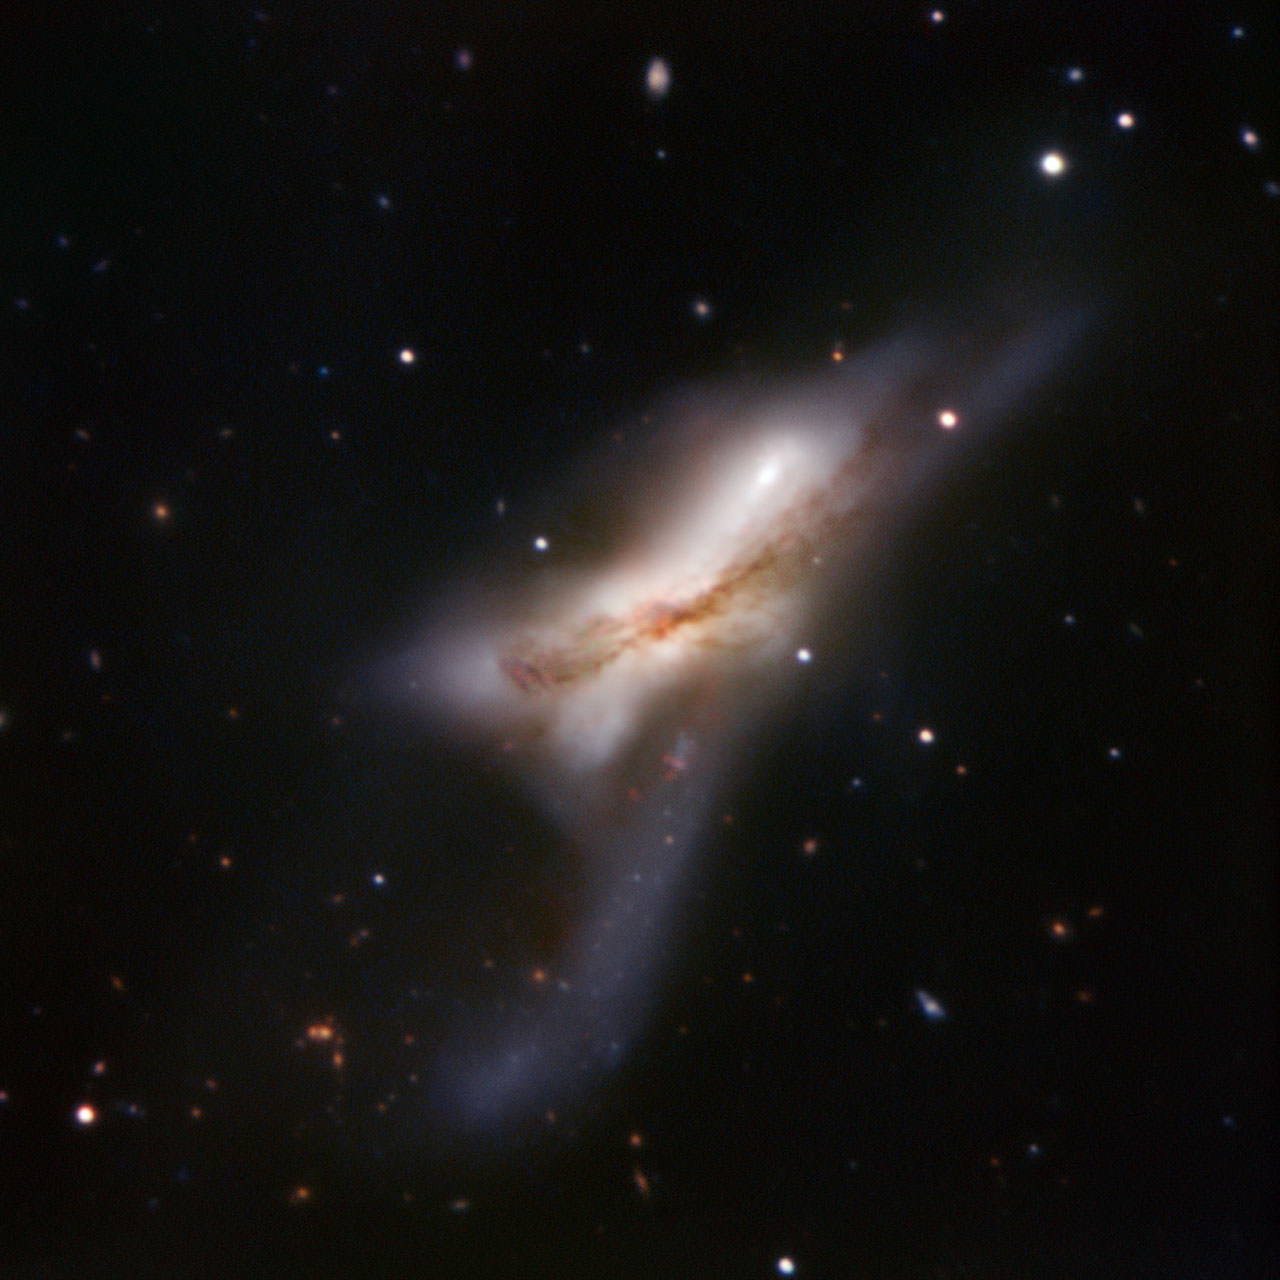
NGC 520 — also known as Arp 157 -- is actually a mashup of two gigantic galaxies. Credit: ESO

[/caption]

Is this galaxy exploding? Although that’s what it might look like, this is actually two gigantic galaxies crashing into each other. NGC 520 — also known as Arp 157 — is a mashup of two huge galaxies, now combining into one. We can’t really watch the process, as it happens extremely slowly — over millions of years, and the whole process started about 300 million years ago. Apr 157 is about 100,000 light-years across and is now in the middle stage of the merging process, as the two nuclei haven’t come together yet, but the two discs have. The merger features a tail of stars and a prominent dust lane. NGC 520 is one of the brightest interacting galaxies in the sky and lies in the direction of Pisces (the Fish), approximately 100 million light-years from Earth.

This image was taken by the ESO Faint Object Spectrograph and Camera attached to the 3.6-metre telescope at La Silla in Chile.

You’d need about a 4-inch telescope to see this 12th magnitude object yourself. Here’s the location: RA: 1h 24m 35.1s, Declination: +03° 47? 33?. Or put in those coordinates in Google Sky to see it there.

Source: ESO

Flawless Launch of STP-S26

NASA successfully launched its first 'FASTSAT' on Nov. 17, 2010. Image Credit: NASA

[/caption]

While the U.S. Air Force unsuccessfully tried to get a Delta IV off the ground in Florida – things worked out far better for NASA at the Kodiak Launch Complex located in Kodiak, Alaska. Friday’s Minotaur 4 rocket launch successfully accomplished its mission of placing not one – but six satellites into orbit some 400 miles above the Earth.

The mission took off just before sunset from Launch Pad 1. After launch the $170 million flight turned southeast from its launch site going out over the Pacific Ocean. The launch took place under a clear sky with the moon lighting its way.

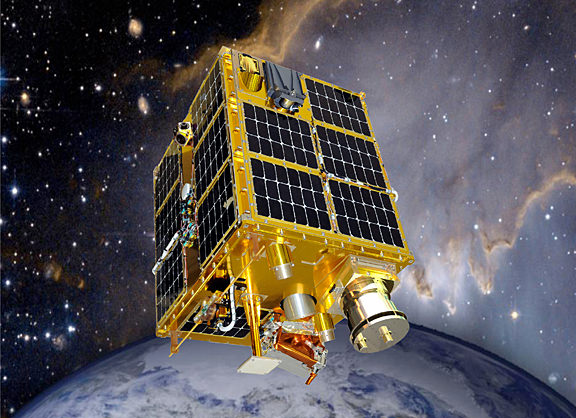
The payload for this flight was a rather mixed bag of NASA, military and university experiments. All six of the launch vehicle’s payloads were released right on time about 30 minutes after launch. The so-called ‘FASTSAT’ for Fast, Affordable, Science and Technology Satellite automatically switched itself on upon deployment. The project is a demonstration of ways to deploy experiments and other payloads cheaply and effectively to orbit.

Four of the satellites that were onboard the STP-S26 mission included the “ESPA-class:” STPSat-2, FalconSAT-5, FASTSAT-HSV01 and FASTRAC.

The FASTSAT program is NASA’s first microsatellite designed to provide multiple customers with access to orbit – at a lower cost. The main goal of the FASTSAT flight is to prove the viability of this capability to various government, academic and industry customers. The intent is to show that you do not have to invest millions of dollars into a single, large-scale satellite to conduct experiments on orbit.

The launch vehicle itself is also rather cheap as it is comprised of spare Peacekeeper missile tech. The STP-S26 mission was powered to orbit by a Minotaur IV launch vehicle, which was provided by the Rocket Systems Launch Program. The Minotaur IV is produced by Orbital Sciences Corporation.

One of the ‘firsts’ on this flight was the utilization of the Hydrazine Auxiliary Propulsion System (HAPS) to allow for dual-orbit capabilities. It is hoped, that in future flights this could be used to allow satellites to other orbits to give them far greater flexibility.
Another first employed on this mission was the first to use the Multi-Mission Satellite Operations Center Ground System Architecture. This center is capable of operating various satellites at the same time at a minimal cost. Indeed, the overriding theme of this launch would appear to be providing access to orbit – for less.

Astronomers Find Giant Structures From the Early Universe

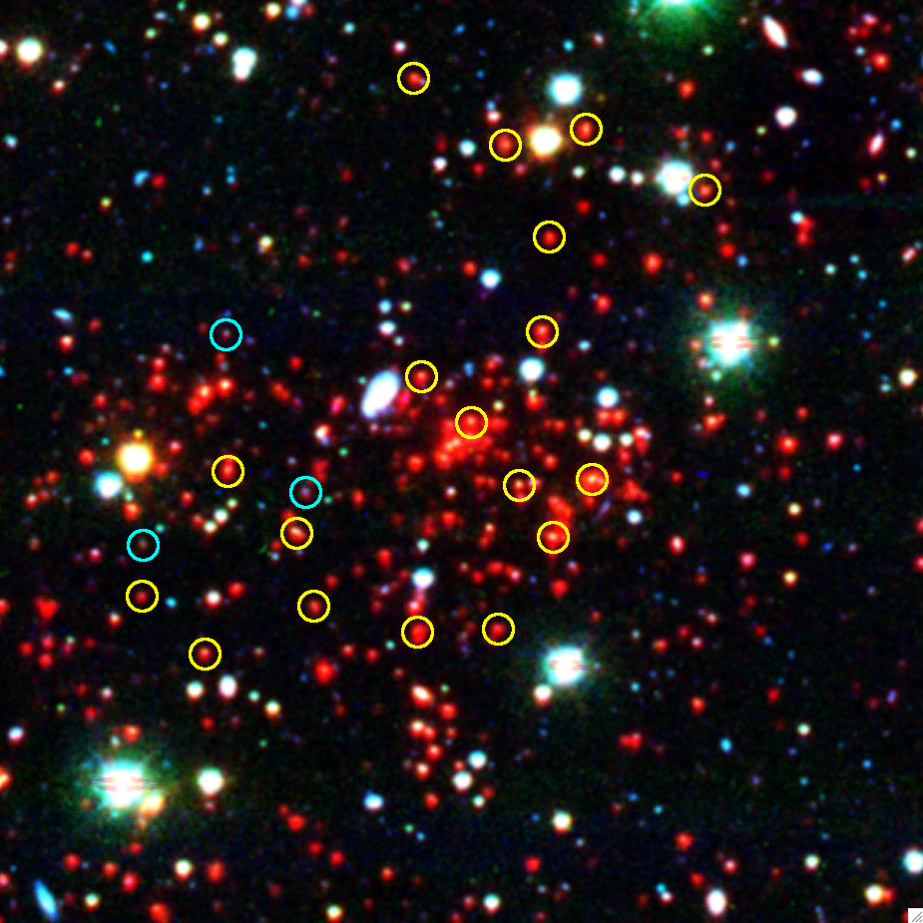
An infrared/optical representative-color image of a massive galaxy cluster located 7 billion light-years from Earth. Credit: Infrared Image: NASA/JPL-Caltech/M. Brodwin (Harvard-Smithsonian CfA) Optical Image: CTIO Blanco 4-m telescope/J. Mohr (LMU Munich)

[/caption]

Looking back to when our Universe was about half the age it is now, astronomers have discovered the most massive galaxy cluster yet seen at so great a distance. The researchers say that if we could see it as it appears today, it would be one of the most massive galaxy clusters in the universe. The cluster, modestly named SPT-CL J0546-5345, weighs in at around 800 trillion Suns, and holds hundreds of galaxies. “This galaxy cluster wins the heavyweight title,”said Mark Brodwin, from the Harvard-Smithsonian Center for Astrophysics. “This cluster is full of ‘old’ galaxies, meaning that it had to come together very early in the universe’s history – within the first two billion years.”


Using the new South Pole Telescope, Brodwin and his colleagues are searching for giant galaxy clusters using the Sunyaev-Zel’dovich effect – a small distortion of the cosmic microwave background, a pervasive all-sky glow left over from the Big Bang. Such distortions are created as background radiation passes through a large galaxy cluster.

They found the heavyweight cluster in some of their first observations with the new telescope.
Located in the southern constellation Pictor (the Painter), the cluster has a redshift of z=1.07, putting it at a distance of about 7 billion light-years, meaning we see it as it appeared 7 billion years ago, when the universe was half as old as now and our solar system didn’t exist yet.

Even at that young age, the cluster was almost as massive as the nearby Coma cluster. Since then, it should have grown about four times larger.

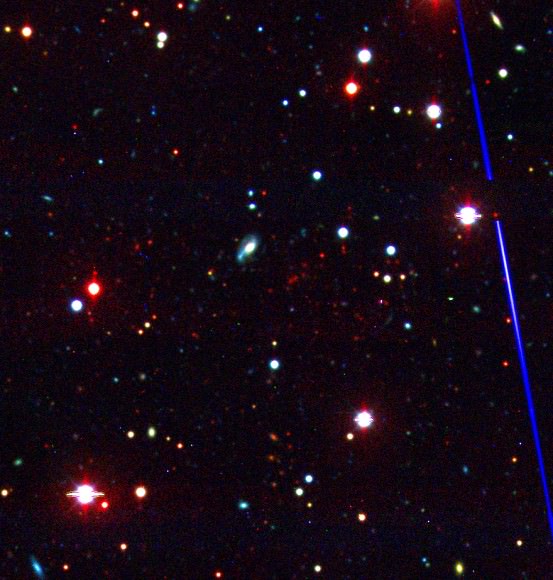
This optical image of the newfound galaxy cluster highlights how faint and reddened these galaxies are due to their great distance. Credit: CTIO Blanco 4-m telescope/J. Mohr (LMU Munich)

Galaxy clusters like this can be used to study how dark matter and dark energy influenced the growth of cosmic structures. Long ago, the universe was smaller and more compact, so gravity had a greater influence. It was easier for galaxy clusters to grow, especially in areas that already were denser than their surroundings.

“You could say that the rich get richer, and the dense get denser,” quipped Harvard astronomer Robert Kirshner, commenting on the study.

As the universe expanded at an accelerating rate due to dark energy, it grew more diffuse. Dark energy now dominates over the pull of gravity and chokes off the formation of new galaxy clusters.

The main goal of the SPT survey is to find a large sample of massive galaxy clusters in order to measure the equation of state of the dark energy, which characterizes cosmic inflation and the accelerated expansion of the universe. Additional goals include understanding the evolution of hot gas within galaxy clusters, studying the evolution of massive galaxies in clusters, and identifying distant, gravitationally lensed, rapidly star-forming galaxies.

The team expects to find many more giant galaxy clusters lurking in the distance once the South Pole Telescope survey is completed.

Follow-up observations on the cluster were done using the Infrared Array Camera on the Spitzer Space Telescope and the Magellan telescopes in Chile. A paper announcing the discovery has been published in the Astrophysical Journal.

The team’s paper is available at arXiv.

For more information on the South Pole Telescope, see this link.

Source: Harvard Smithsonian Center for Astrophysics

100 Epic Astronomy Images from ESO

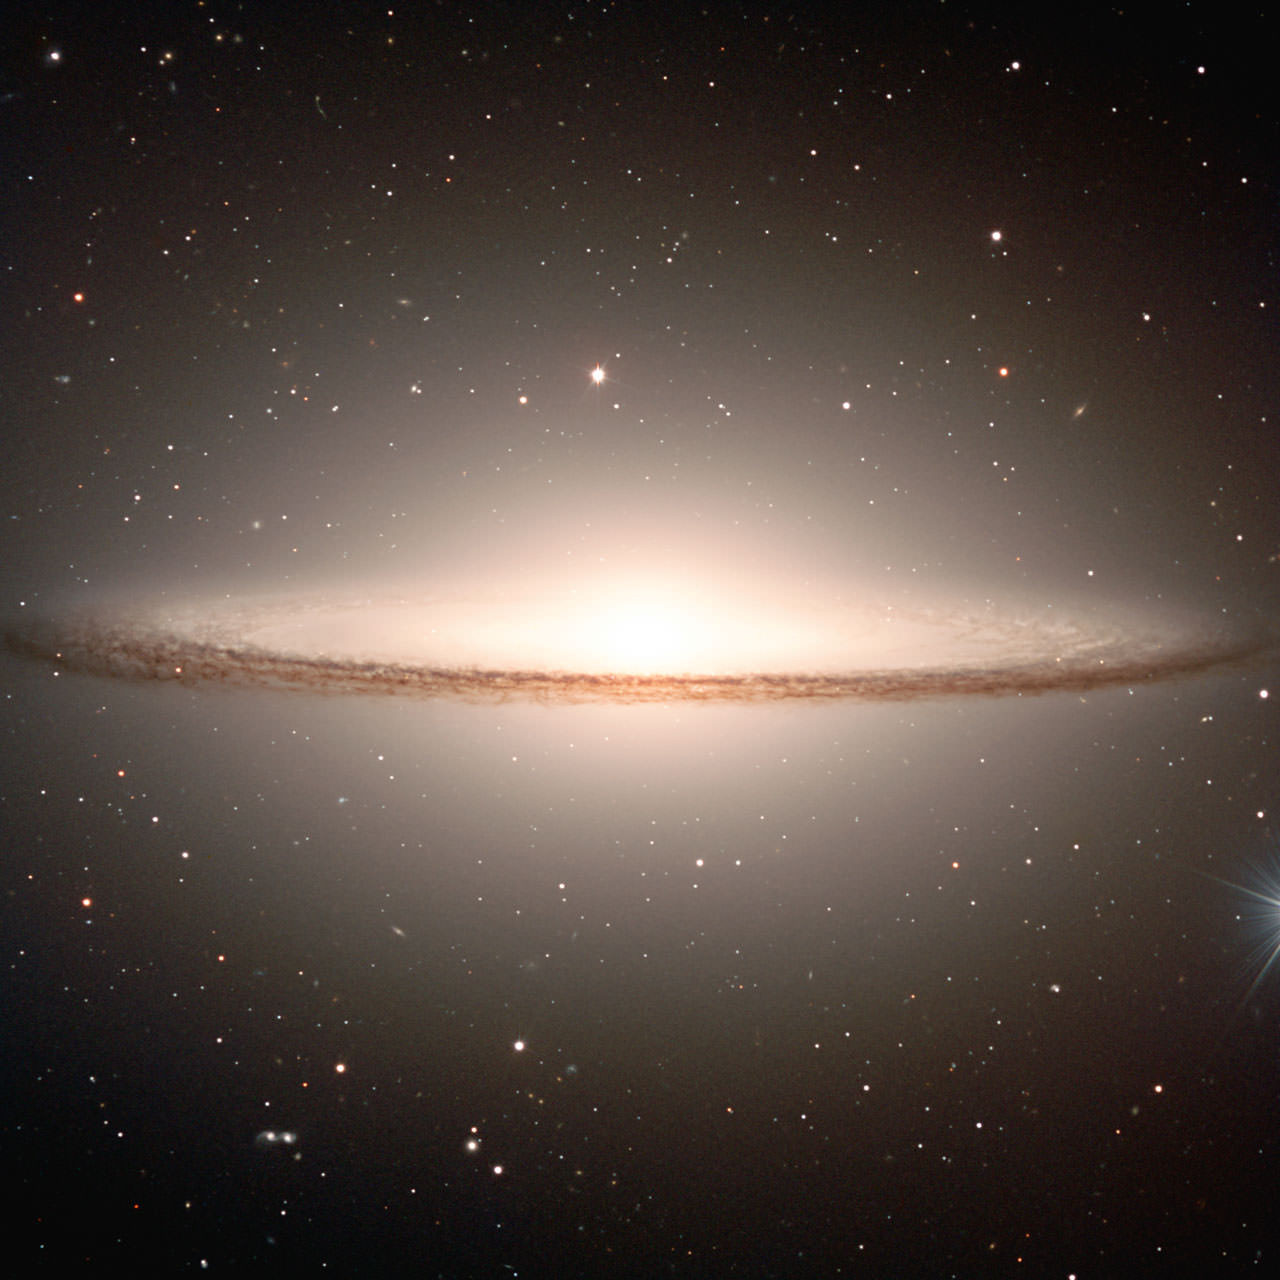
The Sombrero Galaxy. Credit: ESO/P. Barthe

[/caption]

The European Southern Observatory pumps out incredible astronomical images, usually weekly, and they have now put together a collection of their top 100 images. They are all wonderfully amazing, so check them out for a large amount of eye candy. ESO is a consortium of countries, astronomers and telescopes, including the Very Large Telescope, VISTA, APEX, the telescopes at La Silla, and ALMA, so there were a lot of images to choose from to pick the top 100. Go get lost in the images!

ESO also just announced a free competition for anyone who enjoys making beautiful images of the night sky using real astronomical data. Called “Hidden Treasures,” the competition has some extremely attractive prizes for the lucky winners who produce the most beautiful and original images, including an all expenses paid trip to ESO’s VLT on Cerro Paranal, in Chile. And the winner will have a chance to participate in the nightly VLT observations, too. Check out the competition here.