Neutrino Detection Could Help Paint an Entirely New Picture of the Universe

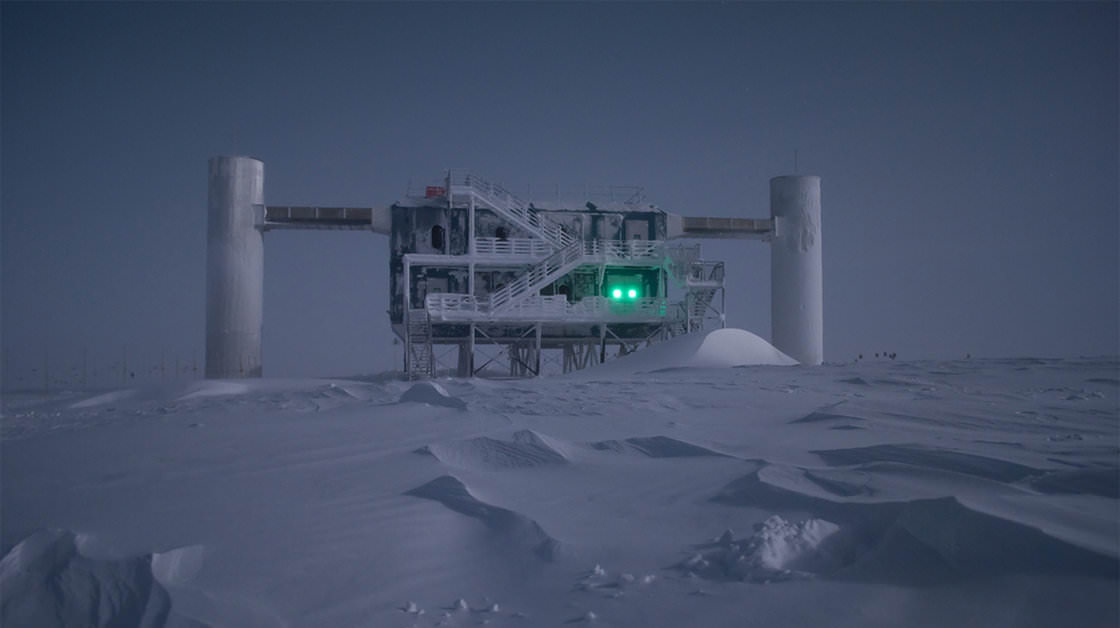
The IceCube Neutrino Observatory at the South Pole. It detected neutrinos and helped astronomers trace them to blazars. Credit: Emanuel Jacobi/NSF.

The IceCube neutrino observatory buried at the South Pole is one cool telescope. It has detected extremely high-energy neutrinos, which are elementary particles that likely originate outside our solar system. The discovery of 28 record-breaking neutrinos was announced earlier – with two of the particles — nicknamed Bert and Ernie – drawing particular attention because of the their off-the-chart energy of over 1,000,000,000,000,000 electron volts or 1 peta-electron volt (PeV).

Now, a new analysis of more recent data discovered 26 additional events beyond 30 teraelectronvolts — which exceeds the energy expected for neutrinos produced in the Earth’s atmosphere, and one of those events was almost double the energy of Bert and Ernie. This one has been dubbed “Big Bird,” and in combination, these events provide the first solid evidence for astrophysical neutrinos from distant cosmic accelerators, which might help us understand the origin of origin of cosmic rays. The detection has suggested a new age of astronomy is beginning, offering a new way to look at the Universe using high-energy neutrinos.

“While it is premature to speculate about the precise origin of these neutrinos, their energies are too high to be produced by cosmic rays interacting in the Earth’s atmosphere, strongly suggesting that they are produced by distant accelerators of subatomic particles elsewhere in our galaxy, or even farther away,” said Penn State Associate Professor of Physics Tyce DeYoung, the deputy spokesperson of the IceCube Collaboration.

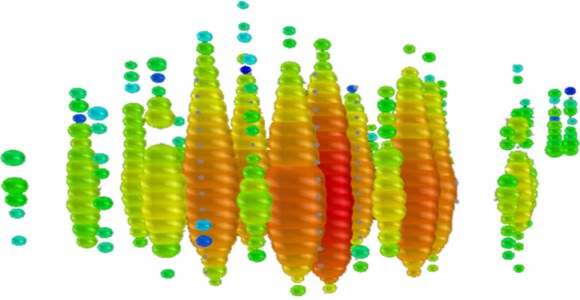
This event display shows “Bert,” one of two neutrino events discovered at IceCube whose energies exceeded one petaelectronvolt (PeV). The colors show when the light arrived, with reds being the earliest, succeeded by yellows, greens and blues. The size of the circle indicates the number of photons observed. Credit: Berkeley Labs.

High-energy neutrinos can pass through normal matter, and billions of neutrinos pass through the Earth every second. The vast majority of these are lower-energy particles that originate either in the Sun or in the Earth’s atmosphere. Far rarer are the high-energy neutrinos that more likely would have been created much farther from Earth in the most powerful cosmic events — gamma ray bursts, black holes, or the birth of stars. These neutrinos have been highly sought because they can carry information about the workings of the highest-energy and most-distant phenomena in the Universe.

“Scientists have been searching high and low for these super-energetic neutrinos using detectors buried under mountains, submerged in deep lakes and ocean trenches, lofted into the stratosphere by special balloons, and in the deep clear Antarctic ice at the South Pole,” said Doug Cowen, also from Penn State, who has worked on IceCube for over a decade. “To have finally seen them after all these years is immensely gratifying.”

IceCube is located inside a cubic kilometer of ice beneath the South Pole and is comprised of more than 5,000 digital optical modules melted into in a cubic kilometer of ice at the South Pole. The observatory detects neutrinos through the fleeting flashes of blue light produced when a neutrino interacts with a water molecule in the ice.

The IceCube collaboration said they are continuing to refine and expand the search with new data and new analysis techniques, which may reveal additional high-energy events and possibly point to their astrophysical source or sources.

For more information, see the teams paper in Science, a free version is available on arXiv, press releases from Berkeley Labs, Penn State, and DESY. More information about the IceCube collaboration is here.

New Dark Matter Detector Draws A Blank In First Test Round

Dark Energy
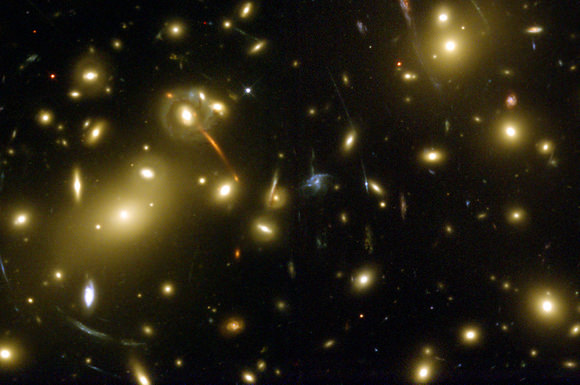
The Hubble Space Telescope image of the inner regions of the lensing cluster Abell 1689 that is 2.2 billion light?years away. Light from distant background galaxies is bent by the concentrated dark matter in the cluster (shown in the blue overlay) to produce the plethora of arcs and arclets that were in turn used to constrain dark energy. Image courtesy of NASA?ESA, Jullo (JPL), Natarajan (Yale), Kneib (LAM)

We keep saying dark matter is so very hard to find. Astronomers say they can see its effects — such as gravitational lensing, or an amazing bendy feat of light that takes place when a massive galaxy brings forward light from other galaxies behind it. But defining what the heck that matter is, is proving elusive. And considering it makes up most of the universe’s matter, it would be great to know what dark matter looks like.

A new experiment — billed as the most sensitive dark matter detector in the world — spent three months searching for evidence of weakly interacting massive particles (WIMPs), which may be the basis of dark matter. So far, nothing, but researchers emphasized they have only just started work.

“Now that we understand the instrument and its backgrounds, we will continue to take data, testing for more and more elusive candidates for dark matter,” stated physicist Dan McKinsey of Yale University, who is one of the collaborators on the Large Underground Xenon (LUX) detector.

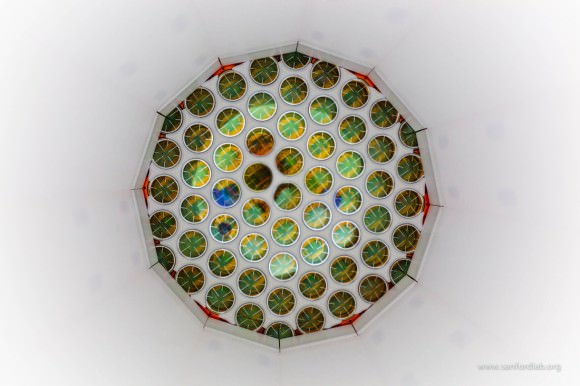
A view of the Large Underground Xenon (LUX) dark matter detector. Shown are photomultiplier tubes that can ferret out single photons of light. Signals from these photons told physicists that they had not yet found Weakly Interacting Massive Particles (WIMPs) Credit: Matthew Kapust / South Dakota Science and Technology Authority

LUX operates a mile (1.6 kilometers) beneath the Earth in the state-owned Sanford Underground Research Facility, which is located in South Dakota. The underground location is perfect for this kind of work because there is little interference from cosmic ray particles.

“At the heart of the experiment is a six-foot-tall titanium tank filled with almost a third of a ton of liquid xenon, cooled to minus 150 degrees Fahrenheit. If a WIMP strikes a xenon atom it recoils from other xenon atoms and emits photons (light) and electrons. The electrons are drawn upward by an electrical field and interact with a thin layer of xenon gas at the top of the tank, releasing more photons,” stated the Lawrence Berkeley National Laboratory, which leads operations at Sanford.

“Light detectors in the top and bottom of the tank are each capable of detecting a single photon, so the locations of the two photon signals – one at the collision point, the other at the top of the tank – can be pinpointed to within a few millimeters. The energy of the interaction can be precisely measured from the brightness of the signals.”

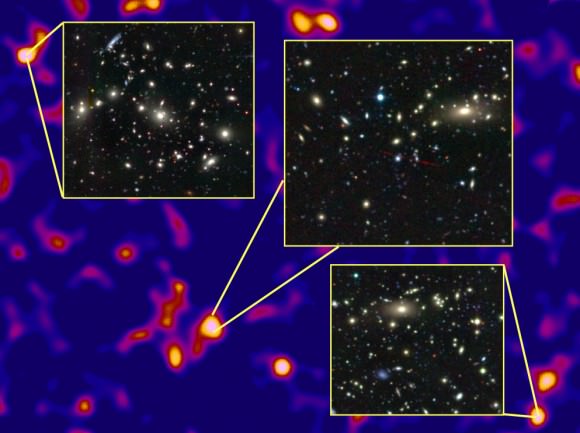
The densest regions of the dark matter cosmic web host massive clusters of galaxies. Credit: Van Waerbeke, Heymans, and CFHTLens collaboration.

LUX’s sensitivity for low-mass WIMPs is more than 20 times better than other detectors. That said, the detector was unable to confirm possible hints of WIMPs found in other experiments.

“Three candidate low-mass WIMP events recently reported in ultra-cold silicon detectors would have produced more than 1,600 events in LUX’s much larger detector, or one every 80 minutes in the recent run,” the laboratory added.

Don’t touch that dial yet, however. LUX plans to do more searching in the next two years. Also, the Sanford Lab is proposing an even more sensitive LUX-ZEPLIN experiment that would be 1,000 times more sensitive than LUX. No word yet on when LUX-ZEPLIN will get off the ground, however.

Source: Lawrence Berkeley National Laboratory

Cosmonaut Sergei Krikalev, the World’s Most Prolific Time Traveler

Sergei Krikalev gives a thumbs up during suit check before the launch of STS-88 in 1998. Credit: NASA.

Is time travel a fact or is it just science fiction? Thanks to time dilation and Einstein’s theory of relativity, we know that time travel can and actually does happen, albeit only in extremely tiny increments at the speeds and distances we can travel in space. If you add up the accumulated speed cosmonaut Sergei Krivalev has traveled in space – the most of any human with a total time spent in orbit of 803 days 9 hours and 39 minutes – he has actually time-traveled into his own future by 0.02 seconds.

Time dilation is caused by differences in either gravity or relative velocity — each of which affects time in different ways. When astronauts and satellites orbit the Earth, they are slightly further away from the center of the planet –compared to people on the ground – and so they actually experience less gravitational time dilation. This means the astronauts’ time would run slightly faster, and when they return to Earth, they’d have to “come back” to the past compared to when they were in space.

But time dilation due to velocity means that clocks for astronauts in space run slightly slower relative to people who are on the ground. When you come back to Earth, you’d be have to go into the future slightly to catch up with clocks on the ground.

The effect of time dilation due to gravity, however, “is quite small because Earth’s gravity is quite weak,” says educator Colin Stuart in this great instructional video from TedEd, “and so the time dilation due to their speed wins out and astronauts really do travel a tiny amount into their futures.”

But, as stated earlier, with our current technology limiting the velocities of astronauts, these differences are minuscule: after 6 months on the ISS, an astronaut has aged less than those on Earth, but only by about 0.007 seconds. The effects would be greater if we could get the ISS to orbit Earth at near the speed of light (approximately 300,000 km/s), instead of the actual speed of about 7.7 km/s.

This effect has been proven by GPS satellites, which orbit Earth at about 14,000 km/h (9,000 mph) which cuts several microseconds off their clocks daily, relative to clocks on Earth.

Watch the video for more information and see associated material from TedEd, or read these interesting articles from Huffington Post and DailyMail. Here are some calculations about time and the “Twin Paradox.”

And if you really want to know what time it is, check out the website for the primary atomic clock.

Higgs Boson Physicists Receive 2013 Nobel Prize

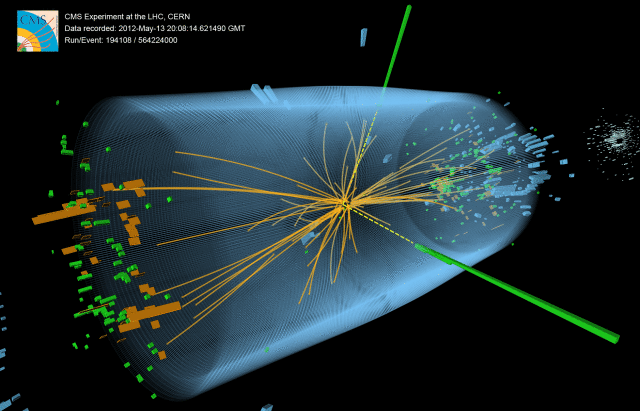
This is the signature of one of 100s of trillions of particle collisions detected at the Large Hadron Collider. The combined analysis lead to the discovery of the Higgs Boson. This article describes one team in dissension with the results. (Photo Credit: CERN)

That was fast! Just one year after a Higgs Boson-like particle was found at the Large Hadron Collider, the two physicists who first proposed its existence have received the Nobel Prize in Physics for their work. François Englert (of the former Free University of Brussels in Belgium) and Peter W. Higgs (at the University of Edinburgh in the United Kingdom) received the prize officially this morning (Oct. 8.)

The Brout-Englert-Higgs (BEH) mechanism was first described in two independent papers by these physicists in 1964, and is believed to be responsible for the amount of matter a particle contains. Higgs himself said this mechanism would be visible in a massive boson (or subatomic particle), later called the Higgs boson. Check out more information on what the particle means at this past Universe Today article by editor Nancy Atikinson.

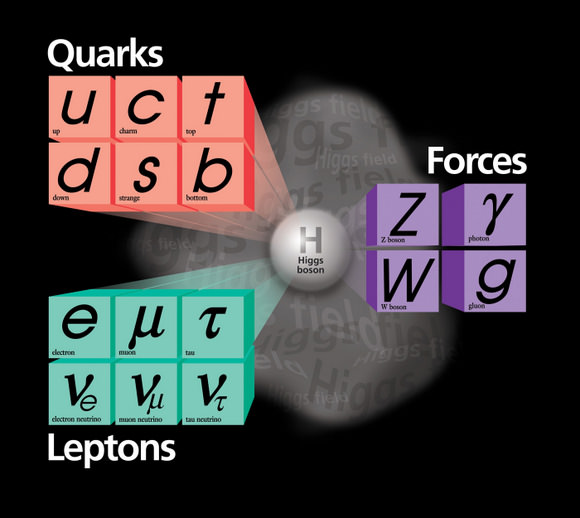
“The awarded theory is a central part of the Standard Model of particle physics that describes how the world is constructed. According to the Standard Model, everything, from flowers and people to stars and planets, consists of just a few building blocks: matter particles. These particles are governed by forces mediated by force particles that make sure everything works as it should,”  the Royal Swedish Academy of Sciences said in a statement.

The Standard Model describes the interactions of fundamental particles. The W boson, the carrier of the electroweak force, has a mass that is fundamentally relevant for many predictions, from the energy emitted by our sun to the mass of the elusive Higgs boson. Credit: Fermilab

“The entire Standard Model also rests on the existence of a special kind of particle: the Higgs particle. This particle originates from an invisible field that fills up all space. Even when the universe seems empty this field is there. Without it, we would not exist, because it is from contact with the field that particles acquire mass. The theory proposed by Englert and Higgs describes this process.”

A very thrilled CERN (the European Organization for Nuclear Research) noted that the Standard Model theory has been “remarkably successful”, and passed several key tests before the particle was unveiled last year in ATLAS and CMS experiments at the Large Hadron Collider.

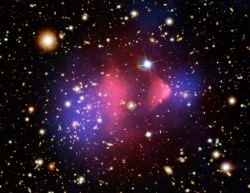
Dark matter in the Bullet Cluster.  Otherwise invisible to telescopic views, the dark matter was mapped by observations of gravitational lensing of background galaxies. Credit: X-ray: NASA/CXC/CfA/ M.Markevitch et al.; Lensing Map: NASA/STScI; ESO WFI; Magellan/U.Arizona/ D.Clowe et al. Optical: NASA/STScI; Magellan/U.Arizona/D.Clowe et al.;
Dark matter in the Bullet Cluster. Otherwise invisible to telescopic views, the dark matter was mapped by observations of gravitational lensing of background galaxies. Credit: X-ray: NASA/CXC/CfA/ M.Markevitch et al.; Lensing Map: NASA/STScI; ESO WFI; Magellan/U.Arizona/ D.Clowe et al. Optical: NASA/STScI; Magellan/U.Arizona/D.Clowe et al.;

“The discovery of the Higgs boson at CERN last year, which validates the Brout-Englert-Higgs mechanism, marks the culmination of decades of intellectual effort by many people around the world,” stated CERN director General Rolf Heuer.

CERN added that the discovery last year was exciting, but the Higgs boson only explains only the matter that we can see. CERN is among the organizations on the hunt for dark matter and energy, forms that can’t be sensed with conventional observatories but can be seen through their effects — such as gravitational lensing.

Sources: CERN, The Royal Swedish Academy of Sciences

A Capella String Theory: Bohemian Gravity (Video)

Image of 10 dimensional super strings. Credit: PBS.

There’s not much to say except you MUST watch this. Incredible.

Here is Tim Blais’ master’s thesis: A New Quantization Condition for Parity-Violating Three-Dimensional Gravity.

Words to the song below:

A Capella Science – Bohemian Gravity!

Is string theory right?
Is it just fantasy?
Caught in the landscape,
Out of touch with reality
Compactified
On S5 or T*S3

Space is a pure void
Why should it be stringy?
Because it’s quantum not classical
Nonrenormalizable
Any way you quantize
You’ll encounter infinity
You see

Quanta
Must interact
Via paths we understand
Using Feynman diagrams
Often, they will just rebound
But now and then they go another way
A quantum
Loooooop
Infinities will make you cry
Unless you can renormalize your model
Of baryons, fermions
And all other states of matter

Curved space:
The graviton
Can be thought of as a field
But these infinities are real
In a many-body
Loop diagram
Our results diverge no matter what we do…
A Quantum Soup (any way you quantize)
Kiss your fields goodbye
Guess Einstein’s theory wasn’t complete at all!

I see extended 1-D objects with no mass
What’s their use? What’s their use? Can they give us quark plasma?
What to minimize?
What functional describes this
String?
Nambu-Goto! (Nambu-Goto)
How to quantize I don’t know
Polyakov!
I’m just a worldsheet, please minimize me
He’s just a worldsheet from a string theory
Reperametrized by a Weyl symmetry!

Fermi, Bose, open, closed, orientable?
Vibrations
Modes! They become particles (particles!)
Vibrations
They become particles (particles!)
Vibrations
They become particles (particles!)
Become particles (particles!)
Become particles (many many many many particle…)
Modes modes modes modes modes modes modes!
Oh mamma mia mamma mia,
Such a sea of particles!
A tachyon, with a dilaton and gravity-vity-VITY

(rock out!)

Now we need ten dimensions and I’ll tell you why
(anomaly cancellation!)
So to get down to 4D we compactify!
Oh, Kahler!
(Kahler manifold)
Manifolds must be Kahler!
(Complex Reimannian symplectic form)
If we wanna preserve
Any of our super-symmetry

(Superstrings of type I, IIa and IIb)
(Heterotic O and Heterotic E)
(All are one through S and T duality)
(Thank you Ed Witten for that superstring revolution and your new M-theory!)

(Maldecena!)
(Super-Yang-Mills!)
(Type IIB String!)
Dual! Dual!
(In the AdS/CFT)
(Holography!)

Molecules and atoms
Light and energy
Time and space and matter
All from one united
Theory

Any way you quantize…

Lyrics and arrangement by Tim Blais and A Capella Science
Original music by Queen

Why “The Big Bang” Is a Terrible Name

Have a discussion about the origins of the Universe and, ere long, someone will inevitably use the term “the Big Bang” to describe the initial moment of expansion of everything that was to everything that is. But in reality “Big Bang” isn’t a very good term since “big” implies size (and when it occurred space didn’t technically exist yet) and there was no “bang.” In fact the name wasn’t ever even meant to be an official moniker, but once it was used (somewhat derisively) by British astronomer Sir Fred Hoyle in a radio broadcast in 1949, it stuck.

Unfortunately it’s just so darn catchy.

This excellent video from minutephysics goes a bit more into depth as to why the name is inaccurate — even though we’ll likely continue using it for quite some time. (Thanks to Sir Hoyle.)

And you have to admit, a television show called “The Everywhere Stretch Theory” would never have caught on. Bazinga!

Is the Sun More Active Than it Looks? An Innovative Method to Characterize the Solar Cycle

A solar cycle montage from August 1991 to September 2001 in X-rays courtesy of the Yohkoh Solar Observatory. (Credit: David Chenette, Joseph B. Gurman, Loren W. Acton, image in the public Domain).

The Sun has provided no shortage of mysteries thus far during solar cycle #24.

And perhaps the biggest news story that the Sun has generated recently is what it isn’t doing. As Universe Today recently reported, this cycle has been an especially weak one in terms of performance. The magnetic polarity flip signifying the peak of the solar maximum is just now upon us, as the current solar cycle #24 got off to a late start after a profound minimum in 2009…

Or is it?

Exciting new research out of the University of Michigan in Ann Arbor’s Department of Atmospheric, Oceanic and Space Sciences published in The Astrophysical Journal this past week suggests that we’re only looking at a portion of the puzzle when it comes to solar cycle activity.

Traditional models rely on the monthly averaged sunspot number. This number correlates a statistical estimation of the number of sunspots seen on the Earthward facing side of the Sun and has been in use since first proposed by Rudolf Wolf in 1848. That’s why you also hear the relative sunspot number sometimes referred to as the Wolf or Zürich Number.

But sunspot numbers may only tell one side of the story. In their recent paper titled Two Novel Parameters to Evaluate the Global Complexity of the Sun’s Magnetic Field and Track the Solar Cycle, researchers Liang Zhao, Enrico Landi and Sarah E. Gibson describe a fresh approach to model solar activity via looking at the 3-D dynamics heliospheric current sheet.

The spiralling curve of the heliospheric current sheet through the inner solar system. (Graphic credit: NASA).
The spiraling curve of the heliospheric current sheet through the inner solar system. (Graphic credit: NASA).

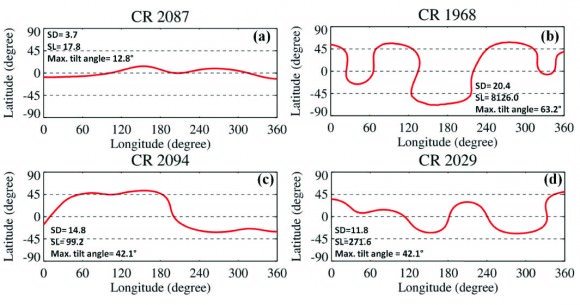
The heliospheric current sheet (or HCS) is the boundary of the Sun’s magnetic field separating the northern and southern polarity regions which extends out into the solar system. During the solar minimum, the sheet is almost flat and skirt-like. But during solar maximum, it’s tilted, wavy and complex.

Two variables, known as SD & SL were used by researchers in the study to produce a measurement that can characterize the 3-D complexity of the HCS.  “SD is the standard deviation of the latitudes of the HCS’s position on each of the Carrington maps of the solar surface, which basically tells us how far away the HCS is distributed from the equator. And SL is the integral of the slope of HCS on that map, which can tell us how wavy the HCS is on each of the map,” Liang Zhao told Universe Today.

Ground and space-based observations of the Sun’s magnetic field exploit a phenomenon known as the Zeeman Effect, which was first demonstrated during solar observations conducted by George Ellery Hale using his new fangled invention of the spectrohelioscope in 1908. For the recent study, researchers used data covering a period from 1975 through 2013 to characterize the HCS data available online from the Wilcox Solar Observatory.

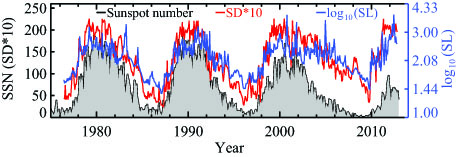
SD and SL perameters juxtaposed against the tradional monthly sunspot number.
SD and SL parameters juxtaposed against the traditional monthly sunspot number (SSN). Note the smooth fit until the end of solar cycle #23 around 2003. (Credit: Liang Zhao/The Astrophysical Journal).

Comparing the HCS value against previous sunspot cycles yields some intriguing results. In particular, comparing the SD and SL values with the monthly sunspot  number provide a “good fit” for the previous three solar cycles— right up until cycle #24.

“Looking at the HCS, we can see that the Sun began to act strange as early as 2003,” Zhao said. “This current cycle as characterized by the monthly sunspot number started a year late, but in terms of HCS values, the maximum of cycle #24 occurred right on time, with a first peak in late 2011.”

“Scientists believe there will be two peaks in the sunspot number in this solar maximum as in the previous maximum (in ~2000 and ~2002),” Zhao continued, “since the Sun’s magnetic fields in the north and south hemispheres look asymmetric, and the north evolved faster than the south recently. But so far as I can see, the highest value of monthly-averaged sunspot number in this cycle 24 is still the one in the November 2011. So we can say the first peak of cycle 24 could be in November of 2011, since it is the highest monthly sunspot number so far in this cycle. If there is a second peak, we will see it sooner or later.”

The paper also notes that although cycle 24 is especially weak when compared to recent cycles, its range of activity is not unique when compared with solar cycles over the past 260 years.

HCS curves plotted on the surface of the Sun.
HCS curves plotted on the surface of the Sun. Comparisons are made for the solar maximum on October 2000 (CR 1968), descending phase on April 2005 (2029), solar minimum on September 2009 (CR 2087), and ascending phase on March 2010 (CR2094). CR=Carrington Rotation. (Credit: Liang Zhao, The Astrophysical Journal).

The HCS value characterizes the Sun over one complete Carrington Rotation of 27 days. This is an averaged value for the rotation of the Sun, as the poles rotate slower than the equatorial regions.

The approximately 22 year span of time that it takes for the poles to reverse back to the same polarity again is equal to two average 11 year sunspot cycles. The Sun’s magnetic field has been exceptionally asymmetric during this cycle, and as of this writing, the Sun has already finished its reversal of the north pole first.

This sort of asymmetry during an imminent pole reversal was first recorded during solar cycle 19, which spanned 1954-1964. Solar cycles are numbered starting from observations which began in 1749, just four decades after the end of the 70-year Maunder Minimum.

“This is an exciting time to study the magnetic field of the Sun, as we may be witnessing a return to a less-active type of cycle, more like those of 100 years ago,” NCAR/HAO senior scientist and co-author Sarah Gibson said.

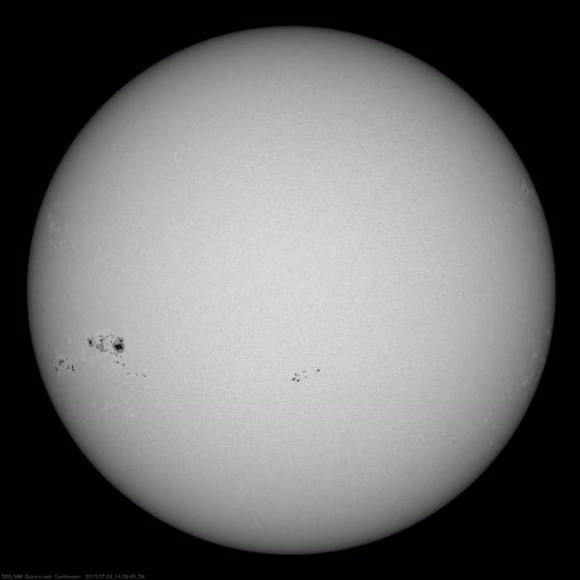
A massive sunspot group that rotated into view in early July, 2013... one of the largest seen for solar cycle #24 thus far. (Credit: NASA/SDO).
A massive sunspot group that rotated into view in early July, 2013, one of the largest seen for solar cycle #24 thus far. (Credit: NASA/SDO).

But this time, an armada of space and ground-based observatories will scrutinize our host star like never before. The SOlar Heliospheric Observatory (SOHO) has already followed the Sun through the equivalent of one complete solar cycle— and it has now been joined in space by STEREO A & B, JAXA’s Hinode, ESA’s Proba-2 and NASA’s Solar Dynamics Observatory. NASA’s Interface Region Imaging Spectrograph (IRIS) was also launched earlier this year and has just recently opened for business.

Will there be a second peak following the magnetic polarity reversal of the Sun’s south pole, or is Cycle #24 about to “leave the building?” And will Cycle #25 be absent all together, as some researchers suggest? What role does the solar cycle play in the complex climate change puzzle? These next few years will prove to be exciting ones for solar science, as the predictive significance of HCS SD & SL values are put to the test… and that’s what good science is all about!

-Read the abstract with a link to the full paper in The Astrophysical Journal by University of Michigan researchers here.

Book Review: “The Universe in the Rearview Mirror: How Hidden Symmetries Shape Reality” by Dave Goldberg

It’s not every day that you find a Physics book that is both wonderfully thorough and wildly entertaining – but, then again, it’s not every day that Dave Goldberg publishes a book; he’d be quite the busy boy if that was the case. But as writer for the fantastic Ask a Physicist column on io9.com (seriously, check it out), professor and director of undergraduate studies at Drexel University, Slate and LA Times contributor, husband and father – he’s plenty busy already. As an avid reader of Ask A Physicist, I was already familiar with his entertaining writing style – but getting to enjoy it in a full-length book was quite the treat.

Enter The Universe In The Rearview Mirror. Although many recent physics books focus almost entirely on the oddities of quantum mechanics, Goldberg steps outside the now almost tiresome discussions of randomness and Schrodinger’s Cat to enlighten readers on a topic less often discussed, but just as (if not more) fascinating – symmetry. Goldberg’s perusal of symmetry extends far beyond your Elementary School-inspired notions of bilaterally symmetric shapes into questions about the origins, shape and inevitable fate of the universe – among many others!

At most times in Rearview Mirror, Goldberg’s style feels more like a discussion than a book – it’s as if your delightfully nerdy friend from college (the one with a knack for identifying stars, he’s convinced it’s a total turn-on) came over for dinner one night to talk about his favorite topic – the mysteries of the cosmos. Even with the conversational essence, Goldberg is sure to never get bogged down in scientific jargon,instead he frequently relies on allusions and analogies to get his point across.

In the book’s first five pages alone Goldberg makes creative allusions to Star Wars, Angels & Demons, Isaac Asimov, The Incredible Hulk, Twilight , and Star Trek. In the world of science writing since The Big Bang Theory, countless authors have tried to appeal to the “nerdy” sub-genre, but the allusions and comparisons in most books typically seem forced, even irrelevant at times. Perhaps due to his extensive teaching experience, this is never the case with Goldberg’s writing – every allusion is spot-on and fascinating, even Feynman-like at times. Never before had I thought of Lewis Carroll’s Alice jumping down the rabbit hole when discussing a black hole, and now I’ll never be able to think of taking the plunge without doing so.

Throughout the slightly-over-300-page-journey, readers explore fascinating conundrums posed as the subtitle of every chapter, concerning topics like Antimatter (“why there is something rather than nothing”), The Cosmological Principle (“why it is dark at night”) and quantum Spin (“why you aren’t a sentient cloud of helium and what a spoonful of neutron star would do to you”). Although each chapter does seek to answer these questions, the excitement comes from Goldberg’s masterful leadership – he paves the way with insightful analogies and surprisingly digestible descriptions of complex concepts (no equations allowed).

Once the journey is over, readers will not only have a thorough understanding of how symmetry truly shapes our universe, but also a plethora of exciting dinner conversations sure to spice up any date – “Hey, did you know that poker can teach us a lot about entropy?”

Neutron Stars: A Cataclysmic Conception

This "SWASI" phenomenon is an analogue of the SASI instability occurring in the supernova core, but it is one million times smaller and about one hundred times slower than its astrophysical counterpart. (Image copyrights: Thierry Foglizzo, Laboratoire AIM Paris-Saclay, CEA)

It’s one of the most intense and violent of all events in space – a supernova. Now a team of researchers at the Max Planck Institute for Astrophysics have been taking a very specialized look at the formation of neutron stars at the center of collapsing stars. Through the use of sophisticated computer simulations, they have been able to create three-dimensional models which show the physical effects – intense and violent motions which occur when stellar matter is drawn inward. It’s a bold, new look into the dynamics which happen when a star explodes.

As we know, stars which have eight to ten times the mass of the Sun are destined to end their lives in a massive explosion, the gases blown into space with incredible force. These cataclysmic events are among the brightest and most powerful events in the Universe and can outshine a galaxy when they occur. It is this very process which creates elements critical to life as we know it – and the beginnings of neutron stars.

Neutron stars are an enigma unto themselves. These highly compact stellar remnants contain as much as 1.5 times the mass of the Sun, yet are compressed to the size of a city. It is not a slow squeeze. This compression happens when the stellar core implodes from the intense gravity of its own mass… and it takes only a fraction of a second. Can anything stop it? Yes. It has a limit. Collapse ceases when the density of the atomic nuclei is exceeded. That’s comparable to around 300 million tons compressed into something the size of a sugar cube.

Studying neutron stars opens up a whole new dimension of questions which scientists are keen to answer. They want to know what causes stellar disruption and how can the implosion of the stellar core revert to an explosion. At present, they theorize that neutrinos may be a critical factor. These tiny elemental particles are created and expelled in monumental numbers during the supernova process and may very well act as heating elements which ignite the explosion. According to the research team, neutrinos could impart energy into the stellar gas, causing it to build up pressure. From there, a shock wave is created and as it speeds up, it could disrupt the star and cause a supernova.

As plausible as it might sound, astronomers aren’t sure if this theory could work or not. Because the processes of a supernova cannot be recreated under laboratory conditions and we’re not able to directly see into the interior of a supernovae, we’ll just have to rely on computer simulations. Right now, researchers are able to recreate a supernova event with complex mathematical equations which replicate the motions of stellar gas and the physical properties which happen at the critical moment of core collapse. These types of computations require the use of some of the most powerful supercomputers in the world, but it has also been possible to use more simplified models to get the same results. “If, for example, the crucial effects of neutrinos were included in some detailed treatment, the computer simulations could only be performed in two dimensions, which means that the star in the models was assumed to have an artificial rotational symmetry around an axis.” says the research team.

With the support of the Rechenzentrum Garching (RZG), scientists were able to create in a singularly efficient and fast computer program. They were also given access to most powerful supercomputers, and a computer time award of nearly 150 million processor hours, which is the greatest contingent so far granted by the “Partnership for Advanced Computing in Europe (PRACE)” initiative of the European Union, the team of researchers at the Max Planck Institute for Astrophysics (MPA) in Garching could now for the first time simulate the processes in collapsing stars in three dimensions and with a sophisticated description of all relevant physics.

“For this purpose we used nearly 16,000 processor cores in parallel mode, but still a single model run took about 4.5 months of continuous computing”, says PhD student Florian Hanke, who performed the simulations. Only two computing centers in Europe were able to provide sufficiently powerful machines for such long periods of time, namely CURIE at Très Grand Centre de calcul (TGCC) du CEA near Paris and SuperMUC at the Leibniz-Rechenzentrum (LRZ) in Munich/Garching.

Turbulent evolution of a neutron star for six moments (0.154, 0.223, 0.240, 0.245, 0.249 and 0.278 seconds) after the beginning of the neutron star formation in a threedimensional computer simulation. The mushroom-like bubbles are characteristic of "boiling" neutrino-heated gas, whereas simultaneously the "SASI" instability causes wild sloshing and rotational motions of the whole neutrino-heated layer (red) and of the enveloping supernova shock (blue) . (Images by Elena Erastova and Markus Rampp, RZG)
Turbulent evolution of a neutron star for six moments (0.154, 0.223, 0.240, 0.245, 0.249 and 0.278 seconds) after the beginning of the neutron star formation in a threedimensional computer simulation. The mushroom-like bubbles are characteristic of “boiling” neutrino-heated gas, whereas simultaneously the “SASI” instability causes wild sloshing and rotational motions of the whole neutrino-heated layer (red) and of the enveloping supernova shock (blue) . (Images by Elena Erastova and Markus Rampp, RZG)
Given several thousand billion bytes of simulation data, it took some time before researchers could fully understand the implications of their model runs. However, what they saw both elated and surprised them. The stellar gas performed in a manner very much like ordinary convection, with the neutrinos driving the heating process. And that’s not all… They also found strong sloshing motions which transiently change to rotational motions. This behavior has been observed before and named Standing Accretion Shock Instability. According to the news release, “This term expresses the fact that the initial sphericity of the supernova shock wave is spontaneously broken, because the shock develops large-amplitude, pulsating asymmetries by the oscillatory growth of initially small, random seed perturbations. So far, however, this had been found only in simplified and incomplete model simulations.”

“My colleague Thierry Foglizzo at the Service d’ Astrophysique des CEA-Saclay near Paris has obtained a detailed understanding of the growth conditions of this instability”, explains Hans-Thomas Janka, the head of the research team. “He has constructed an experiment, in which a hydraulic jump in a circular water flow exhibits pulsational asymmetries in close analogy to the shock front in the collapsing matter of the supernova core.” Known as Shallow Water Analogue of Shock Instability, the dynamic process can be demonstrated in less technicalized manners by eliminating the important effects of neutrino heating – a reason which causes many astrophysicists to doubt that collapsing stars might go through this type of instability. However, the new computer models are able to demonstrate the Standing Accretion Shock Instability is a critical factor.

“It does not only govern the mass motions in the supernova core but it also imposes characteristic signatures on the neutrino and gravitational-wave emission, which will be measurable for a future Galactic supernova. Moreover, it may lead to strong asymmetries of the stellar explosion, in course of which the newly formed neutron star will receive a large kick and spin”, describes team member Bernhard Müller the most significant consequences of such dynamical processes in the supernova core.

Are we finished with supernova research? Do we understand everything there is to know about neutron stars? Not hardly. At the present time, the scientist are ready to further their investigations into the measurable effects connected to SASI and refine their predictions of associated signals. In the future they will further their understanding by performing more and longer simulations to reveal how instability and neutrino heating react together. Perhaps one day they’ll be able to show this relationship to be the trigger which ignites a supernova explosion and conceives a neutron star.

Original Story Source: Max Planck Institute for Astrophysics News Release.

Recurrent Novae, Light Echoes, and the Mystery of T Pyxidis

A sequence of images showing the light echo (circled) enshrouding T Pyxidis months after the April 2011 outburst. (Credit: NASA/ESA/A. Crotts/J. Sokoloski, H. Uthas & S. Lawrence).

Some of the most violent events in our Universe were the topic of discussion this morning at the 222nd meeting of the American Astronomical Society in Indianapolis, Indiana as researchers revealed recent observations of light echoes seen as the result of stellar explosions.

A light echo occurs when we see dust and ejected material illuminated by a brilliant nova. A similar phenomenon results in what is termed as a reflection nebula. A star is said to go nova when a white dwarf star siphons off material from a companion star. This accumulated hydrogen builds up under terrific pressure, sparking a brief outburst of nuclear fusion.

A very special and rare case is a class of cataclysmic variables known as recurrent novae. Less than dozen of these types of stars are known of in our galaxy, and the most famous and bizarre case is that of T Pyxidis.

Located in the southern constellation of Pyxis, T Pyxidis generally hovers around +15th magnitude, a faint target even in a large backyard telescope. It has been prone, however, to great outbursts approaching naked eye brightness roughly every 20 years to magnitude +6.4. That’s a change in brightness almost 4,000-fold.

But the mystery has only deepened surrounding this star. Eight outbursts were monitored by astronomers from 1890 to 1966, and then… nothing. For decades, T Pyxidis was silent. Speculation shifted from when T Pyxidis would pop to why this star was suddenly undergoing a lengthy phase of silence.

Could models for recurrent novae be in need of an overhaul?

T Pyxidis finally answered astronomers’ questions in 2011, undergoing its first outburst in 45 years. And this time, they had the Hubble Space Telescope on hand to witness the event.

Light curve of the 2011 eruption of T Pyxidis. (Credit: AAVSO).

In fact, Hubble had just been refurbished during the final visit of the space shuttle Atlantis to the orbiting observatory in 2009 on STS-125 with the installation of its Wide Field Camera 3, which was used to monitor the outburst of T Pyxidis.

The Hubble observation of the light echo provided some surprises for astronomers as well.

“We fully expected this to be a spherical shell,” Said Columbia University’s Arlin Crotts, referring to the ejecta in the vicinity of the star. “This observation shows it is a disk, and it is populated with fast-moving ejecta from previous outbursts.”

Indeed, this discovery raises some exciting possibilities, such as providing researchers with the ability to map the anatomy of previous outbursts from the star as the light echo evolves and illuminates the 3-D interior of the disk like a Chinese lantern. The disk is inclined about 30 degrees to our line of sight, and researchers suggest that the companion star may play a role in the molding of its structure from a sphere into a disk. The disk of material surrounding T Pyxidis is huge, about 1 light year across. This results in an apparent ring diameter of 6 arc seconds (about 1/8th the apparent size of Jupiter at opposition) as seen from our Earthly vantage point.

Paradoxically, light echoes can appear to move at superluminal speeds. This illusion is a result of the geometry of the path that the light takes to reach the observer, crossing similar distances but arriving at different times.

And speaking of distance, measurement of the light echoes has given astronomers another surprise. T Pyxidis is located about 15,500 light years distant, at the higher 10% end of the previous 6,500-16,000 light year estimated range. This means that T Pyxidis is an intrinsically bright object, and its outbursts are even more energetic than thought.

Light echoes have been studied surrounding other novae, but this has been the first time that scientists have been able to map them extensively in 3 dimensions.

An artist's conception of the disk of material surrounding T Pyxidis. (Credit: ESA/NASA & A. Feild STScl/AURA).
An artist’s conception of the disk of material surrounding T Pyxidis. (Credit: ESA/NASA & A. Feild STScl/AURA).

“We’ve all seen how light from fireworks shells during the grand finale will light up the smoke and soot from the shells earlier in the show,” said team member Stephen Lawrence of Hofstra University. “In an analogous way, we’re using light from T Pyx’s latest outburst and its propagation at the speed of light to dissect its fireworks displays from decades past.”

Researchers also told Universe Today of the role which amateur astronomers have played in monitoring these outbursts. Only so much “scope time” exists, very little of which can be allocated exclusively to the study of  light echoes. Amateurs and members of the American Association of Variable Star Observers (AAVSO) are often the first to alert the pros that an outburst is underway. A famous example of this occurred in 2010, when Florida-based backyard observer Barbara Harris was the first to spot an outburst from recurrent novae U Scorpii.

And although T Pyxidis may now be dormant for the next few decades, there are several other recurrent novae worth continued scrutiny:

Name Max brightness Right Ascension Declination Last Eruption Period(years)
U Scorpii +7.5 16H 22’ 31” -17° 52’ 43” 2010 10
T Pyxidis +6.4 9H 04’ 42” -32° 22’ 48” 2011 20
RS Ophiuchi +4.8 17H 50’ 13” -6° 42’ 28” 2006 10-20
T Coronae Borealis +2.5 15H 59’ 30” 25° 55’ 13” 1946 80?
WZ Sagittae +7.0 20H 07’ 37” +17° 42’ 15” 2001 30


Clearly, recurrent novae have a tale to tell us of the role they play in the cosmos. Congrats to Lawrence and team on the discovery… keep an eye out from future fireworks from this rare class of star!

Read the original NASA press release and more on T Pyxidis here.