Astronomy Without A Telescope – Special Relativity From First Principles

CAPTION

[/caption]

Einstein’s explanation of special relativity, delivered in his 1905 paper On the Electrodynamics of Moving Bodies focuses on demolishing the idea of ‘absolute rest’, exemplified by the theoretical luminiferous aether. He achieved this very successfully, but many hearing that argument today are left puzzled as to why everything seems to depend upon the speed of light in a vacuum.

Since few people in the 21st century need convincing that the luminiferous aether does not exist, it is possible to come at the concept of special relativity in a different way and just through an exercise of logic deduce that the universe must have an absolute speed – and from there deduce special relativity as a logical consequence.

The argument goes like this:

1) There must be an absolute speed in any universe since speed is a measure of distance moved over time. Increasing your speed means you reduce your travel time between a distance A to B. A kilometre walk to the shops might take 25 minutes, but if you run it might take only 15 minutes – and if you take the car, only 2 minutes. At least theoretically you should be able to increase your speed up to the point where that travel time reaches zero – and whatever speed you are at when that happens will represent the universe’s absolute speed.

2) Now consider the principle of relativity. Einstein talked about trains and platforms to describe different inertial frame of references. So for example, you can measure someone throwing a ball forward at 10 km/hr on the platform. But put that someone on the train which is travelling at 60 km/hr and then the ball measurably moves forward at nearly 70 km/hr (relative to the platform).

3) Point 2 is a big problem for a universe that has an absolute speed (see Point 1). For example, if you had an instrument that projected something forward at the absolute speed of the universe and then put that instrument on the train – you would expect to be able to measure something moving at the absolute speed + 60 km/hr.

4) Einstein deduced that when you observe something moving in a different frame of reference to your own, the components of speed (i.e. distance and time), must change in that other frame of reference to ensure that anything that moves can never be measured moving at a speed greater than the absolute speed.

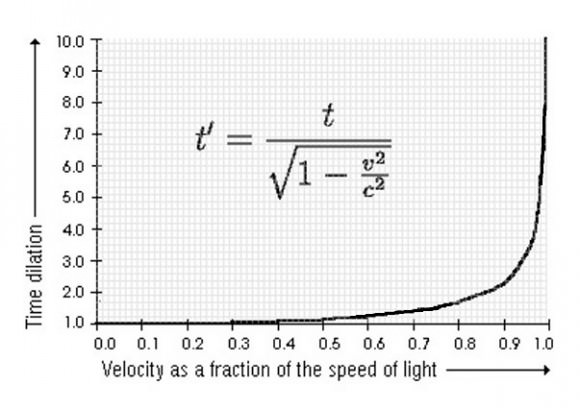
Thus on the train, distances should contract and time should dilate (since time is the denominator of distance over time).

The effect of relative motion. Measurable time dilation is negligible on a train moving past a platform at 60 km/hr, but increases dramatically if that train acquires the capacity to approach the speed of light. Time (and distance) will change to ensure that light speed is always light speed, not light speed + the speed of the train.

And that’s it really. From there one can just look to the universe for examples of something that always moves at the same speed regardless of frame of reference. When you find that something, you will know that it must be moving at the absolute speed.

Einstein offers two examples in the opening paragraphs of On the Electrodynamics of Moving Bodies:

  • the electromagnetic output produced by the relative motion of a magnet and an induction coil is the same whether the magnet is moved or whether the coil is moved (a finding of James Clerk Maxwell‘s electromagnetic theory) and;
  • the failure to demonstrate that the motion of the Earth adds any additional speed to a light beam moving ahead of the Earth’s orbital trajectory (presumably an oblique reference to the 1887 Michelson-Morley experiment).

In other words, electromagnetic radiation (i.e. light) demonstrated the very property that would be expected of something which moved at the absolute speed that it is possible to move in our universe.

The fact that light happens to move at the absolute speed of the universe is useful to know – since we can measure the speed of light and hence we can then assign a numerical value to the universe’s absolute speed (i.e. 300,000 km/sec), rather than just calling it c.

Further reading:
None! That was AWAT #100 – more than enough for anyone. Thanks for reading, even if it was just today. SN.

Looking at Early Black Holes with a ‘Time Machine’

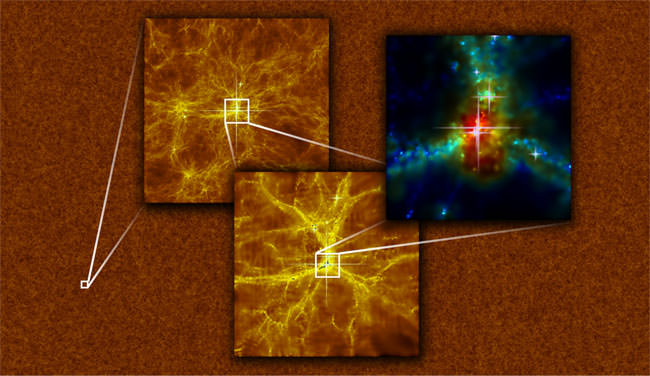
The large scale cosmological mass distribution in the simulation volume of the MassiveBlack. The projected gas density over the whole volume ('unwrapped' into 2D) is shown in the large scale (background) image. The two images on top show two zoom-in of increasing factor of 10, of the regions where the most massive black hole - the first quasars - is formed. The black hole is at the center of the image and is being fed by cold gas streams. Image Courtesy of Yu Feng.

[/caption]

What fed early black holes enabling their very rapid growth? A new discovery made by researchers at Carnegie Mellon University using a combination of supercomputer simulations and GigaPan Time Machine technology shows that a diet of cosmic “fast food” (thin streams of cold gas) flowed uncontrollably into the center of the first black holes, causing them to be “supersized” and grow faster than anything else in the Universe.

When our Universe was young, less than a billion years after the Big Bang, galaxies were just beginning to form and grow. According to prior theories, black holes at that time should have been equally small. Data from the Sloan Digital Sky Survey has shown evidence to the contrary – supermassive black holes were in existence as early as 700 million years after the Big Bang.

“The Sloan Digital Sky Survey found supermassive black holes at less than 1 billion years. They were the same size as today’s most massive black holes, which are 13.6 billion years old,” said Tiziana Di Matteo, associate professor of physics (Carnegie Mellon University). “It was a puzzle. Why do some black holes form so early when it takes the whole age of the Universe for others to reach the same mass?”

Supermassive black holes are the largest black holes in existence – weighing in with masses billions of times that of the Sun. Most “normal” black holes are only about 30 times more massive than the Sun. The currently accepted mechanism for the formation of supermassive black holes is through galactic mergers. One problem with this theory and how it applies to early supermassive black holes is that in early Universe, there weren’t many galaxies, and they were too distant from each other to merge.

Rupert Croft, associate professor of physics (Carnegie Mellon University) remarked, “If you write the equations for how galaxies and black holes form, it doesn’t seem possible that these huge masses could form that early, But we look to the sky and there they are.”

In an effort to understand the processes that formed the early supermassive black holes, Di Matteo, Croft and Khandai created MassiveBlack – the largest cosmological simulation to date. The purpose of MassiveBlack is to accurately simulate the first billion years of our universe. Describing MassiveBlack, Di Matteo remarked, “This simulation is truly gigantic. It’s the largest in terms of the level of physics and the actual volume. We did that because we were interested in looking at rare things in the universe, like the first black holes. Because they are so rare, you need to search over a large volume of space”.

Croft and the team started the simulations using known models of cosmology based on theories and laws of modern day physics. “We didn’t put anything crazy in. There’s no magic physics, no extra stuff. It’s the same physics that forms galaxies in simulations of the later universe,” said Croft. “But magically, these early quasars, just as had been observed, appear. We didn’t know they were going to show up. It was amazing to measure their masses and go ‘Wow! These are the exact right size and show up exactly at the right point in time.’ It’s a success story for the modern theory of cosmology.”

The data from MassiveBlack was added to the GigaPan Time Machine project. By combining the MassiveBlack data with the GigaPan Time Machine project, researchers were able to view the simulation as if it was a movie – easily panning across the simulated universe as it formed. When the team noticed events which appeared interesting, they were also able to zoom in to view the events in greater detail than what they could see in our own universe with ground or space-based telescopes.

When the team zoomed in on the creation of the first supermassive black holes, they saw something unexpected. Normal observations show that when cold gas flows toward a black hole it is heated from collisions with other nearby gas molecules, then cools down before entering the black hole. Known as ‘shock heating’, the process should have stopped early black holes from reaching the masses observed. Instead, the team observed thin streams of cold dense gas flowing along ‘filaments’ seen in large-scale surveys that reveal the structure of our universe. The filaments allowed the gas to flow directly into the center of the black holes at incredible speed, providing them with cold, fast food. The steady, but uncontrolled consumption provided a mechanism for the black holes to grow at a much faster rate than their host galaxies.

The findings will be published in the Astrophysical Journal Letters.

If you’d like to read more, check out the papers below ( via Physics arXiv ):
Terapixel Imaging of Cosmological Simulations
The Formation of Galaxies Hosting z~6 Quasars
Early Black Holes in Cosmological Simulations
Cold Flows and the First Quasars

Learn more about Gigapan and MassiveBlack at: http://gigapan.org/gigapans/76215/ and http://www.psc.edu/science/2011/supermassive/

Source: Carnegie Mellon University Press Release

Particle Physicists Put the Squeeze on the Higgs Boson; Look for Conclusive Results in 2012

Scientists gather as the ATLAS and CMS experiments present the status of their searches for the Standard Model Higgs boson. Credit: CERN

[/caption]

With “freshly squeezed” plots from the latest data garnered by two particle physics experiments, teams of scientists from the Large Hadron Collider at CERN, the European Center for Nuclear Research, said Tuesday they had recorded “tantalizing hints” of the elusive subatomic particle known as the Higgs Boson, but cannot conclusively say it exists … yet. However, they predict that 2012 collider runs should bring enough data to make the determination.

“The very fact that we are able to show the results of very sophisticated analysis just one month after the last bit of data we used has been recorded is very reassuring,” Dr. Greg Landsberg, physics coordinator for the Compact Muon Solenoid (CMS) detector at the LHC told Universe Today. “It tells you how quick the turnaround time is. This is truly unprecedented in the history of particle physics, with such large and complex experiments producing so much data, and it’s very exciting.”

For now, the main conclusion of over 6,000 scientists on the combined teams from CMS and the ATLAS particle detectors is that they were able to constrain the mass range of the Standard Model Higgs boson — if it exists — to be in the range of 116-130 GeV by the ATLAS experiment, and 115-127 GeV by CMS.

The Standard Model is the theory that explains the interactions of subatomic particles – which describes ordinary matter that the Universe is made of — and on the whole works very well. But it doesn’t explain why some particles have mass and others don’t, and it also doesn’t describe the 96% of the Universe that is invisible.

In 1964, physicist Peter Higgs and colleagues proposed the existence of a mysterious energy field that interacts with some subatomic particles more than others, resulting in varying values for particle mass. That field is known as the Higgs field, and the Higgs Boson is the smallest particle of the Higgs field. But the Higgs Boson hasn’t been discovered yet, and one of the main reasons the LHC was built was to try to find it.

To look for these tiny particles, the LHC smashes high-energy protons together, converting some energy to mass. This produces a spray of particles which are picked up by the detectors. However, the discovery of the Higgs relies on observing the particles these protons decay into rather than the Higgs itself. If they do exist, they are very short lived and can decay in many different ways. The problem is that many other processes can also produce the same results.

How can scientists tell the difference? A short answer is that if they can figure out all the other things that can produce a Higgs-like signal and the typical frequency at which they will occur, then if they see more of these signals than current theories suggest, that gives them a place to look for the Higgs.

The experiments have seen excesses in similar ranges. And as the CERN press release noted, “Taken individually, none of these excesses is any more statistically significant than rolling a die and coming up with two sixes in a row. What is interesting is that there are multiple independent measurements pointing to the region of 124 to 126 GeV.”

“This is very promising,” said Landsberg, who is also a professor at Brown University. “This shows that both experiments understand what is going on with their detectors very, very well. Both calibrations saw excesses at low masses. But unfortunately the nature of our process is statistical and statistics is known to play funny tricks once in a while. So we don’t really know — we don’t have enough evidence to know — if what we saw is a glimpse of the Higgs Boson or these are just statistical fluctuations of the Standand Model process which mimic the same type of signatures as would come if the Higgs Boson is produced.”

Landsberg said the only way to cope with statistics is to get more data, and the scientists need to increase the size of the data samples considerably in order to definitely answer the question on whether the Higgs Boson exists at the mass of 125 GeV or any mass range which hasn’t been excluded yet.

The good news is that loads of data are coming in 2012.

“We hope to quadruple the data sample collected this year,” Landsberg said. “And that should give us enough statistical confidence to essentially solve this puzzle and tell the world whether we saw the first glimpses of the Higgs Boson. As the team showed today, we will keep increasing until we reach a level of statistical significance which is considered to be sufficient for discovery in our field.”

Landsberg said that within this small range, there is not much room for the Higgs to hide. “This is very exciting, and it tells you that we are almost there. We have enough sensitivity and beautiful detectors; we need just a little bit more time and a little more data. I am very hopeful we should be able to say something definitive by sometime next year.”

So the suspense is building and 2012 could be the year of the Higgs.

More info: CERN press release, ArsTechnica

Mapping The Milky Way’s Magnetic Fields – The Faraday Sky

Fig. 3: In this map of the sky, a correction for the effect of the galactic disk has been made in order to emphasize weaker magnetic field structures. The magnetic field directions above and below the disk seem to be diametrically opposed, as indicated by the positive (red) and negative (blue) values. An analogous change of direction takes place accross the vertical center line, which runs through the center of the Milky Way.

[/caption]

Kudos to the scientists at the Max Planck Institut and an international team of radio astronomers for an incredibly detailed new map of our galaxy’s magnetic fields! This unique all-sky map has surpassed its predecessors and is giving us insight into the magnetic field structure of the Milky Way beyond anything so far seen. What’s so special about this one? It’s showing us a quality known as Faraday depth – a concept which works along a specific line of sight. To construct the map, data was melded from 41,000 measurements collected from a new image reconstruction technique. We can now see not only the major structure of galactic fields, but less obvious features like turbulence in galactic gas.

So, exactly what does a new map of this kind mean? All galaxies possess magnetic fields, but their source is a mystery. As of now, we can only guess they occur due to dynamo processes… where mechanical energy is transformed into magnetic energy. This type of creation is perfectly normal and happens here on Earth, the Sun, and even on a smaller scale like a hand-crank powered radio – or a Faraday flashlight! By showing us where magnetic field structures occur in the Milky Way, we can get a better understanding of galactic dynamos.

Fig. 1: The sky map of the Faraday effect caused by the magnetic fields of the Milky Way. Red and blue colors indicate regions of the sky where the magnetic field points toward and away from the observer, respectively. The band of the Milky Way (the plane of the galactic disk) extends horizontally in this panoramic view. The center of the Milky Way lies in the middle of the image. The North celestial pole is at the top left and the South Pole is at the bottom right.
For the last century and a half, we’ve known about Faraday rotation and scientists use it to measure cosmic magnetic fields. This action happens when polarized light goes through a magnetized medium and the plane of polarization revolves. The amount of turn is dependent on the strength and direction of the magnetic field. By observation of the rotation we can further understand the properties of the intervening magnetic fields. Radio astronomers gather and examine the polarized light from distant radio sources passing through our galaxy on its way to us. The Faraday effect can then be judged by measuring the source polarization at various frequencies. However, these measurements can only tell us about the one path through the Milky Way. To see things as a whole, one needs to know how many sources are scattered over the visible sky. This is where the international group of radio astronomers played an important role. They proved data from 26 different projects which gave a grand total of 41,300 pinpoint sources – at an average of about one radio source per square degree of sky.

Although that sounds like a wealth of information, it’s still not really enough. There are huge areas, particularly in the southern sky, where only a few measurements exist. Because of this lack of data, we have to interpolate between existing data points and that creates its own problems. First, the accuracy varies and more precise measurements should help. Also, astronomers are not exactly sure of how reliable a single measurement can be – they just have to take their best guess based on what information they have. Still, other problems exist. There are measurement uncertainties due to the complex nature of the process. A small error can increase by tenfold and this could convolute the map if not corrected. To help fix these problems, scientists at MPA developed a new algorithm for image capture, named the “extended critical filter”. In its creation, the team utilizes tools provided by the new discipline known as information field theory – a powerful tool that blends logical and statistical methods to applied fields and stacks it up against inaccurate information. This new work is exciting because it can also be applied to other imaging and signal-processing venues in alternate scientific fields.

Fig. 2: The uncertainty in the Faraday map. Note that the range of values is significantly smaller than in the Faraday map (Fig. 1). In the area of the celestial south pole, the measurement uncertainties are particularly high because of the low density of data points.
“In addition to the detailed Faraday depth map (Fig. 1), the algorithm provides a map of the uncertainties (Fig. 2). Especially in the galactic disk and in the less well-observed region around the south celestial pole (bottom right quadrant), the uncertainties are significantly larger.” says the team. “To better emphasize the structures in the galactic magnetic field, in Figure 3 (above) the effect of the galactic disk has been removed so that weaker features above and below the galactic disk are more visible. This reveals not only the conspicuous horizontal band of the gas disk of our Milky Way in the middle of the picture, but also that the magnetic field directions seem to be opposite above and below the disk. An analogous change of direction also takes place between the left and right sides of the image, from one side of the center of the Milky Way to the other.”

The good news is the galactic dynamo theory seems to be spot on. It has predicted symmetrical structures and the new map reflects it. In this projection, the magnetic fields are lined up parallel to the plane of the galactic disc in a spiral. This direction is opposite above and below the disc and the observed symmetries in the Faraday map arise from our location within the galactic disc. Here we see both large and small structures tied in with the turbulent, dynamic Milky Way gas structures. This new map algorithm has a great side-line, too… it characterizes the size distribution of these structures. Larger ones are more definitive than smaller ones, which is normal for turbulent systems. This spectrum can then be stacked against computer models of dynamics – allowing for intricate testing of the galactic dynamo models.

This incredible new map is more than just another pretty face in astronomy. By providing information of extragalactic magnetic fields, we’re enabling radio telescope projects such as LOFAR, eVLA, ASKAP, Meerkat and the SKA to rise to new heights. With this will come even more updates to the Faraday Sky and reveal the mystery of the origin of galactic magnetic fields.

Original Story Source: Max Planck Institut for Astrophysics News Release. For Further Reading: An improved map of the galactic Faraday sky”. Download the map HERE.

Are Pulsars Giant Permanent Magnets?

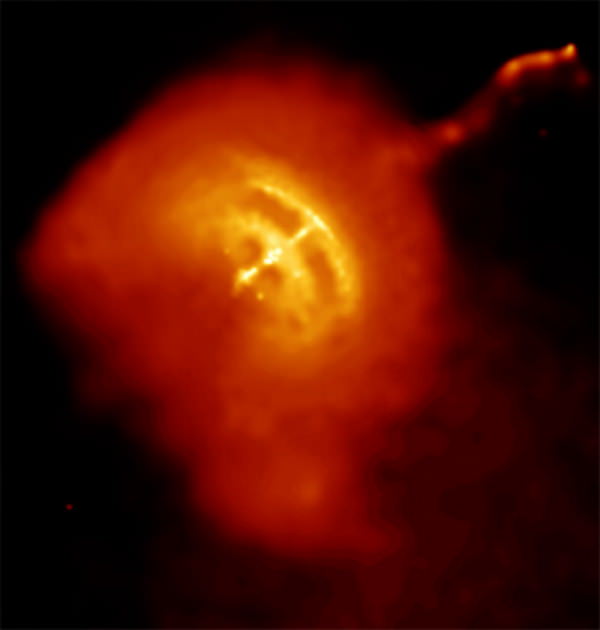
The Vela Pulsar, a neutron star corpse left from a titanic stellar supernova explosion, shoots through space powered by a jet emitted from one of the neutron star's rotational poles. Now a counter jet in front of the neutron star has been imaged by the Chandra X-ray observatory. The Chandra image above shows the Vela Pulsar as a bright white spot in the middle of the picture, surrounded by hot gas shown in yellow and orange. The counter jet can be seen wiggling from the hot gas in the upper right. Chandra has been studying this jet so long that it's been able to create a movie of the jet's motion. The jet moves through space like a firehose, wiggling to the left and right and up and down, but staying collimated: the "hose" around the stream is, in this case, composed of a tightly bound magnetic field. Image Credit:

[/caption]
Some of the most bizarre phenomena in the universe are neutron stars. Very few things in our universe can rival the density in these remnants of supernova explosions. Neutron stars emit intense radiation from their magnetic poles, and when a neutron star is aligned such that these “beams” of radiation point in Earth’s direction, we can detect the pulses, and refer to said neutron star as a pulsar.

What has been a mystery so far, is how exactly the magnetic fields of pulsars form and behave. Researchers had believed that the magnetic fields form from the rotation of charged particles, and as such should align with the rotational axis of the neutron star. Based on observational data, researchers know this is not the case.

Seeking to unravel this mystery, Johan Hansson and Anna Ponga (Lulea University of Technology, Sweden) have written a paper which outlines a new theory on how the magnetic fields of neutron stars form. Hansson and Ponga theorize that not only can the movement of charged particles form a magnetic field, but also the alignment of the magnetic fields of components that make up the neutron star – similar to the process of forming ferromagnets.

Getting into the physics of Hansson and Ponga’s paper, they suggest that when a neutron star forms, neutron magnetic moments become aligned. The alignment is thought to occur due to it being the lowest energy configuration of the nuclear forces. Basically, once the alignment occurs, the magnetic field of a neutron star is locked in place. This phenomenon essentially makes a neutron star into a giant permanent magnet, something Hansson and Ponga call a “neutromagnet”.

Similar to its smaller permanent magnet cousins, a neutromagnet would be extremely stable. The magnetic field of a neutromagnet is thought to align with the original magnetic field of the “parent” star, which appears to act as a catalyst. What is even more interesting is that the original magnetic field isn’t required to be in the same direction as the spin axis.

One more interesting fact is that with all neutron stars having nearly the same mass, Hansson and Ponga can calculate the strength of the magnetic fields the neutromagnets should generate. Based on their calculations, the strength is about 1012 Tesla’s – almost exactly the observed value detected around the most intense magnetic fields around neutron stars. The team’s calculations appear to solve several unsolved problems regarding pulsars.

Hansson and Ponga’s theory is simple to test – since they state the magnetic field strength of neutron stars cannot exceed 1012 Tesla’s. If a neutron star were to be discovered with a stronger magnetic field than 1012 Tesla’s, the team’s theory would be proven wrong.

Due to the Pauli exclusion principle possibly excluding neutrons aligning in the manner outlined in Hansson and Ponga’s paper, there are some questions regarding the team’s theory. Hansson and Ponga point to experiments that have been performed which suggest that nuclear spins can become ordered, like ferromagnets, stating: “One should remember that the nuclear physics at these extreme circumstances and densities is not known a priori, so several unexpected properties might apply,”

While Hansson and Ponga readily agree their theories are purely speculative, they feel their theory is worth pursuing in more detail.

If you’d like to learn more, you can read the full scientific paper by Hansson & Pong at: http://arxiv.org/pdf/1111.3434v1

Source: Pulsars: Cosmic Permanent ‘Neutromagnets’ (Hansson & Pong)

Astronomy Without A Telescope – Mass Is Energy

The USS Enterprise in 1964 (pre Zephram Cochran era), which sailed around the world in 64 days without refuelling to demonstrate the capability of nuclear-powered surface ships. Credit: US Navy.

[/caption]

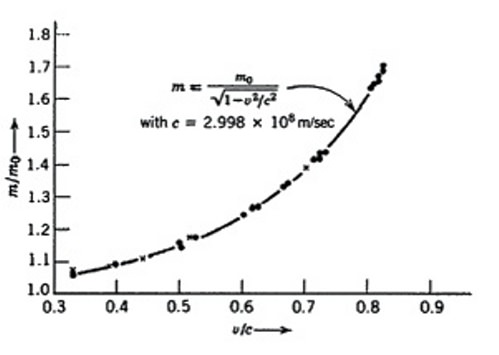
Some say that the reason you can’t travel faster than light is that your mass will increase as your speed approaches light speed – so, regardless of how much energy your star drive can generate, you reach a point where no amount of energy can further accelerate your spacecraft because its mass is approaching infinite.

This line of thinking is at best an incomplete description of what’s really going on and is not a particularly effective way of explaining why you can’t move faster than light (even though you really can’t). However, the story does offer useful insight into why mass is equivalent to energy, in accordance with the relationship e=mc2.

Firstly, here’s why the story isn’t complete. Although someone back on Earth might see your spacecraft’s mass increase as you move near light speed – you the pilot aren’t going notice your mass change at all. Within your spacecraft, you would still be able to climb stairs, jump rope – and if you had a set of bathroom scales along for the ride you would still weigh just the same as you did back on Earth (assuming your ship is equipped with the latest in artificial gravity technology that mimics conditions back on Earth’s surface).

The change perceived by an Earth observer is just relativistic mass. If you hit the brakes and returned to a more conventional velocity, all the relativistic mass would go away and an Earth observer would just see you retaining with same proper (or rest) mass that the spacecraft and you had before you left Earth.

The Earth observer would be more correct to consider your situation in terms of momentum energy, which is a product of your mass and your speed. So as you pump more energy in to your star drive system, someone on Earth really sees your momentum increase – but interprets it as a mass increase, since your speed doesn’t seem to increase much at all once it is up around 99% of the speed of light. Then when you slow down again, although you might seem to be losing mass you are really offloading energy – perhaps by converting your kinetic energy of motion into heat (assuming your spacecraft is equipped with the latest in relativistic braking technology).

As the ratio of your velocity to light speed approaches 1, the ratio of your relativistic mass to your rest mass grows asymptotically - i.e. it approaches infinite.

From the perspective of the Earth-based observer, you can formulate that the relativistic mass gain observed when travelling near light speed is the sum of the spacecraft’s rest mass/energy plus the kinetic energy of its motion – all divided by c2. From that you can (stepping around some moderately complex math) derive that e=mc2. This is a useful finding, but it has little to do with why the spacecraft’s speed cannot exceed light speed.

The phenomenon of relativistic mass follows a similar, though inverse, asymptotic relationship to your speed. So as you approach light speed, your relativistic time approaches zero (clocks slow), your relativistic spatial dimensions approach zero (lengths contract) – but your relativistic mass grows towards infinite.

But as we’ve covered already, on the spacecraft you do not experience your spacecraft gaining mass (nor does it seem to shrink, nor its clocks slow down). So you must interpret your increase in momentum energy as a genuine speed increase – at least with respect to a new understanding you have developed about speed.

For you, the pilot, when you approach light speed and keep pumping more energy into your drive system, what you find is that you keep reaching your destination faster – not so much because you are moving faster, but because the time you estimated it would take you to cross the distance from point A to Point B becomes perceivably much less, indeed the distance between point A to Point B also becomes perceivably much less. So you never break light speed because the distance over time parameters of your speed keep changing in a way that ensures that you can’t.

In any case, consideration of relativistic mass is probably the best way to derive the relationship e=mc2 since the relativistic mass is a direct result of the kinetic energy of motion. The relationship does not easily fall out of consideration of (say) a nuclear explosion – since much of the energy of the blast derives from the release of the binding energy which holds a heavy atom together. A nuclear blast is more about energy transformation than about matter converting to energy, although at a system level it still represents genuine mass to energy conversion.

Similarly you might consider that your cup of coffee is more massive when it’s hot – and gets measurably less massive when it cools down. Matter, in terms of protons, neutrons, electrons …and coffee, is largely conserved throughout this process. But, for a while, the heat energy really does add to the mass of the system – although since it’s a mass of m=e/c2, it is a very tiny amount of mass.

Neutrinos Still Breaking Speed Limits

Particle Collider
Today, CERN announced that the LHCb experiment had revealed the existence of two new baryon subatomic particles. Credit: CERN/LHC/GridPP

[/caption]

New test results are in from OPERA and it seems those darn neutrinos, they just can’t keep their speed down… to within the speed of light, that is!

report released in September by scientists working on the OPERA project (Oscillation Project with Emulsion-tracking Apparatus) at Italy’s Gran Sasso research lab claimed that neutrinos emitted from CERN 500 miles away in Geneva arrived at their detectors 60 nanoseconds earlier than expected, thus traveling faster than light. This caused no small amount of contention in the scientific community and made news headlines worldwide – and rightfully so, as it basically slaps one of the main tenets of modern physics across the face.

Of course the scientists at OPERA were well aware of this, and didn’t make such a proclamation lightly; over two years of repeated research was undergone to make sure that the numbers were accurate… as well as could be determined, at least. And they were more than open to having their tests replicated and the results reviewed by their peers. In all regards their methods were scientific yet skepticism was widespread… even within OPERA’s own ranks.

One of the concerns that arose regarding the discovery was in regards to the length of the neutrino beam itself, emitted from CERN and received by special detector plates at Gran Sasso. Researchers couldn’t say for sure that any neutrinos detected were closer to the beginning of the beam versus the end, a disparity (on a neutrino-sized scale anyway) of 10.5 microseconds… that’s 10.5 millionths of a second! And so in October, OPERA requested that proton pulses be resent – this time lasting only 3 nanoseconds each.

The OPERA Neutrino Detector

The results were the same. The neutrinos arrived at Gran Sasso 60 nanoseconds earlier than anticipated: faster than light.

The test was repeated – by different teams, no less – and so far 20 such events have been recorded. Each time, the same.

Faster. Than light.

What does this mean? Do we start tearing pages out of physics textbooks? Should we draw up plans for those neutrino-powered warp engines? Does Einstein’s theory of relativity become a quaint memento of what we used to believe?

Hardly. Or, at least, not anytime soon.

OPERA’s latest tests have managed to allay one uncertainty regarding the results, but plenty more remain. One in particular is the use of GPS to align the clocks at the beginning and end of the neutrino beam. Since the same clock alignment system was used in all the experiments, it stands that there may be some as-of-yet unknown factor concerning the GPS – especially since it hasn’t been extensively used in the field of high-energy particle physics.

In addition, some scientists would like to see more results using other parts of the neutrino detector array.

Of course, like any good science, replication of results is a key factor for peer acceptance. And thus Fermilab in Batavia, Illinois will attempt to perform the same experiment with its MINOS (Main Injector Neutrino Oscillation Search) facility, using a precision matching OPERA’s.

MINOS hopes to have its independent results as early as next year.

No tearing up any textbooks just yet…


Read more in the Nature.com news article by Eugenie Samuel Reich. The new result was released on the arXiv preprint server on November 17. (The original September 2011 OPERA team paper can be found here.)

Unifying The Quantum Principle – Flowing Along In Four Dimensions

PASIEKA/SPL

[/caption]

In 1988, John Cardy asked if there was a c-theorem in four dimensions. At the time, he reasonably expected his work on theories of quantum particles and fields to be professionally put to the test… But it never happened. Now – a quarter of a century later – it seems he was right.

“It is shown that, for d even, the one-point function of the trace of the stress tensor on the sphere, Sd, when suitably regularized, defines a c-function, which, at least to one loop order, is decreasing along RG trajectories and is stationary at RG fixed points, where it is proportional to the usual conformal anomaly.” said Cardy. “It is shown that the existence of such a c-function, if it satisfies these properties to all orders, is consistent with the expected behavior of QCD in four dimensions.”

His speculation is the a-theorem… a multitude of avenues in which quantum fields can be energetically excited (a) is always greater at high energies than at low energies. If this theory is correct, then it likely will explain physics beyond the current model and shed light on any possible unknown particles yet to be revealed by the Large Hadron Collider (LHC) at CERN, Europe’s particle physics lab near Geneva, Switzerland.

“I’m pleased if the proof turns out to be correct,” says Cardy, a theoretical physicist at the University of Oxford, UK. “I’m quite amazed the conjecture I made in 1988 stood up.”

According to theorists Zohar Komargodski and Adam Schwimmer of the Weizmann Institute of Science in Rehovot, Israel, the proof of Cardy’s theories was presented July 2011, and is slowly gaining notoriety among the scientific community as other theoretical physicists take note of his work.

“I think it’s quite likely to be right,” says Nathan Seiberg, a theoretical physicist at the Institute of Advanced Study in Princeton, New Jersey.

The field of quantum theory always stands on shaky ground… it seems that no one can be 100% accurate on their guesses of how particles should behave. According to the Nature news release, one example is quantum chromodynamics — the theory of the strong nuclear force that describes the interactions between quarks and gluons. That lack leaves physicists struggling to relate physics at the high-energy, short-distance scale of quarks to the physics at longer-distance, lower-energy scales, such as that of protons and neutrons.

“Although lots of work has gone into relating short- and long-distance scales for particular quantum field theories, there are relatively few general principles that do this for all theories that can exist,” says Robert Myers, a theoretical physicist at the Perimeter Institute in Waterloo, Canada.

However, Cardy’s a-theorem just might be the answer – in four dimensions – the three dimensions of space and the dimension of time. However, in 2008, two physicists found a counter-example of a quantum field theory that didn’t obey the rule. But don’t stop there. Two years later Seiberg and his colleagues re-evaluated the counter-example and discovered errors. These findings led to more studies of Cardy’s work and allowed Schwimmer and Komargodski to state their conjecture. Again, it’s not perfect and some areas need further clarification. But Myers thinks that the proof is correct. “If this is a complete proof then this becomes a very powerful principle,” he says. “If it isn’t, it’s still a general idea that holds most of the time.”

According to Nature, Ken Intriligator, a theoretical physicist at the University of California, San Diego, agrees, adding that whereas mathematicians require proofs to be watertight, physicists tend to be satisfied by proofs that seem mostly right, and intrigued by any avenues to be pursued in more depth. Writing on his blog on November 9, Matt Strassler, a theoretical physicist at Rutgers University in New Brunswick, New Jersey, described the proof as “striking” because the whole argument follows once one elegant technical idea has been established.

With Cardy’s theory more thoroughly tested, chances are it will be applied more universally in the areas of quantum field theories. This may unify physics, including the area of supersymmetry and aid the findings with the LHC. The a-theorem “will be a guiding tool for theorists trying to understand the physics”, predicts Myers.

Pehaps Cardy’s work will even expand into condensed matter physics, an area where quantum field theories are used to elucidate on new states of materials. The only problem is the a-theorem has only had proof in two and four dimensions – where a few areas of condensed matter physics embrace layers containing just three dimensions – two in space and one in time. However, Myers states that they’ll continue to work on a version of the theorem in odd numbers of dimensions. “I’m just hoping it won’t take another 20 years,” he says.

Original Story Source: Nature News Release. For Further Reading: On Renormalization Group Flows in Four Dimensions.

Was a Fifth Giant Planet Expelled from Our Solar System?

Artist’s impression of a fifth giant planet being ejected from the solar system. Image credit: Southwest Research Institute

[/caption]

Earth’s place in the “Goldilocks” zone of our solar system may be the result of the expulsion of a fifth giant planet from our solar system during its first 600 million years, according to a recent journal publication.

“We have all sorts of clues about the early evolution of the solar system,” said author Dr. David Nesvorny of the Southwest Research Institute. “They come from the analysis of the trans-Neptunian population of small bodies known as the Kuiper Belt, and from the lunar cratering record.”

Nesvorny and his team used the clues they had to build computer simulations of the early solar system and test their theories. What resulted was an early solar system model that has quite a different configuration than today, and a jumbling of planets that may have given Earth the “preferred” spot for life to evolve.


Researchers interpret the clues as evidence that the orbits of Jupiter, Saturn, Uranus and Neptune were affected by a dynamical instability when our solar system was only about half a billion years old. This instability is believed to have helped increase the distance between the giant planets, along with scattering smaller bodies. The scattering of small bodies pushed objects both inward, and outward with some objects ending up in the Kuiper Belt and others impacting the terrestrial planets and the Moon. Jupiter is believed to have scattered objects outward as it moved in towards the sun.

One problem with this interpretation is that slow changes to Jupiter’s orbit would most likely add too much momentum to the orbits of the terrestrial planets. The additional momentum would have possibly caused a collision of Earth with Venus or Mars.

“Colleagues suggested a clever way around this problem,” said Nesvorny. “They proposed that Jupiter’s orbit quickly changed when Jupiter scattered off of Uranus or Neptune during the dynamical instability in the outer solar system.”

Basically if Jupiter’s early migration “jumps,” the orbital coupling between the terrestrial planets and Jupiter is weaker, and less harmful to the inner solar system.

Animation showing the evolution of the planetary system from 20 million years before the ejection to 30 million years after. Five initial planets are shown by red circles, small bodies are in green.
After the fifth planet is ejected, the remaining four planets stabilize after a while, and looks like the outer solar system in the end, with giant planets at 5, 10, 20 and 30 astronomical units.
Click image to view animation. Image Credit: Southwest Research Institute

Nesvorny and his team performed thousands of computer simulations that attempted to model the early solar system in an effort to test the “jumping-Jupiter” theory. Nesvorny found that Jupiter did in fact jump due to gravitational interactions from Uranus or Neptune, but when Jupiter jumped, either Uranus or Neptune were expelled from the solar system. “Something was clearly wrong,” he said.

Based on his early results, Nesvorny added a fifth giant planet, similar to Uranus or Neptune to his simulations. Once he ran the reconfigured simulations, everything fell into place. The simulation showed the fifth planet ejected from the solar system by Jupiter, with four giant planets remaining, and the inner, terrestrial planets untouched.

Nesvorny concluded with, “The possibility that the solar system had more than four giant planets initially, and ejected some, appears to be conceivable in view of the recent discovery of a large number of free-floating planets in interstellar space, indicating the planet ejection process could be a common occurrence.”

If you’d like to read Nesvorny’s full paper, you can access it at: http://arxiv.org/pdf/1109.2949v1

Source: Southwest Research Institute Press Release

Honoring Copernicus – Three New Elements Added To The Periodic Table

Periodic Table of the Elements (Credit: NASA)

[/caption]

Today, November 4, 2011, the General Assembly of the International Union of Pure and Applied Physics (IUPAP) is meeting at the Institute of Physics in London, to approve the names of three new elements… one of which will honor the great Copernicus. Their names are: Element 110, darmstadtium (Ds), Element111, roentgenium (Rg) and Element 112. copernicium (Cn).

Are these new elements? Probably not. All the new ones were discovered long ago, but groups like IUPAC elect names to be used in scientific endeavors. Not only does this include the element, but new molecules which belong to it. As a general rule, these “new elements” are given names by their discoverer – which also leads to international debate. The elements can be named after a mythological concept, a mineral, a place or a country, a property or a very known scientist… even an astronomer!

As for element 112, this extremely radioactive synthetic element can only be created in a laboratory. Copernicium was created on February 9, 1996 by the Gesellschaft für Schwerionenforschung, but its original name – ununbium – didn’t get changed until almost two years ago when a German team of scientists provided enough information to prove its existence. When it was time to give it a moniker, the rules were that it had to end in “ium” and it couldn’t be named for a living person. On February 19, 2010, the 537th anniversary of Copernicus’ birth, IUPAC officially accepted the proposed name and symbol.

This “name calling” process comes from the Joint Working Party on the Discovery of Elements, which is a joint body of IUPAP and the International Union of Pure and Applied Chemistry (IUPAC). From there it is given to the General Assembly for approval. Dr. Robert Kirby-Harris, Chief Executive at IOP and Secretary-General of IUPAP, said, “The naming of these elements has been agreed in consultation with physicists around the world and we’re delighted to see them now being introduced to the Periodic Table.”

The General Assembly consists of 60 members from different countries. These delegates are elected from national academies and physical societies around the world. The five day meeting, which started session on Monday, October 31 will end today. The meeting included presentations from leading UK physicists, and the inauguration of IUPAP’s first female President, Professor Cecilia Jarlskog from the Division of Mathematical Physics at Lund University in Sweden.

Original Story Source: Institute of Physics News Release.