A Jodrell Odyssey – Part 2 – The Observatory

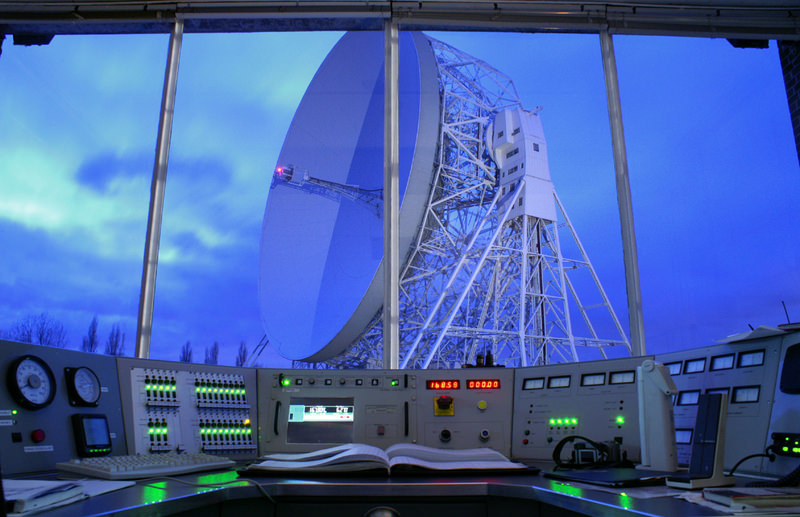
Caption: The original Jodrell Bank Control Desk with view of the Lovell telescope. Credit: Anthony Holloway.

Last week we took a look at the public face of the Jodrell Bank Observatory, the Discovery Centre. But this week we get a behind-the-scenes tour of the heart of this impressive and historic observatory.

Dr. Tim O’Brien is Associate Director of the Jodrell Bank Observatory and a Reader in Astrophysics in the School of Physics & Astronomy at the University of Manchester. As we begin our tour of the telescopes, control room and computers he explains the role of Jodrell in the historical development of radio astronomy. The Lovell telescope at the heart of the observatory, is today a Grade 1 listed building as well as being at the cutting edge of current, and indeed future, scientific research.

Jodrell Bank was originally the site of the university Botany Department’s testing ground. The Observatory was founded by Sir Bernard Lovell when interference from trams disrupted the research into cosmic rays that he was carrying out in the School of Physics at the University’s main campus in the city. Sir Bernard moved his radar equipment to the site in 1945 to try to find radio echoes from the ionized trails of cosmic rays but instead founded a whole new area of research into meteors.

The Lovell telescope (originally the Mark I) was the largest steerable radio telescope in the world (76.2m in diameter) and the only one able to track the launch rocket of Sputnik 1 in 1957; it is still the third largest in the world. Apart from tracking and receiving data from such probes as Pioneer 5 in 1960 and Luna 9 in 1966, a continual programme of upgrades enabled the scope to measure distances to the Moon and Venus and research pulsars, astrophysical masers, quasars and gravitational lenses. It has provided the most extensive studies of pulsars in binary star systems and discovered the first pulsar in a globular cluster. It detected the first gravitational lens and has also been used for SETI observations. Now on its third reflecting surface, a continual programme of upgrades has made it more powerful than ever.

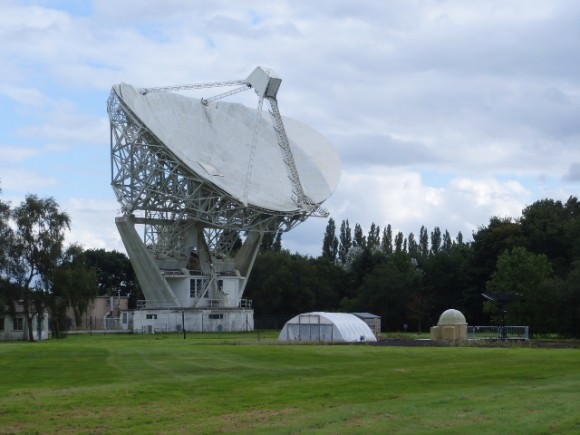
In 1964 the Mark II elliptical radio telescope was completed. It stands in the middle of a field, dwarfing the small observing dome that house Tim’s optical teaching telescope and surrounded by post war huts named after the research that was done in them, so one is called Radiant (after meteors) and another Moon. With a major axis of 38.1m and minor axis of 25.4m the Mark II is mainly used alongside the Lovell as part of e-MERLIN (Multi Element Radio Linked Interferometer Network), the UK’s national radio astronomy facility run from Jodrell. This comprises up to 7 radio scopes: the Lovell, Mark II, Cambridge, Defford, Knockin, Darnhall and Pickmere. e-MERLIN has the longest baseline (separation of telescopes) of 217 Km and a resolution of better than 50 milliarcseconds, which compares with the Hubble Space Telescope but at radio rather than visible wavelengths. The Manchester branch of Jodrell also hosts the UK Regional Centre Node for ALMA (the Atacama Large Millimetre/sub-millimetre Array) in Chile.

The “42ft “ telescope stands by the entrance to the main building that houses the control room. The telescopes main task is to continually monitor the Pulsar at the heart of the Crab Nebula (all the time it is above the horizon). Tim at this point showed off his impressive party trick of mathematically demonstrating that the scope was indeed pointing at the Crab Pulsar by calculating from the pulsar’s Right Ascension ( 05h 34m 31.97s ) and Declination (+22d 00m 52.1s) where it would be in the sky at the time. It has collected over 30 years of data which represents 4% of the pulsar’s age, giving vital clues about how pulsars evolve.

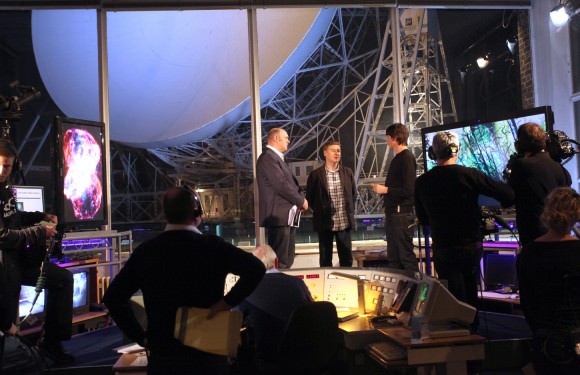
Caption: Dr Tim O’Brien talking to Prof. Brian Cox and Dara O’Biain in the Control Room during Stargazing Live Credit: The University of Manchester

Tim was kind enough to allow me inside the Control Room, not often seen by general visitors to the site, though it plays host to BBC TV’s annual Stargazing Live series, hosted by Prof. Brian Cox and Dara O’Briain. It perfectly illustrates Jodrell historical and current role in radio astronomy. It is a wonderfully British mix of state of the art computer technology, original 1950’s equipment and all points between. There are massive flat screen monitors in one corner that display & can control each of the scopes, an atomic clock alongside wood and glass cabinets housing twitching needles that trace out air pressure, wind speed and temperature variations on rolls or discs of paper. In the centre of the room is the original horseshoe shaped control desk from the 1950s.

The vast window overlooks the Lovell scope which was ‘parked’ during my visit whilst the reflecting bowl was being given a new coat of paint, pointing straight up to the zenith with the brakes applied. If the winds increase during an observation the dish has to be raised and moved to a target higher in the sky. If the winds reach 45 miles per hour the dish has to be parked in this upright position. Luckily this doesn’t happen too often. A heavy accumulation of snow could distort the shape of the dish so it has to be tipped out. The control room is manned 24 hours a day 365 days of the year. The whole room has a very satisfying amount of blinking lights, dials, knobs and switches. As Tim rightly says “You need plenty of flashing lights.”

Jodrell houses a number of general-purpose and specialised computing clusters. Since the 1960s the Lovell and Mark II have been regularly involved with VLBI (Very Long Baseline Interferometry) which includes telescopes across Europe, China and Africa and can also be linked to the VLBA (Very Long Baseline Array) in America to create a telescope the size of the planet, able to produce the sharpest images in all astronomy. The VLBI room houses a huge array of receiver and recording equipment. This includes a GPS receiver, accurate to 0.5 millisec, affectionately known as the Totally Accurate Clock, though they have newer ones with 25 nanosecond accuracy and their maser atomic clock is accurate to 1 part in 10^15 or 1 second every 30 million years! Names are quite the thing at Jodrell, five signal generators, used to convert frequencies in the receiver are neatly labelled Sharon, Tracy, Nigel, Kevin and Darren.

Caption: The Mark II telescope at Jodrell Bank. Credit: The Author

Jodrell pioneered the connection of radio telescopes across hundreds of kilometres and constructed the dedicated optical fibre network that connects all seven e-MERLIN telescopes. Tim paused for effect in front of an impressively large and heavy-duty blue door that was adorned with numerous dramatic warning signs and hummed ominously, with his hand on a sturdy operating lever. This was the home of the e-MERLIN correlator, the focus of all seven telescopes and the heart of the network, it has to be carefully shielded so it doesn’t interfere with the radio scopes on site. Tim tapped in the entry code, pulled the lever and the gentle hum became a deafening roar as we entered a metal room, kept cold with air-conditioning. There are massive cylinders of gas in the corner ready to fill the room in case of fire. In the centre is a smoked glass cabinet, the size of a large wardrobe containing the computer hub with festoons of yellow optic fibre cables linked to the telescopes and bringing as much data into the room as travels on the rest of the UK internet combined.

Jodrell has about 40 staff on the site with over 100 more working from the University’s Alan Turing Building in Manchester. The group’s list of research programmes covers all aspects of astronomy, from studying the Big Bang to discovering exoplanets. They have used pulsars to test Einstein’s theory of gravity for which they were awarded the EC Descartes Research Prize. They developed low-noise amplifiers for ESA’s Planck spacecraft which will report its cosmology results next year. With a European network of radio telescopes they are using pulsars to attempt the first detection of gravitational waves predicted by Einstein.

Looking to the future, work is now underway alongside the main Control Building on the construction of a new building to house the International Project Office for SKA (the Square Kilometre Array) to be sited in Africa and Australia, that when completed in around 2024, will be the World’s largest radio telescope for the 21st century. As we are leaving I ask Tim what would be on his wish list for the future (all astronomers have a wish list don’t they?) He would like to see a system like SKA extended to cover the Northern hemisphere and a future telescope which could make real-time, whole-sky observations, instantly targeting transient objects such as the novae that are the main focus of his own research. I think Sir Bernard would approve.

Find out more about the Jodrell Bank Centre for Astrophysics

Researchers Send Mars Some Radar Love

A radar map of Mars’ major volcanic regions created by the Arecibo Observatory in Puerto Rico (John Harmon et al., NAIC)

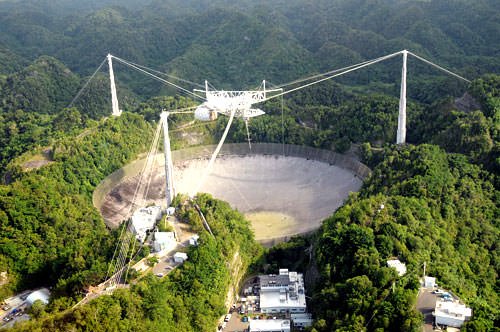
Even though we currently have several missions exploring Mars both from orbit and on the ground, there’s no reason that robots should be having all the fun; recently a team of radio astronomers aimed the enormous 305-meter dish at Puerto Rico’s Arecibo Observatory at Mars, creating radar maps of the Red Planet’s volcanic regions and capturing a surprising level of detail for Earth-based observations.

The team, led by John Harmon of the National Astronomy and Ionosphere Center, bounced radar waves off Mars from Arecibo’s incredibly-sensitive dish, targeting the volcanic Tharsis, Elysium, and Amazonis regions. Depolarized radar imagery best reveals surface textures; the rougher and less uniform a surface is, the brighter it appears to radar while smooth, flat surfaces appear dark.

What the radar maps portray are very bright — and therefore rough — areas on most of the major volcanoes, although some regions do appear dark, such as the summit of Pavonis Mons.

This likely indicates a covering by smoother, softer material, such as dust or soil. This is actually in line with previous observations of the summit of Pavonis Mons made with the HiRISE camera aboard NASA’s Mars Reconnaissance Orbiter, which showed the summit to appear curiously soft-edged and “out-of-focus”, creating a blurry optical illusion of sorts.

It’s thought that the effect is the result of the build-up of dust over millennia, carried across the planet by dust storms but remaining in place once settled because the Martian wind is just so extremely thin — especially at higher altitudes.

The team also found bright areas located away from the volcanoes, indicating rough flows elsewhere, while some smaller volcanoes appeared entirely dark — again, indicating a possible coating of smooth material like dust or solidified lava flows.

The resolution of the radar maps corresponds to the wavelength of the signals emitted from Arecibo; the 12.6 centimeter signal allows for surface resolution of Mars of about 3 km.

The team’s paper was published in the journal Icarus on July 25. Read more on the Red Planet Report here.

The iconic 305-meter radar telescope at Arecibo Observatory in Puerto Rico


Sir Bernard Lovell, 1913 to 2012

Caption: Sir Bernard Lovell. Credit: Jodrell Bank, University of Manchester

Sir Bernard Lovell OBE FRS, Emeritus Professor of Radio Astronomy, died yesterday, 6th August 2012 at the age of 98. He was the founder and first Director of The University of Manchester’s Jodrell Bank Observatory in Cheshire from 1945 to 1980.

Bernard Lovell was born in Gloucestershire on 31 August, 1913 and studied Physics at The University of Bristol, gaining his PhD in 1936. He then went to work at The University of Manchester researching cosmic rays. This work was interrupted during World War II when he worked in Telecommunications, leading the team that developed H2S radar for which he was awarded the OBE in 1946. He then returned to The University of Manchester. During his research he showed that radar echoes could be obtained from daytime meteor showers as they entered the Earth’s atmosphere and ionised the surrounding air.

He moved his research out to the university’s botany site at Jodrell Bank in late 1945 to avoid background interference from the Electric trams in Manchester. Here he worked with engineer Sir Charles Husband to construct the 76-metre Lovell Telescope, the largest steerable radio telescope in the world at the time, and still the third largest. The iconic telescope was completed in 1957 and within days it tracked the rocket that carried Sputnik 1 into orbit. Today the telescope is part of the e-MERLIN array of seven radio telescopes spread across the UK and European VLBI Network interferometric arrays of radio telescopes. Later this year the international headquarters of The Square Kilometre Array (SKA) the world’s largest telescope will move to Jodrell Bank.

Sir Bernard wrote many books about Jodrell Bank and astronomy, including ‘The Story of Jodrell Bank’ published in 1968. He was knighted for his contribution to the development of radio astronomy in 1961 and in 1981 was awarded the Gold Medal of the Royal Astronomical Society.

In 2009 Lovell claimed that during the cold war, when Jodrell Bank was being used as part of an early warning system for nuclear attacks, the Soviets allegedly tried to kill him with a lethal radiation dose. Lovell wrote a full account of the incident with instructions that it be published after his death.

Away from science he was also an accomplished musician, playing the church organ, a keen cricketer and a renowned arboriculturist. He is survived by four of his five children, fourteen grandchildren and fourteen great-grandchildren.

The University of Manchester paid tribute to him saying “Sir Bernard’s legacy is immense, extending from his wartime work to his pioneering contributions to radio astronomy and including his dedication to education and public engagement with scientific research. A great man, he will be sorely missed.”

A book of condolence has been opened at the observatory’s Discovery Centre and online.

Read more here

Is It Time to Return to the Moon?

Should we pay another visit to the Moon? (From "Le Voyage Dans La Lune" by Georges Méliès, 1902)

Humans haven’t set foot on the Moon — or any other world outside of our own, for that matter — since Cernan and Schmitt departed the lunar surface on December 14, 1972. That will make 40 years on that date this coming December. And despite dreams of moon bases and lunar colonies, there hasn’t even been a controlled landing there since the Soviet Luna 24 sample return mission in 1976 (not including impacted probes.) So in light of the challenges and costs of such an endeavor, is there any real value in a return to the Moon?

Some scientists are saying yes.

Researchers from the UK, Germany and The Netherlands have submitted a paper to the journal Planetary and Space Science outlining the scientific importance of future lunar surface missions. Led by Ian A. Crawford from London’s Birkbeck College, the paper especially focuses on the value of the Moon in the study of our own planet and its formation, the development of the Earth-Moon system as well as other rocky worlds  and even its potential contribution in life science and medicinal research.

Even though some research on the lunar surface may be able to be performed by robotic missions, Crawford et al. ultimately believe that “addressing them satisfactorily will require an end to the 40-year hiatus of lunar surface exploration.”

The team’s paper outlines many different areas of research that would benefit from future exploration, either manned or robotic. Surface composition, lunar volcanism, cratering history — and thus insight into a proposed period of “heavy bombardment” that seems to have affected the inner Solar System over 3.8 billion years ago — as well as the presence of water ice could be better investigated with manned missions, Crawford et al. suggest.

(Read: A New Look At Apollo Samples Supports Ancient Impact Theory)

In addition, the “crashed remains of unsterilized spacecraft” on the Moon warrant study, proposes Crawford’s team. No, we’re not talking about alien spaceships — unless the aliens are us! The suggestion is that the various machinery we’ve sent to the lunar surface since the advent of the Space Age may harbor Earthly microbes that could be returned for study after decades in a lunar environment. Such research could shed new light on how life can — or can’t — survive in a space environment, as well as how long such “contaminants” might linger on another world.

Crawford’s team also argues that only manned missions could offer all-important research on the long-term effects of low-gravity environments on human physiology, as well as how to best sustain exploration crews in space. If we are to ever become a society with the ability to explore and exist beyond our own planet, such knowledge is critical.

And outside of lunar exploration itself, the Moon offers a place from which to perform deeper study of the Universe. The lunar farside, shielded as it is from radio transmissions and other interference from Earth, would be a great place for radio astronomy — especially in the low-frequency range of 10-30 MHz, which is absorbed by Earth’s ionosphere and is thus relatively unavailable to ground-based telescopes. A radio observatory on the lunar farside would have a stable platform from which to observe some of the earliest times of the Universe, between the Big Bang and the formation of the first stars.

Of course, before anything can be built on the Moon or retrieved from its surface, serious plans must be made for such missions. Fortunately, says Crawford’s team, the 2007 Global Exploration Strategy — a framework for exploration created by 13 space agencies from around the world — puts the Moon as the “nearest and first goal” for future missions, as well as Mars and asteroids. Yet with subsequent budget cuts for NASA (a key player for many exploration missions) when and how that goal will be reached still remains to be seen.

See the team’s full paper on arXiv.org here, and check out a critical review on MIT’s Technology Review.

“…this long hiatus in lunar surface exploration has been to the detriment of lunar and planetary science, and indeed of other sciences also, and that the time has come to resume the robotic and human exploration of the surface of the Moon.”

— Ian A. Crawford,  Department of Earth and Planetary Sciences, Birkbeck College, UK

 Top image from “Le Voyage Dans La Lune” by Georges Méliès, 1902. Second image: First photo of the far side of the Moon, acquired by the Soviet Luna-3 spacecraft on Oct. 7, 1959.

Galactic Close Call Leaves a Bridge of Gas

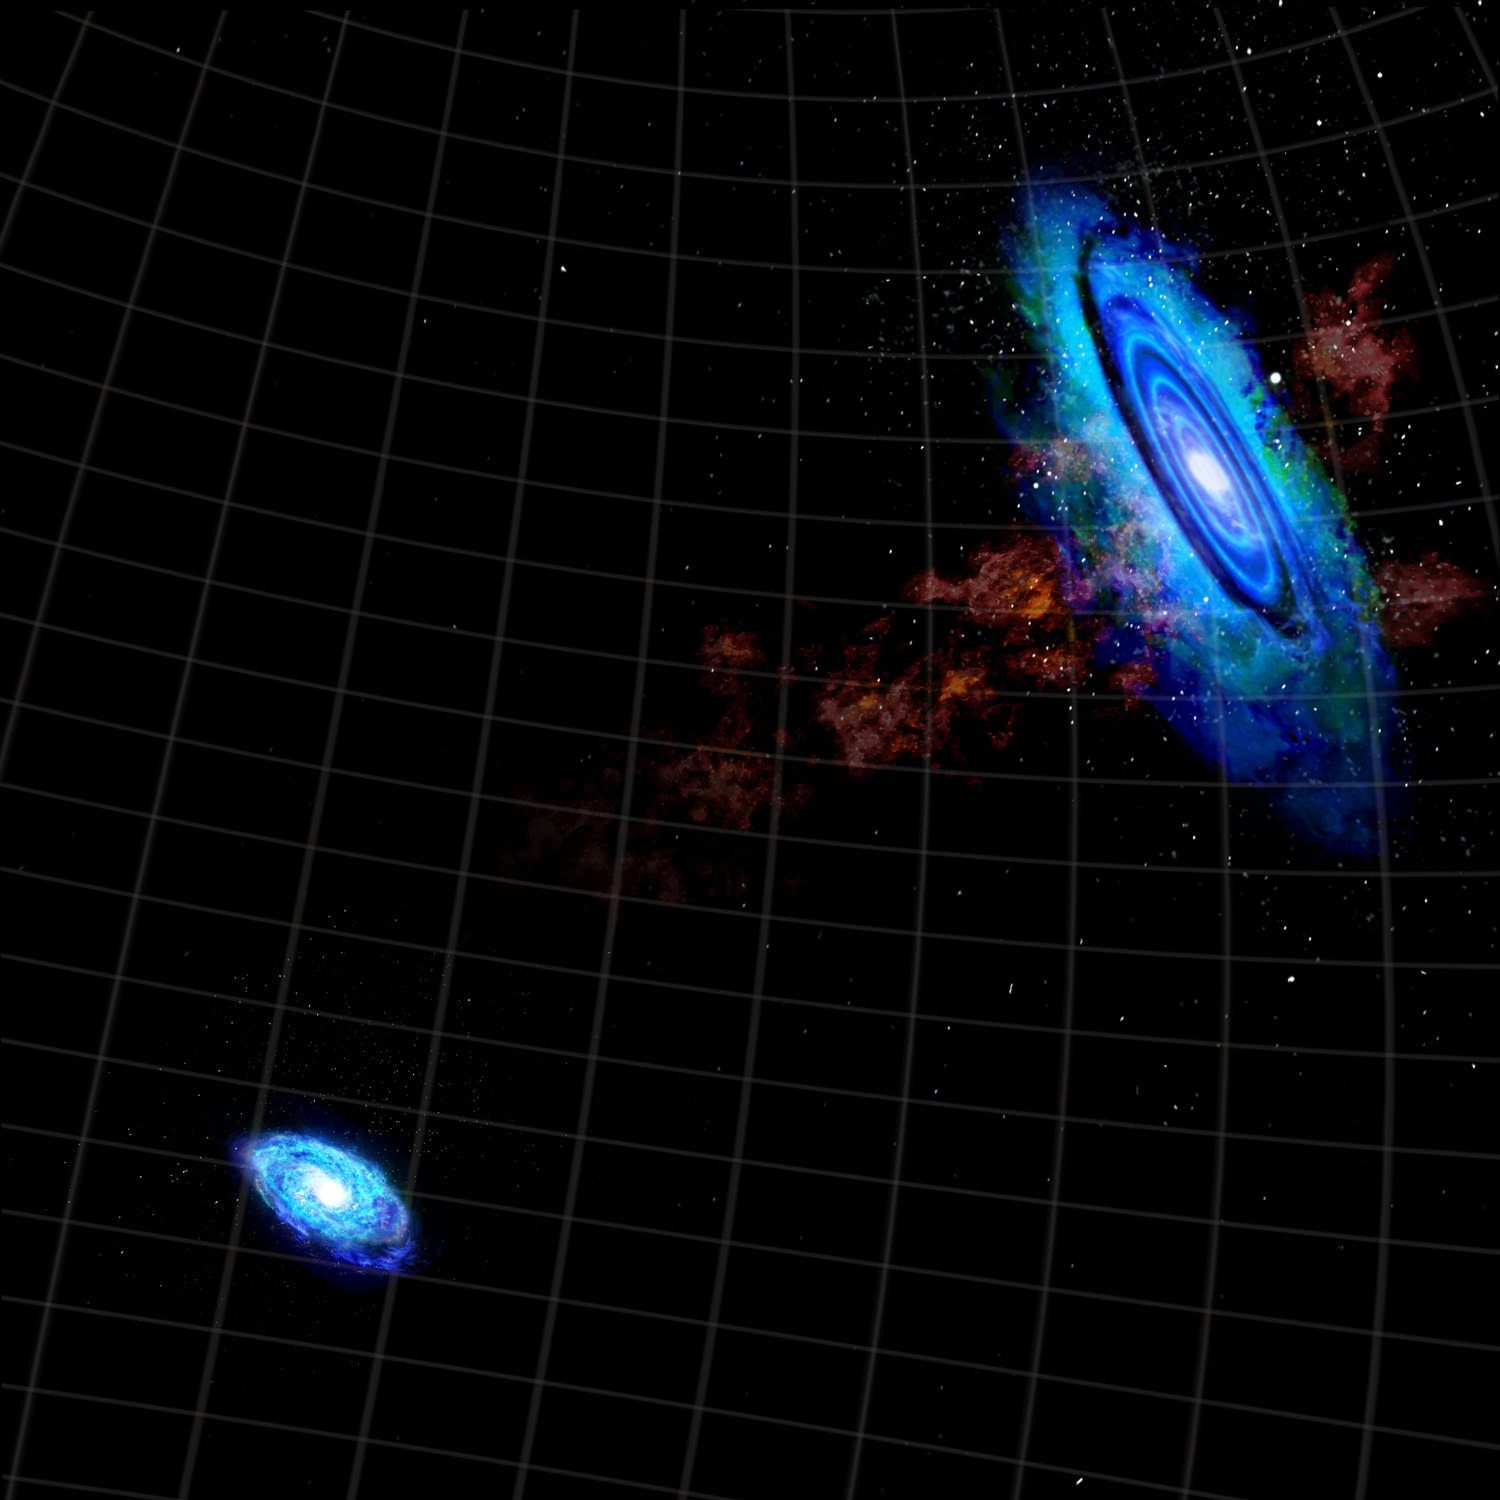
Illustration of a hydrogen gas bridge connecting the Andromeda and Triangulum galaxies (Bill Saxton, NRAO/AUI/NSF)

[/caption]

An ancient passing between two nearby galaxies appears to have left the participants connected by a tenuous “bridge” of hydrogen gas, according to findings reported Monday, June 11 by astronomers with the National Radio Astronomy Observatory (NRAO).

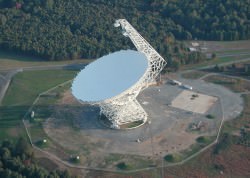
Using the National Science Foundation’s Green Bank Telescope in West Virginia — the world’s largest fully-steerable radio telescope — astronomers have confirmed the existence of a vast bridge of hydrogen gas streaming between the Andromeda galaxy (M31) and the Triangulum galaxy (M33), indicating that they likely passed very closely billions of years ago.

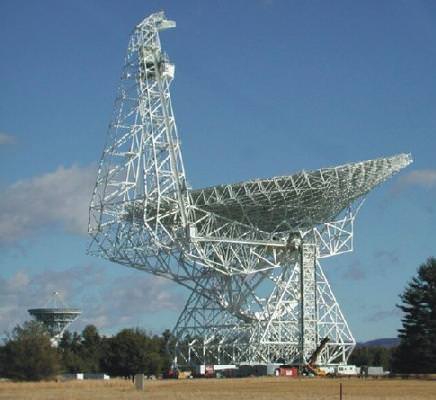
The Robert C. Byrd Green Bank Telescope (GBT) in West Virginia (NRAO/AUI)

The faint bridge structure had first been identified in 2004 with the 14-dish Westerbork Synthesis Radio Telescope in the Netherlands but there was some scientific dispute over the findings. Observations with the GBT confirmed the bridge’s existence as well as revealed the presence of six large clumps of material within the stream.

Since the clumps are moving at the same velocity as the two galaxies relative to us, it seems to indicate the bridge of hydrogen gas is connecting them together.

“We think it’s very likely that the hydrogen gas we see between M31 and M33 is the remnant of a tidal tail that originated during a close encounter, probably billions of years ago,” said Spencer Wolfe of West Virginia University. “The encounter had to be long ago, because neither galaxy shows evidence of disruption today.”

The findings were announced Monday at the 220th Meeting of the American Astronomical Society in Anchorage, Alaska. Read more on the NRAO website here.

Speca – An Intriguing Look Into The Beginning Of A Black Hole Jet

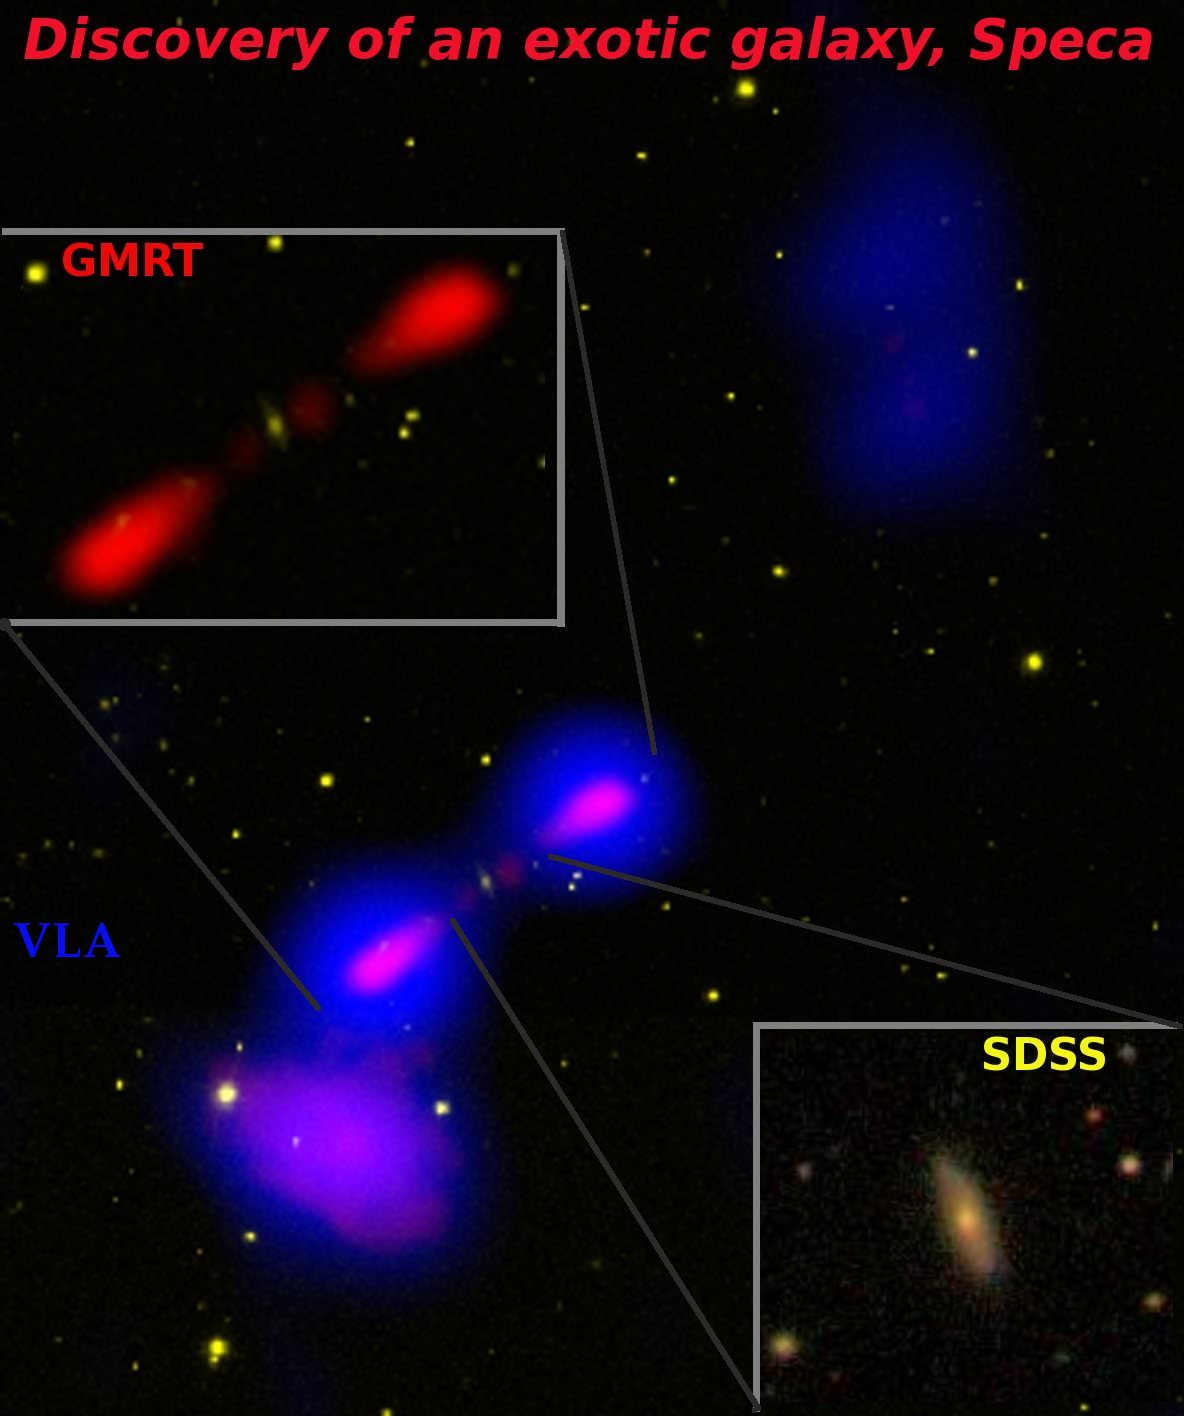
A unique galaxy, which holds clues to the evolution of galaxies billions of years ago, has now been discovered by an Indian-led international team of astronomers. The discovery, which will enable scientists to unearth new aspects about the formation of galaxies in the early universe, has been made using the Giant Meterwave Radio Telescope (GMRT) of the National Centre for Radio Astrophysics, Tata Institute of Fundamental Research (NCRA-TIFR). CREDIT: Hota et al., SDSS, NCRA-TIFR, NRAO/AUI/NSF.

[/caption]

Its name is SPECA – a Spiral-host Episodic radio galaxy tracing Cluster Accretion. That’s certainly a mouthful of words for this unusual galaxy, but there’s a lot more going on here than just its name. “This is probably the most exotic galaxy with a black hole, ever seen. It is like a ‘missing-link’ between present day and past galaxies. It has the potential to teach us new lessons about how galaxies and clusters of galaxies formed in the early Universe,” said Ananda Hota, of the Academia Sinica Institute of Astronomy and Astrophysics (ASIAA), in Taiwan and who discovered this exotic galaxy.

Located about 1.7 billion light-years from Earth, Speca is a radio source that contains a central supermassive black hole. As we have learned, galaxies of this type produce relativistic “jets” which are responsible for being bright at the radio frequencies, but that’s not all they create. While radio galaxies are generally elliptical, Speca is a spiral – reason behind is really unclear. As the relativistic jets surge with time, they create lobes of sub-atomic material at the outer edges which fan out as the material slows down… and Speca is one of only two galaxies so far discovered to show this type of recurrent jet activity. Normally it occurs once – and rarely twice – but here it has happened three times! We are looking at a unique opportunity to unravel the mysteries of the beginning phase of a black hole jet.

“Both elliptical and spiral galaxies have black holes, but Speca and another galaxy have been seen to produce large jets. It is also one of only two galaxies to show that such activity occurred in three separate episodes.” explains Sandeep Sirothia of NCRA-TIFR. “The reason behind this on-off activity of the black hole to produce jets is unknown. Such activities have not been reported earlier in spiral galaxies, which makes this new galaxy unique. It will help us learn new theories or change existing ones. We are now following the object and trying to analyse the activities.”

Dr. Hota and an international team of scientists reached their first conclusions while studying combined data from the visible-light Sloan Digital Sky Survey (SDSS) and the FIRST survey done with the Very Large Array (VLA) radio telescope. Here they discovered an unusually high rate of star formation where there should be none and they then confirmed their findings with ultraviolet data from NASA’s GALEX space telescope. Then the team dug even deeper with radio information obtained from the NRAO VLA Sky Survey (NVSS). At several hundred million years old, these outer lobes should be beyond their reproductive years… Yet, that wasn’t all. GMRT images displayed yet another, tiny lobe located just outside the stars at the edge of Speca in plasma that is just a few million years old.

“We think these old, relic lobes have been ‘re-lighted’ by shock waves from rapidly-moving material falling into the cluster of galaxies as the cluster continues to accrete matter,” said Ananda. “All these phenomena combined in one galaxy make Speca and its neighbours a valuable laboratory for studying how galaxies and clusters evolved billions of years ago.”

As you watch the above galaxy merger simulation created by Tiziana Di Matteo, Volker Springel, and Lars Hernquist, you are taking part in a visualization of two galaxies combining which both have central supermassive black holes and the gas distribution only. As they merge, you time travel over two billion years where the brightest hues indicate density while color denotes temperature. Such explosive process for the loss of gas is needed to understand how two colliding star-forming spiral galaxies can create an elliptical galaxy… a galaxy left with no fuel for future star formation. Outflow from the supernovae and central monster blackholes are the prime drivers of this galaxy evolution.

“Similarly, superfast jets from black holes are supposed to remove a large fraction of gas from a galaxy and stop further star formation. If the galaxy is gas-rich in the central region, and as the jet direction changes with time, it can have an adverse effect on the star formation history of a galaxy. Speca may have once been part of such a scenario. Where multiple jets have kicked out spiral arms from the galaxy. To understand such a process Dr Hota’s team has recently investigated NGC 3801 which has very young jet in very early-phase of hitting the host galaxy. Dust/PAH, HI and CO emission shows an extremely warped gas disk. HST data clearly showa outflow of heated-gas. This gas loss, as visualised in the video, has possibly caused the decline of star formation. However, the biggest blow from the monster’s jets are about to give the knock-down punch the galaxy.

“It seems, we observe this galaxy at a rare stage of its evolutionary sequence where post-merger star formation has already declined and new powerful jet feedback is about to affect the gaseous star forming outer disk within the next 10 million years to further transform it into a red-and-dead early-type galaxy.” Dr. Hota says.

The causes behind why present day radio galaxies do not contain a young star forming disks are not clear. Speca and NGC 3801 are ideal laboratories to understand black hole galaxy co-evolution processes.

Original Research Paper: Caught in the act: A post-merger starforming early-type galaxy with AGN-jet feedback. For Further Reading: Various press releases and news on the discovery of Speca. This article has been changed slightly from its original publication to reflect more information from Dr. Hota.

35 Years Later, the ‘Wow!’ Signal Still Tantalizes

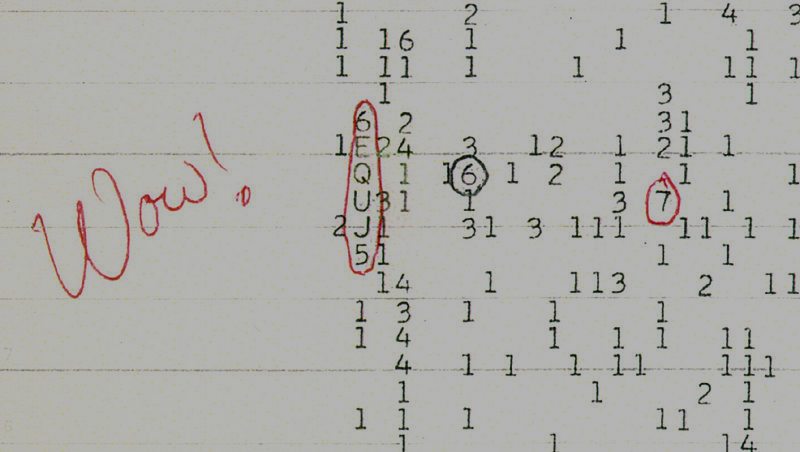
The "Wow!" signal. Credit: Wikimedia Commons

Since the SETI program first began searching for possible alien radio signals a few decades ago, there have been many false alarms but also instances of fleeting signals of interest which disappeared again as quickly as they had appeared. If a potential signal doesn’t repeat itself so it can be more carefully observed, then it is virtually impossible to determine whether it is of truly cosmic origin. One such signal in particular caught astronomers’ interest on August 15, 1977. The famous “Wow!” signal was detected by the Big Ear Radio Observatory at Ohio State University; it was thirty times stronger than the background noise but lasted only 72 seconds and was never heard again despite repeated subsequent searches.

In a new book titled The Elusive Wow, amateur astronomer Robert Gray chronicles the quest for the answer to this enduring puzzle.

When the signal was first seen in the data, it was so pronounced that SETI scientist Jerry Ehman circled it on the computer printouts in red ink and wrote “Wow!” next to it. It appeared to fit the criteria for an extraterrestrial radio signal, but because it wasn’t heard again, the follow-up studies required to either confirm or deny this were not possible. So what was it about the signal that made it so interesting?

First, it did appear to be an artificial radio signal, rather than a natural radio emission such as a pulsar or quasar. The Big Ear telescope used a receiver with 50 radio channels; the signal was only heard on one frequency, with no other noise on any of the other channels. A natural emission would cause static to appear on all of the frequencies, and this was not the case. The signal was narrow and focused, as would be expected from an artificial source.

The Big Ear Radio Observatory. Credit: Big Ear Radio Observatory / North American AstroPhysical Observatory / Ohio State University

The signal also “rose and fell” during the 72 seconds, as would be expected from something originating in space. When the radio telescope is pointed at the sky, any such signal will appear to increase in intensity as it first moves across the observational beam of the telescope, then peak when the telescope is pointed straight at it and then decrease as it moves away from the telescope. This also makes a mere computer glitch a less likely explanation, although not impossible.

What about satellites? This would seem to be an obvious possible explanation, but as Gray notes, a satellite would have to be moving at just the right distance and at just the right speed, to mimic an alien signal. But then why wasn’t it observed again? An orbiting satellite will broadcast its signal repeatedly. The signal was observed near the 1420 MHz frequency, a “protected spectrum” in which terrestrial transmitters are forbidden to transmit as it is reserved for astronomical purposes.

There may be a bias in thinking that any alien signals will be like ours which leak out to space continuously, ie. all of our radio and TV broadcasts. That is, “normal” radio emissions from every-day type technologies which could easily be seen on an ongoing basis. But what if they were something more like beacons, sent out intentionally but only on a periodic basis? As Gray explains, radio searches to date have tended to look at many different spots in the sky, but they will only examine any particular spot for a few minutes or so before moving on to the next. A periodic signal could easily be missed completely, or if seen, it may be a long time before it is seen again.

Of course, it is also possible that any other civilizations out there might not even use radio at all, especially if they are more advanced than us (while other intelligent life might be behind us, as well). A newer branch of SETI is now searching for artificial sources of light, like laser beams, used as beacons.

So where does this leave us? The “Wow!” signal still hasn’t been adequately explained, although various theories have been proposed over the years. Perhaps one day it will be observed again, or another one like it, and we will be able to solve the mystery. Until then, it remains a curiosity, a tantalizing hint of what a definite signal from an extraterrestrial civilization might look like.

More information is available at the Big Ear Radio Observatory website.

The Milky Way’s Magnetic Personality

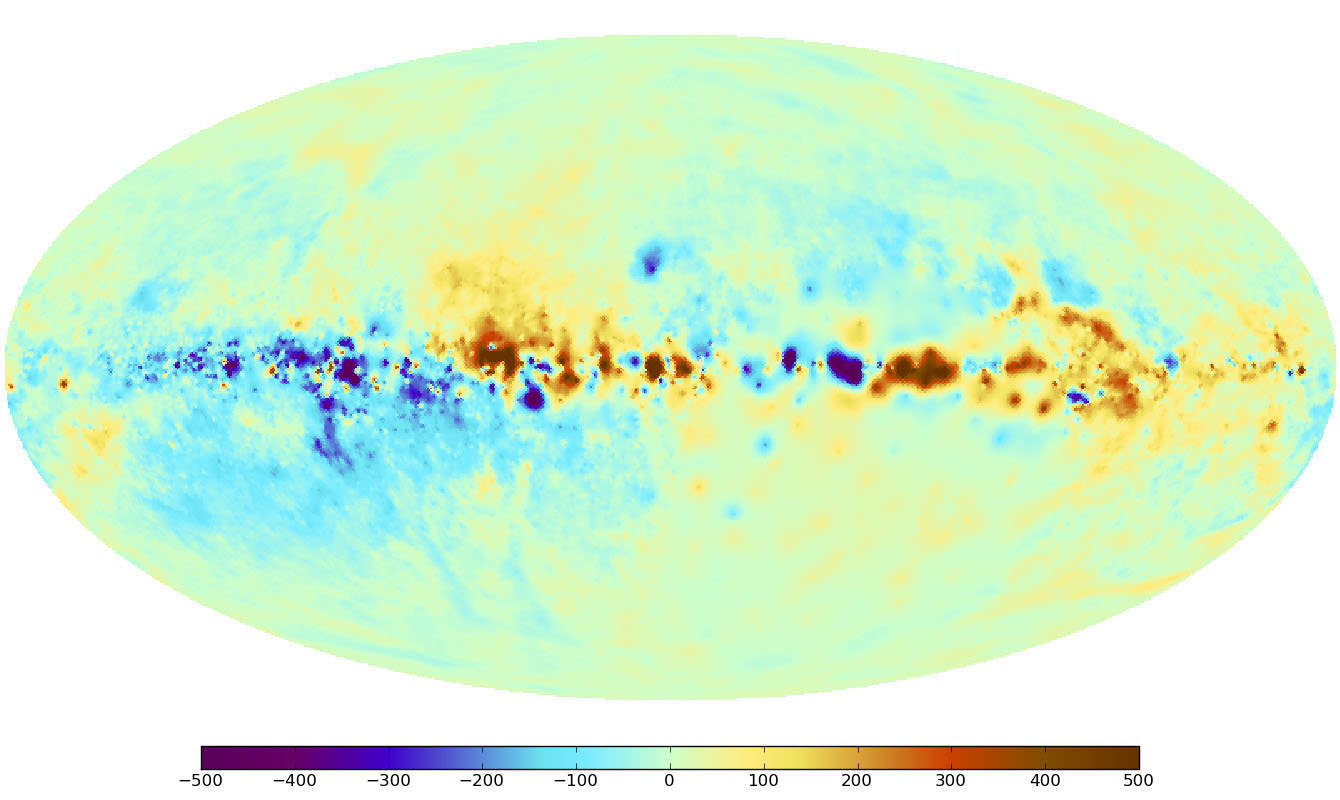
The sky map of the Faraday effect caused by the magnetic fields of the Milky Way. Red and blue colors indicate regions of the sky where the magnetic field points toward and away from the observer, respectively. The band of the Milky Way (the plane of the Galactic disk) extends horizontally in this panoramic view. The center of the Milky Way lies in the middle of the image. The North celestial pole is at the top left and the South Pole is at the bottom right. (Image Credit: Max Planck Institute for Astrophysics)

[/caption]

Recently we took a look at a very unusual type of map – the Faraday Sky. Now an international team of scientists, including those at the Naval Research Laboratory, have pooled their information and created one of the most high precision maps to date of the Milky Way’s magnetic fields. Like all galaxies, ours has a magnetic “personality”, but just where these fields come from and how they are created is a genuine mystery. Researchers have always simply assumed they were created by mechanical processes like those which occur in Earth’s interior and the Sun. Now a new study will give scientists an even better understanding about the structure of galactic magnetic fields as seen throughout our galaxy.

The team, led by the Max Planck Institute for Astrophysics (MPA), gathered their information and compiled it with theoretical simulations to create yet another detailed map of the magnetic sky. As NRL’s Dr. Tracy Clarke, a member of the research team explains, “The key to applying these new techniques is that this project brings together over 30 researchers with 26 different projects and more than 41,000 measurements across the sky. The resulting database is equivalent to peppering the entire sky with sources separated by an angular distance of two full moons.” This huge amount of data provides a new “all-sky” look which will enable scientists to measure the magnetic structure of the Milky Way in minute detail.
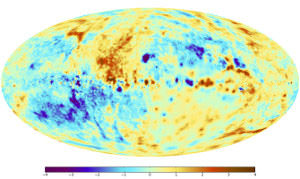
In this map of the sky, a correction for the effect of the Galactic disk has been made in order to emphasize weaker magnetic field structures. The magnetic field directions above and below the disk seem to be diametrically opposed, as indicated by the positive (red) and negative (blue) values. An analogous change of direction takes place across the vertical center line, which runs through the center of the Milky Way. (Image Credit: Max Planck Institute for Astrophysics)
Just what’s so “new” about this map? This time we’re looking at a quantity called Faraday depth – an idea dependent on a line-of-sight information set on the magnetic fields. It was created by combining more than 41,000 singular measurements which were then combined using a new image reconstruction method. In this case, all the researchers at MPA are specialists in the new discipline of information field theory. Dr. Tracy Clarke, working in NRL’s Remote Sensing Division, is part of the team of international radio astronomers who provided the radio observations for the database. It’s magnetism on a grand scale… and imparts even the smallest of magnetic features which will enable scientists to further understand the nature of galactic gas turbulence.

The concept of the Faraday effect isn’t new. Scientists have been observing and measuring these fields for the last century and a half. Just how is it done? When polarized light passes through a magnetized medium, the plane of the polarization flips… a process known as Faraday rotation. The amount of rotation shows the direction and strength of the field and thereby its properties. Polarized light is also generated from radio sources. By using different frequencies, the Faraday rotation can also be measured in this alternative way. By combining all of these unique measurements, researchers can acquire information about a single path through the Milky Way. To further enhance the “big picture”, information must be gathered from a variety of sources – a need filled by 26 different observing projects that netted a total of 41,330 individual measurements. To give you a clue of the size, that ends up being about one radio source per square degree of sky!

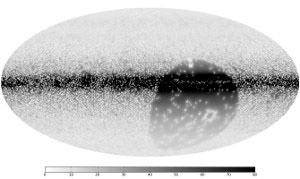
The uncertainty in the Faraday map. Note that the range of values is significantly smaller than in the Faraday map (Fig. 1). In the area of the celestial south pole, the measurement uncertainties are particularly high because of the low density of data points. (Image Credit: Max Planck Institute for Astrophysics)
Even with depth like this, there are still areas in the southern sky where only a few measurements have been cataloged. To fill in the gaps and give a more realistic view, researchers “have to interpolate between the existing data points that they have recorded.” However, this type of data causes some problems with accuracy. While you might think the more exact measurements would have the greatest impact on the map, scientists aren’t quite sure how reliable any single measurement could be – especially when they could be influenced by the environment around them. In this case, the most accurate measurements don’t always rank the highest in mapping points. Like Heisenberg, there’s an uncertainty associated with the process of obtaining measurements because the process is so complex. Just one small mistake could lead to a huge distortion in the map’s contents.

Thanks to an algorithm crafted by the MPA, scientists are able to face these types of difficulties with confidence as they put together the images. The algorithm, called the “extended critical filter,” employs tools from new disciplines known as information field theory – a logical and statistical method applied to fields. So far it has proven to be an effective method of weeding out errors and has even proven itself to be an asset to other scientific fields such as medicine or geography for a range of image and signal-processing applications.

Even though this new map is a great assistant for studying our own galaxy, it will help pave the way for researchers studying extragalactic magnetic fields as well. As the future provides new types of radio telescopes such as LOFAR, eVLA, ASKAP, MeerKAT and the SKA , the map will be a major resource of measurements of the Faraday effect – allowing scientists to update the image and further our understanding of the origin of galactic magnetic fields.

Original Story Source: Naval Research Laboratory News.

Recycling Pulsars – The Millisecond Matters…

An artist's impression of an accreting X-ray millisecond pulsar. The flowing material from the companion star forms a disk around the neutron star which is truncated at the edge of the pulsar magnetosphere. Credit: NASA / Goddard Space Flight Center / Dana Berry

[/caption]

It’s a millisecond pulsar… a rapidly rotating neutron star and it’s about to reach the end of its mass gathering phase. For ages the vampire of this binary system has been sucking matter from a donor star. It has been busy, spinning at incredibly high rotational speeds of about 1 to 10 milliseconds and shooting off X-rays. Now, something is about to happen. It is going to lose a whole lot of energy and age very quickly.

Astrophysicist Thomas Tauris of Argelander-Institut für Astronomie and Max-Planck-Institut für Radioastronomie has published a paper in the February 3 issue of Science where he has shown through numerical equations the root of stellar evolution and accretion torques. In this model, millisecond pulsars are shown to dissipate approximately half of their rotational energy during the last phase of the mass-transfer process and just before it turns into a radio source. Dr. Tauris’ findings are consistent with current observations and his conclusions also explain why a radio millisecond pulsar appears age-advanced over their companion stars. This may be the answer as to why sub-millisecond pulsars don’t exist at all!

“Millisecond pulsars are old neutron stars that have been spun up to high rotational frequencies via accretion of mass from a binary companion star.” says Dr. Tauris. “An important issue for understanding the physics of the early spin evolution of millisecond pulsars is the impact of the expanding magnetosphere during the terminal stages of the mass-transfer process.”

By drawing mass and angular momentum from a host star in a binary system, a millisecond pulsar lives its life as a highly magnetized, old neutron star with an extreme rotational frequency. While we might assume they are common, there are only about 200 of these pulsar types known to exist in galactic disk and globular clusters. The first of these millisecond pulsars was discovered in 1982. What counts are those that have spin rates between 1.4 to 10 milliseconds, but the mystery lay in why they have such rapid spin rates, their strong magnetic fields and their strangely appearing ages. For example, when do they switch off? What happens to the spin rate when the donor star quits donating?

“We have now, for the first time, combined detailed numerical stellar evolution models with calculations of the braking torque acting on the spinning pulsar”, says Thomas Tauris, the author of the present study. “The result is that the millisecond pulsars lose about half of their rotational energy in the so-called Roche-lobe decoupling phase. This phase is describing the termination of the mass transfer in the binary system. Hence, radio-emitting millisecond pulsars should spin slightly slower than their progenitors, X-ray emitting millisecond pulsars which are still accreting material from their donor star. This is exactly what the observational data seem to suggest. Furthermore, these new findings can help explain why some millisecond pulsars appear to have characteristic ages exceeding the age of the Universe and perhaps why no sub-millisecond radio pulsars exist.”

Thanks to this new study we’re now able to see how a spinning pulsar could possibly brake out of an equilibrium spin. At this age, the mass-transfer rate slows down and affects the magnetospheric radius of the pulsar. This in turn expands and forces the incoming matter to act as a propeller. The action then causes the pulsar to slow down its rotation and – in turn – slow its spin rate.

“Actually, without a solution to the “turn-off” problem we would expect the pulsars to even slow down to spin periods of 50-100 milliseconds during the Roche-lobe decoupling phase”, concludes Thomas Tauris. “That would be in clear contradiction with observational evidence for the existence of millisecond pulsars.”

Original Story Source: Max-Planck-Institut für Radioastronomie News Release>. For Further Reading: Spin-Down of Radio Millisecond Pulsars at Genesis.

Students Discover Millisecond Pulsar, Help in the Search for Gravitational Waves

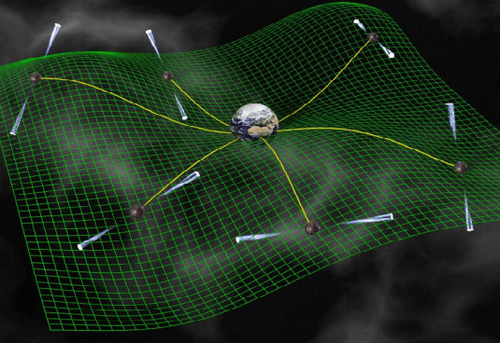
Using an array of millisecond pulsars, astronomers can detect tiny changes in the pulse arrival times in order to detect the influence of gravitational waves. Credit: NRAO

[/caption]

A special project to search for pulsars has bagged the first student discovery of a millisecond pulsar – a super-fast spinning star, and this one rotates about 324 times per second. The Pulsar Search Collaboratory (PSC) has students analyzing real data from the National Radio Astronomy Observatory’s (NRAO) Robert C. Byrd Green Bank Telescope (GBT) to find pulsars. Astronomers involved with the project said the discovery could help detect elusive ripples in spacetime known as gravitational waves.

“Gravitational waves are ripples in the fabric of spacetime predicted by Einstein’s theory of General Relativity,” said Dr. Maura McLaughlin, from West Virginia University. “We have very good proof for their existence but, despite Einstein’s prediction back in the early 1900s, they have never been detected.”

Four other pulsars have been discovered by high school students participating in this project.

Pulsar hunters Sydney Dydiw of Trinity High School, Emily Phan of George C. Marshall High School, Anne Agee of Roanoke Valley Governor's School, and Jessica Pal of Rowan County High School. Not pictured: Max Sterling of Langley High School. Credit: NRAO

“When you discover a pulsar, you feel like you’re walking on air! It is the best experience you can ever have,” said student co-discoverer Jessica Pal of Rowan County High School in Kentucky. “You get to meet astronomers and talk to them about your experience. I still can’t believe I found a pulsar. It is wonderful to know that there is something out there in space that you discovered.”

The other student involved in the discovery was Emily Phan of George C. Marshall High School in Virginia, who along with Pal found the millisecond pulsar on January 17, 2012. It was later confirmed by Max Sterling of Langley High School, Sydney Dydiw of Trinity High School, and Anne Agee of Roanoke Valley Governor’s School, all in Virginia.

“I am considering pursuing astronomy as a career choice,” said Agee. “The Pulsar Search Collaboratory has opened my eyes to how fun astronomy can be!”

Once the pulsar candidate was reported to NRAO, a followup observing session was scheduled on the giant, 17-million-pound telescope. On January 24, 2012, observations confirmed that the pulsar was real.

Pulsars are spinning neutron stars that sling “lighthouse beams” of radio waves around as they rotate. A neutron star is what is left after a massive star explodes at the end of its “normal” life. With no nuclear fuel left to produce energy to offset the stellar remnant’s weight, its material is compressed to extreme densities. The pressure squeezes together most of its protons and electrons to form neutrons; hence, the name “neutron star.” One tablespoon of material from a pulsar would weigh 10 million tons.

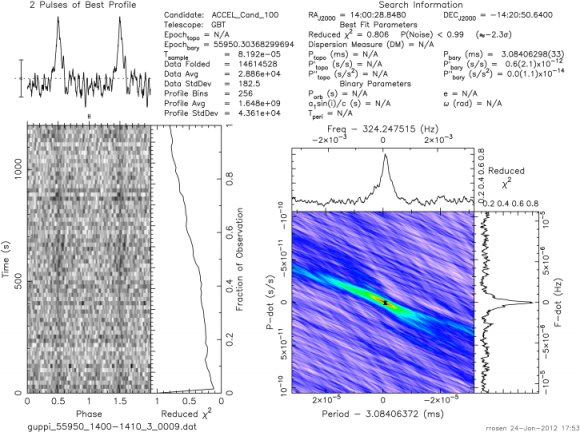
On January 24, 2012, observations with the Green Bank Telescope at 800 MHz confirmed that the signal was astronomical and zeroed in on its position. Pulsars are brighter at lower frequencies (like 350 MHz, above) than at higher frequencies, and so the confirmation plot is noisier than the original data. Since this pulsar spins so fast, it may be used as part of the pulsar timing array used to detect gravitational waves. Courtesy NRAO.

The object that the students discovered is a special class of pulsars called millisecond pulsars, which are the fastest-spinning neutron stars. They are highly stable and keep time more accurately than atomic clocks.

Astronomers don’t know much about them, however. But because of their stability, these pulsars may someday allow astronomers to detect gravitational waves.

Millisecond pulsars, however, could hold the key to that discovery. Like buoys bobbing on the ocean, pulsars can be perturbed by gravitational waves.

“Gravitational waves are invisible,” said McLaughlin. “But by timing pulsars distributed across the sky, we may be able to detect very small changes in pulse arrival times due to the influence of these waves.”

Millisecond pulsars are generally older pulsars that have been “spun up” by stealing mass from companion stars, but much is left to discover about their formation.

“This latest discovery will help us understand the genesis of millisecond pulsars,” said Dr. Duncan Lorimer, who is also part of the project. “It’s a very exciting time to be finding pulsars!”

Robert C. Byrd Green Bank Telescope CREDIT: NRAO/AUI/NSF

The PSC is a joint project of the National Radio Astronomy Observatory and West Virginia University, funded by a grant from the National Science Foundation. The PSC includes training for teachers and student leaders, and provides parcels of data from the GBT to student teams. The project involves teachers and students in helping astronomers analyze data from the GBT.

Approximately 300 hours of the observing data were reserved for analysis by student teams. These students have been working with about 500 other students across the country. The responsibility for the work, and for the discoveries, is theirs. They are trained by astronomers and by their teachers to distinguish between pulsars and noise.

The PSC will continue through the 2012-2013 school year. Teachers interested in participating in the program can learn more at this link. The National Radio Astronomy Observatory is a facility of the National Science Foundation, operated under cooperative agreement by Associated Universities, Inc.