The Black Marble: Stunning New Orbital Views of Earth at Night

This image of Asia and Australia at night is a composite assembled from data acquired by the Suomi NPP satellite in April and October 2012. Credit: NASA, NOAA, and the Department of Defense.

Two months of night-time imagery gathered by the Suomi NPP satellite have resulted in a stunning new look at Earth at night, appropriately nicknamed the Black Marble.

The nighttime views were made possible by the new satellite’s “day-night band” of the Visible Infrared Imaging Radiometer Suite. VIIRS detects light in a range of wavelengths from green to near-infrared and uses filtering techniques to observe dim signals such as city lights, gas flares, auroras, wildfires, and reflected moonlight. In this case, auroras, fires, and other stray light have been removed to emphasize the city lights.

“This is not your father’s low light sensor!” said Steve Miller, senior research scientist and deputy director of the Cooperative Institute for Research in the Atmosphere (CIRA), Colorado State University, speaking at the American Geophysical Union conference this week.

See more views and a video presentation of the VIIRS data below:

The new satellite is providing a much higher resolution across a greater band of light than previous night-light gathering satellites.

Originally developed for meteorologists to be able to look at nighttime clouds, the VIIRS data is providing a wide variety of information. “We are getting as much mileage from these data sets as we can,” said Chris Elvidge, who leads the Earth Observation Group at NOAA’s National Geophysical Data Center.

Elvidge and Miller said the data is being used to model population distribution, fossil fuel and CO2 emissions, and other information that can be gleaned from nighttime lights such finding power outages, determining astronomical viewing conditions, providing site selection for astronomical observatories, and looking at impacts of artificial lights on humans and animals.

The difference between electrical lights and fires, and night glow and auroras can even be determined by VIIRS.

North and South America at night is a composite assembled from data acquired by the Suomi NPP satellite in April and October 2012. Credit: NASA, NOAA, and the Department of Defense.

Europe, Africa, and the Middle East at night is a composite assembled from data acquired by the Suomi NPP satellite in April and October 2012. Credit: NASA, NOAA, and the Department of Defense.

Named for satellite meteorology pioneer Verner Suomi, NPP flies over any given point on Earth’s surface twice each day at roughly 1:30 a.m. and p.m. The polar-orbiting satellite flies 824 kilometers (512 miles) above the surface, sending its data once per orbit to a ground station in Svalbard, Norway, and continuously to local direct broadcast users distributed around the world,
.

See more imagery and get additional information about the night-time VIIRS Data at the NASA Earth Observatory website.

Huge New ESA Tracking Station is Ready for Duty

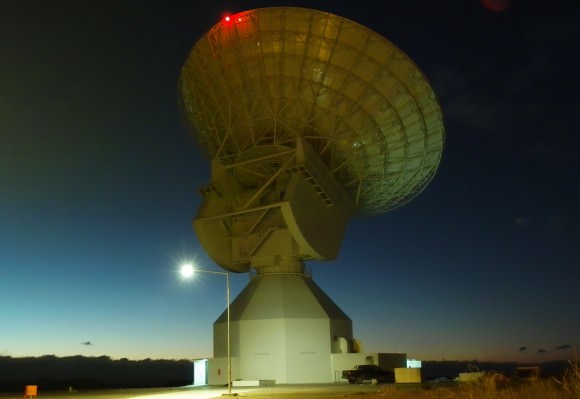
Caption: ESA’s giant Malargüe tracking station Credits: ESA/S. Marti

To keep in contact with an ever growing armada of spacecraft ESA has developed a tracking station network called ESTRACK. This is a worldwide system of ground stations providing links between satellites in orbit and ESA’s Operations Control Centre (ESOC) located in Darmstadt, Germany. The core ESTRACK network comprises 10 stations in seven countries. Major construction has now been completed on the final piece of this cosmic jigsaw, one of the world’s most sophisticated satellite tracking stations at Malargüe, Argentina, 1000 km west of Buenos Aires.

ESA’s Core Network comprises 10 ESTRACK stations: Kourou (French Guiana), Maspalomas, Villafranca (Spain), Redu (Belgium), Santa Maria (Portugal), Kiruna (Sweden), Perth (Australia) which host 5.5-, 13-, 13.5- or 15-metre antennas. The new tracking station (DSA3) at Malargüe in Argentina, joins two other 35-metre deep-space antennas at New Norcia (DSA1) in Australia (completed in 2002) and Cebreros (DSA2) in Spain, (completed in 2005) to form the European Deep Space Network.

The essential task of ESTRACK stations is to communicate with missions, up-linking commands and down-linking scientific data and spacecraft status information. The tracking stations also gather radiometric data to tell mission controllers the location, trajectory and velocity of their spacecraft, to search for and acquire newly launched spacecraft, in addition to auto-tracking, frequency and timing control using atomic clocks and gathering atmospheric and weather data.

Deep-space missions can be over 2 million kilometres away from the Earth. Communicating at such distances requires highly accurate mechanical pointing and calibration systems. The 35m stations provide the improved range, radio technology and data rates required to send commands, receive data and perform radiometric measurements for current and next-generation exploratory missions such as Mars Express, Venus Express, Rosetta, Herschel, Planck, Gaia, BepiColombo, ExoMars, Solar Orbiter and Juice.

DSA3 is located at 1500m altitude in the clear Argentinian desert air, this and ultra-low-temperature amplifiers installed at the station, have meant that performance has exceeded expectations. The first test signals were received in June 2012 from Mars Express, over a distance of about 193 million km, proving that the station’s technology is ready for duty.

“Initial in-service testing with the Malargüe station shows excellent results.” “Our initial in-service testing with the Malargüe station shows excellent results,” says Roberto Maddè, ESA’s project manager for DSA 3 construction. “We have been able to quickly and accurately acquire signals from ESA and NASA spacecraft, and our station is performing better than specified.”

All three tracking stations are also equipped for radio science, which studies how matter, such as planetary atmospheres, affects the radio waves as they pass through. This can provide important information on the atmospheric composition of Mars, Venus or the Sun.

The tracking capability of all three ESA deep space stations also work in cooperation with partner agencies such as NASA and Japan’s JAXA, helping to boost science data return for all. The three Deep Space Antenna can be linked to the 7 stations comprising the Core Network as well as five other stations making up the larger Augmented Network and eleven additional stations that make up a global Cooperative Network with other space agencies from around the world.

Now that major construction is complete, teams are preparing DSA 3 for hand-over to operations, formal inauguration late this year and entry in routine service early in 2013.

Find out more about Malargüe and the Deep Space Antenna here and the other ESTRACK tracking stations here
Timelapse of Hurricane Sandy, Satellite Views October 23-31, 2012

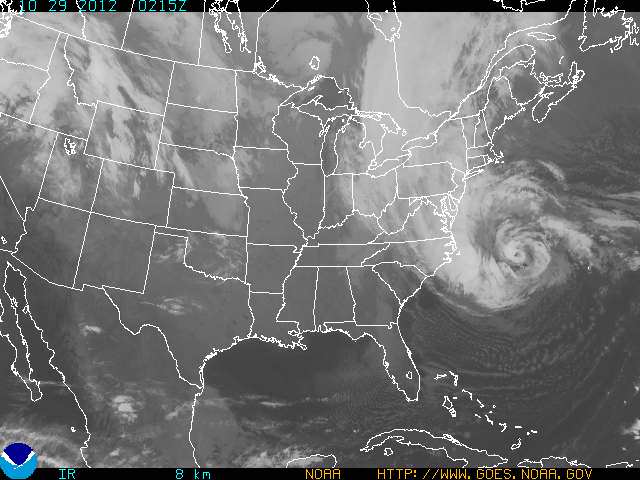
Here’s a complete animation of Hurricane Sandy from October 23-31, as seen by GOES-13, a geosynchronous satellite that is in orbit nearly 36,000 km (23,000 miles) above Earth. This huge storm was costly in terms of death and destruction. The death toll currently stands at 160 (88 in the U.S., 54 in Haiti, 11 in Cuba), with damage estimates ranging from $10 – $55 billion.

Below is a timelapse animation which shows the full hemisphere view from GOES-13, showing the development of Hurricane Sandy as it begins over Central America and begins its path up through the Caribbean and the east coast of the U.S.

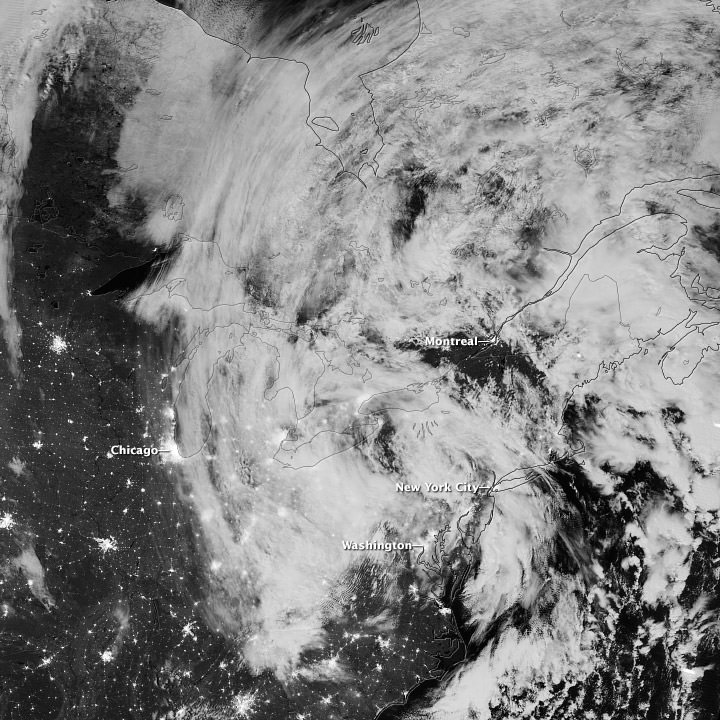
The Visible Infrared Imaging Radiometer Suite (VIIRS) on the Suomi NPP satellite acquired this image of the storm around 3:13 a.m. Eastern Daylight Time (7:13 Universal Time) on October 31. Credit: NASA/NOAA

This image from the Suomi NPP satellite shows remnants of Hurricane Sandy as it moved inland in the early morning hours of October 31, 2012. As the center of the system passed Pennsylvania, its maximum sustained winds were 40 miles (64 kilometers) per hour. This image is from the “day-night band” on VIIRS, which detects light wavelengths from green to near-infrared. The Moon lit the tops of the clouds.

Sandy’s clouds stretched from Hudson Bay to Chicago and Washington. Clusters of lights gave away the locations of some cities throughout the region; but along the East Coast, clouds mostly obscured the lights, many of which were blacked out due to the storm. On October 31, the Wall Street Journal reported that several million customers in multiple states were without electricity.

You can see more satellite images of Sandy’s traverse at the NASA Earth Observatory website.

Satellites Provide 3-D Views and More of Hurricane Sandy

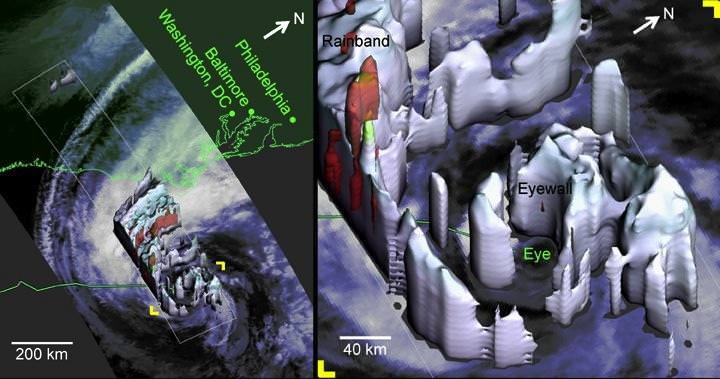
Hurricane Sandy as viewed by the TRMM Precipitation Radar at 2:20 EDT on Oct. 28, 2012. Credit: NASA

Satellite imagery and data has been invaluable in predicting the path and intensity of storms like Hurricane Sandy. Satellites like NASA’s Tropical Rainfall Measuring Mission (TRMM) can measure rainfall rates and cloud heights in tropical cyclones, and was used to create a 3-D image, above, to allow forecasters to look inside the hurricane, and predict fairly spot-on what locations would be affected the worst. There’s even a 3-D video view from the CloudSat satellite, and much more, including a stunning wind map, and this round-up from JPL of various satellite views of the storm. You can also see a slideshow of NASA satellite images and videos on the NASA Goddard Flickr site.

This exemplifies just one reason why space exploration is important, and why people are maybe now starting to realize how our failure to plan ahead and invest in weather satellites may become a problem. Without those eyes in the sky we are blind to the minute-to-minute and hour-to-hour development of storms and weather, not to mention overall study of the climate.

Below is a stunning high-speed satellite view from the GOES-14 satellite:

Focusing just on the area of the storm, the GOES-14 Super Rapid Scan Operation (SRSO) captures infrared and visible data every minute and relays that information to forecasters on the ground. This animation shows the GOES-14 SRSO for October 29, 2012 as Hurricane Sandy approached the U.S. coastline.

Incredible Video of Sandy’s Swirling Progression

Just released, this mesmerizing animation was created by Kevin Ward from images acquired by NOAA’s GOES-O/14 satellite. It shows the progression of Hurricane Sandy, currently a Category 1 hurricane off the coast of the eastern U.S. that’s poised to make a devastating impact when its heavy rains, winds and storm surges strike the shores of many major metropolitan coastal areas — including New York City and Washington, D.C.

Nearly 12 hours of time are compressed into 30 seconds, revealing the evolution of Sandy as it churned over the Atlantic on Sunday, October 28.

 From NASA’s Earth Observatory’s YouTube page:
This time-lapse animation shows Hurricane Sandy from the vantage point of geostationary orbit—35,800 km (22,300 miles) above the Earth. The animation shows Sandy on October 28, 2012, from 7:15 to 6:26 EDT. Light from the changing angles of the sun highlight the structure of the clouds. The images were collected by NOAA’s GOES-14 satellite. The “super rapid scan” images — one every minute from 7:15 a.m. until 6:30 p.m. EDT — reveal details of the storm’s motion.

Launched by NASA as GOES-O on June 27, 2009, GOES-14 is now under control by the NOAA, keeping an eye on the mid-Atlantic region from a geostationary position approximately 22,300 miles (35,800 km) above the Earth.

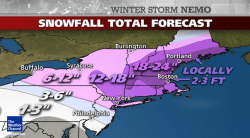
Sandy is expected to bring up to 10 inches of rain into New York, with a surge possible over 6 feet above high tide and wind gusts in excess of 75 mph. Once the hurricane moves inland there could be millions left without electricity. States of emergency have already been declared in many areas within Sandy’s projected path.

Read: Hurricane Sandy Barreling to Eastern Seaboard, Menacing Millions

Currently Sandy is off the coast of North Carolina (at the time of this writing, 34.5 N / 70.5 W) moving northeast at 14 mph (22  km/h) with a low pressure of 950 mb… that’s as low or lower than some of the most powerful storms to hit the eastern U.S. over the past century, including the “perfect storm” of 1991 (a low system which also struck at Halloween) and the deadly 1938 “Great Hurricane”, which devastated coastal regions all across southern New England.

Stay up to date on Hurricane Sandy’s progress on the NOAA page here, with the latest public advisories being posted here.

NASA animation by Kevin Ward, using images from NOAA and the University of Wisconsin-Madison Cooperative Institute for Meteorological Satellite Studies.

NASA Satellite Sees Ghostly Remains of Vanishing Arctic Sea Ice

Sea ice swirls in ocean currents off the coast of Greenland (NASA/GSFC)

Spooky spectral swirls of last season’s sea ice drift in currents off the coast of eastern Greenland in this image from NASA’s Aqua satellite, acquired on October 17. Although sea ice in the Arctic will start forming again after September’s record low measurements, these ghostly wisps are likely made up of already-existing ice that has migrated south.

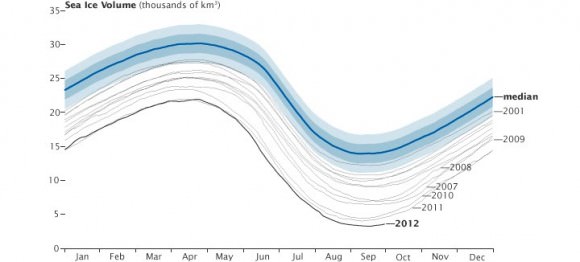
As global temperatures rise — both over land and in the ocean — thinner sea ice builds up during the Arctic winter and thus more of it melts during the summer, a pattern that will eventually lead to an ice-free Arctic if trends continue. The past several years saw sea ice in the Arctic below the 1979-2000 average, with this past September displaying the lowest volumes yet recorded.

The graph below, made from data modeled by the Polar Science Center at the University of Washington, show the chilling — or, perhaps, not-so-chilling — results of this century’s recent observations.

Along Greenland’s east coast, the Fram Strait serves as an expressway for sea ice moving out of the Arctic Ocean. The movement of ice through the strait used to be offset by the growth of ice in the Beaufort Gyre.

Until the late 1990s, ice would persist in the gyre for years, growing thicker and more resistant to melt. Since the start of the twenty-first century, however, ice has been less likely to survive its trip through the southern part of the Beaufort Gyre. As a result, less Arctic sea ice has been able to pile up and form multi-year ice.

Thin, free-drifting ice — as seen above — moves very easily with winds and currents.

Aqua is a NASA Earth Science satellite mission named for the large amount of information that the mission is collecting about the Earth’s water cycle, including evaporation from the oceans, water vapor in the atmosphere, clouds, precipitation, soil moisture, sea ice, land ice, and snow cover on the land and ice. Aqua was launched on May 4, 2002, and carries six Earth-observing instruments in a near-polar low-Earth orbit. MODIS, which acquired the image above, is a 36-band spectroradiometer that measures physical properties of the atmosphere, oceans and land.

Source: NASA Earth Observatory

NASA image courtesy Jeff Schmaltz, LANCE MODIS Rapid Response Team at NASA GSFC. Graph by Jesse Allen based on modeled ice volume data from the Polar Science Center, University of Washington. Caption portions by Michon Scott with information from Ted Scambos, National Snow and Ice Data Center.

Satellite Views: Will Hurricane Sandy Turn into ‘Frankenstorm’?

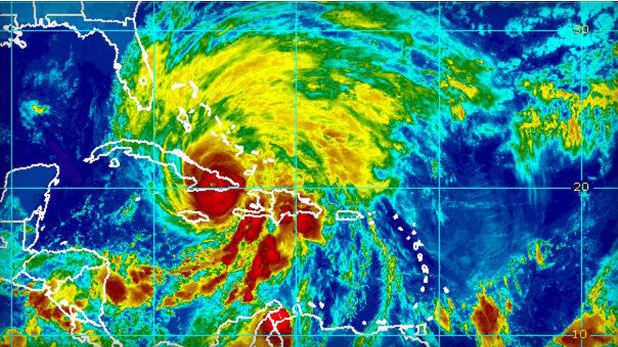
Hurricane Sandy made landfall on Cuba early Thursday Oct. 25, 2012 as strong Category 2. Credit: NOAA/National Hurricane Center

Meteorologists keeping an eye on Hurricane Sandy say the storm threatens to move up along the east coast of the United States and could mix with a wintery storm coming from the west to form a monster storm that has been informally dubbed “Frankenstorm.” The hurricane could reach the US coast by this weekend and when the two storms collide, it could continue to pound the eastern seaboard well into the week of Halloween.

Hurricane Sandy is now in the Caribbean as a Category 2 storm coastal areas from Florida to Maine will feel some effects, forecasters predict. The mix of the two storms could cause weather problems in the Washington DC area to New York city, some of the most populous areas of the US.

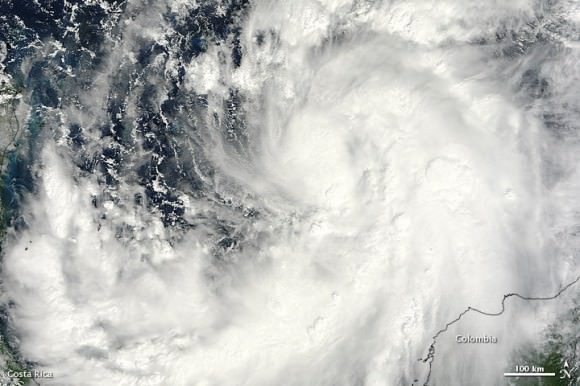
Satellite image of then Tropical Storm Sandy taken on October 23, 2012 as it was over the Caribbean Sea taken by the Moderate Resolution Imaging Spectroradiometer (MODIS) on NASA’s Terra satellite. NASA image courtesy Jeff Schmaltz, LANCE MODIS Rapid Response Team at NASA GSFC.

Forecasters are saying this could be a major mess, with a 90 percent chance that the East will get steady gale-force winds, heavy rain, flooding and maybe snow.

While no one can positively predict what Hurricane Sandy will do and how the two storms might mesh into one monster storm, the Washington Post’s Capital Weather Gang has outlined the possible scenarios from worst case to where the storms collide and remained parked over the region for days, to best case, where Sandy heads to the northeast sparing the East Coast from a direct hit.

We’ll post additional updated satellite views as they become available.

Sources: NASA Earth Observatory, CBS News, Climate Central
, NOAA

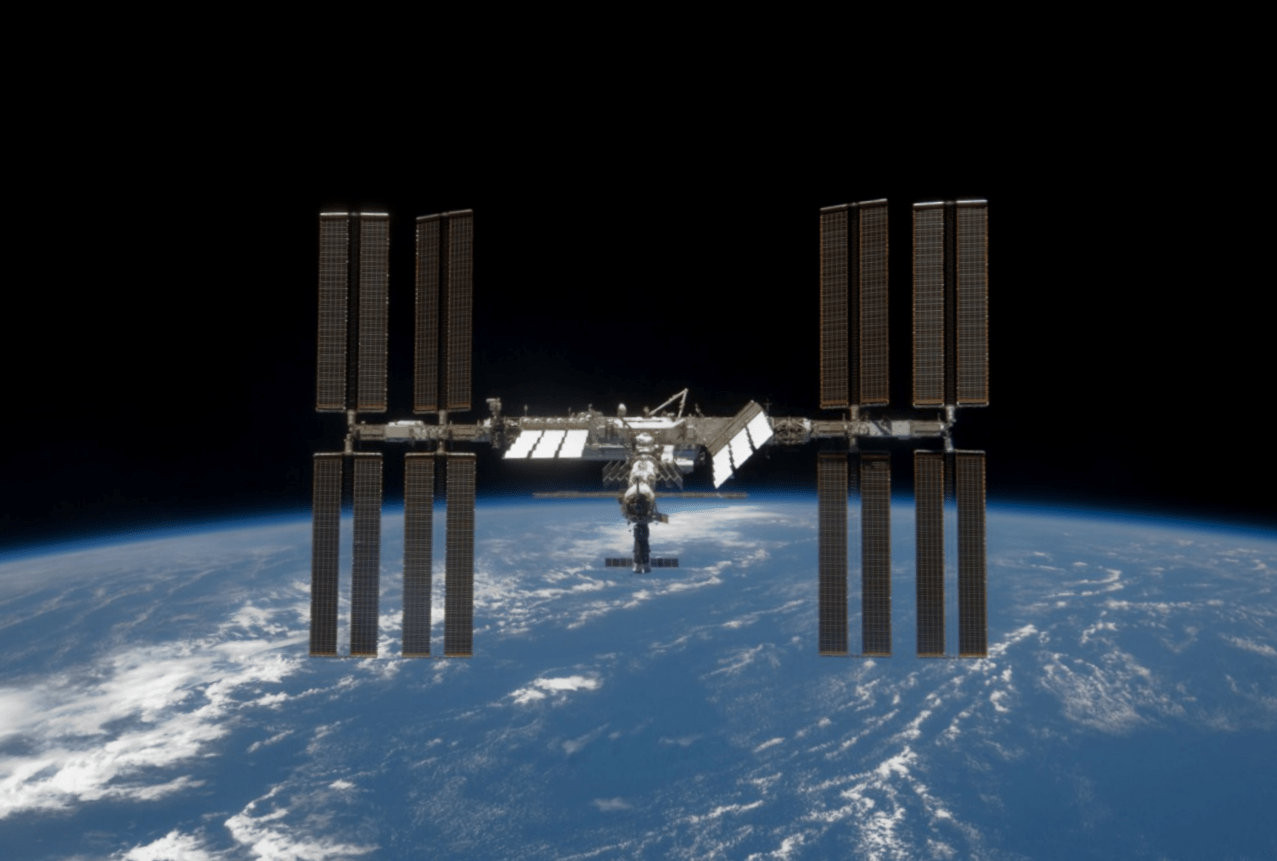
Exploded Rocket Fragments Could Endanger ISS and Future Missions

The International Space Station will have to look out for new debris from an exploded Russian rocket (NASA image)

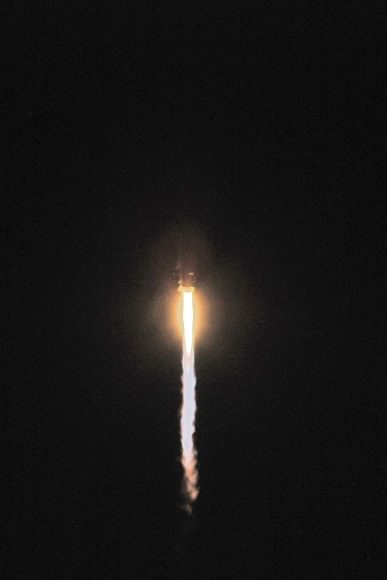
Traveling through low-Earth orbit just got a little more dangerous; a drifting Russian Breeze M (Briz-M) rocket stage that failed to execute its final burns back on August 6 has recently exploded, sending hundreds of shattered fragments out into orbit.

Russia and the U.S. Defense Department (JFCC-Space) have stated that they are currently tracking 500 pieces of debris from the disintegrated Breeze M, although some sources are saying there are likely much more than that.

After a successful liftoff via Proton rocket on August 6 from the Baikonur Cosmodrome, the Breeze M upper stage’s engines shut off after only 7 seconds as opposed to the normal 18 minutes, leaving its fuel tanks filled with 10 to 15 tons of hydrazine and nitrogen tetroxide propellants. Its payloads, the Indonesian Telkom 3 and the Russian Express-MD2 communications satellites, were subsequently deployed into the wrong orbits as the Breeze M computer continued functioning.

Although originally expected to remain intact for at least another year, the rocket stage “violently disintegrated” on October 16. Evidence of the explosion was first observed by astronomer Robert McNaught at Australia’s Siding Springs Observatory, who counted 70 fragments visible within the narrow field-of-view telescope he was using for near-Earth asteroid observations.

The exact cause of the explosion isn’t known — it may have been sparked by an impact with another piece of space junk or the result of stresses caused by the Breeze M’s eccentric orbit, which varied in altitude from 265 to 5,015 kilometers (165 miles to 3,118 miles) with an inclination of 49.9 degrees.

This was the third such breakup of a partially-full Breeze M upper stage in orbit, the previous events having occurred in 2007 and 2010, and yet another Breeze M still remains in orbit after a failed burn in August 2011.

Most of the latest fragments are still in orbit at altitudes ranging from 250 to 5,000 km (155 to 3,100 miles), where they are expected to remain.

“Although some of the pieces have begun to re-enter, most of the debris will remain in orbit for an extended period of time.”

– Jamie Mannina, US State Department spokesperson

According to NASA the debris currently poses no immediate threat to the Space Station although the cloud is “believed not to be insignificant.” Still, according to a post on Zarya.com the Station’s course will periodically take it within the Breeze M debris cloud, and “will sometimes spend several days at a time with a large part of its orbit within the cloud.”

Source: RT.com and SpaceflightNow.com.  Inset image: the Breeze M (Briz-M) upper stage which disintegrated on Oct. 16. (Khrunichev)

Here’s Your Chance to Scream in Space

The STRaND-1 Smartphone Nanosatellite. Credit: Surry Satellite Technology

The first “Alien” movie was promoted with the celebrated tagline, “In space, no one can hear you scream.” But a group of students want to find out if this is really true, and they’re asking the public for help. Students from the University of Cambridge in the UK will be loading human screams onto a smartphone that will be launched into space in December 2012 on a nanosatellite. The screams will be played at maximum volume while the smartphone is in low Earth orbit, and at the same time as the phone will record the playback to test if it’s possible to capture the sound of screaming in space. They want the best screams possible, and so are inviting the public to submit their screams via video. There will also be public voting on the screams to determine which screams will go to space.

You know you’ve always wanted to do this…..

“Obviously, we’re not expecting to get much back, there may be some buzzing, but this is more about getting young people interested in satellites and acoustics, perhaps encouraging them to consider future study in science or engineering” said Edward Cunningham, a physics undergraduate at Churchill College and one of the members of the Cambridge University Space Flight group (CUSF).

What is actually being tested is verifying the capabilities of a smartphone to control a satellite in space. UK space company Surrey Satellite Technology and their STRaND (Surrey Training Research and Nanosatellite Demonstration) team ran a Facebook competition to find apps to go into orbit – and CUSF’s screaming app was one of the winners. STRaND-1 project is touted as the “World’s first SmartPhone Nanosatellite.”

Here’s a video showing the satellite:

The phone will run on Android’s open-source operating system, and a computer, built at the Surrey Space Centre, will test the vital statistics of the phone once in space. When all the tests are complete, the plan is to switch off the micro-computer and the smartphone will be used to operate parts of the satellite. At its lowest, the phone will orbit 400km above the Earth, roughly the same as the International Space Station.

“Modern smartphones are pretty amazing,” said Shaun Kenyon, the project manager at Surrey Satellite Technology. “We want to see if the phone works up there, and if it does, we want to see if the phone can control a satellite.”

To submit your scream, create a YouTube video and send it in at www.screaminspace.com.

Each video must be at most ten seconds long, and there will be ten winning screams which can be voted for by the public on the project’s website. Screams must be entered before midnight (UTC) on Sunday November 4, 2012. The winning videos will be announced later and loaded onto the phone for launch, which is scheduled before the end of this year.

Other winners in the STRaND-1 project were iTesa, which will record the magnitude of the magnetic field around the phone during orbit, a STRAND Data app will show satellite telemetry on the smartphone’s display which can be imaged by an additional camera on-board, and Postcards from Space and 360, a joint effort with an app that will take images using the smartphone’s camera and use the technology onboard the spacecraft to establish STRaND-1’s position.

Source: University of Cambridge
, Surrey Satellite

Cheops – A Little Satellite with Big Ideas

Caption: Artist impression of Cheops. Credit: University of Bern

Big isn’t always better. This is certainly true at ESA’s new Science Programme. They are looking to low cost, small scale missions that can be rapidly developed, in order to offer greater flexibility in response to new ideas from the scientific community, to complement the broader Medium- and Large-class missions. Back in March ESA called for ideas for dedicated, quick-turnaround missions focusing on key issues in space science. From 26 proposals submitted, ESA has now approved a new mission to be launched in 2017. Though small in scale this mission is big on ambition: to search for nearby habitable planets.

Cheops stands for CHaracterising ExOPlanets Satellite. It has a planned mission lifetime of 3.5 years during which it will operate in a Sun-synchronous low-Earth orbit at an altitude of 800 km, free from distortion by Earth’s atmosphere. It will target nearby, bright stars already known to have planets orbiting around them.

By high-precision monitoring of the star’s brightness, Cheops will search for signs of a ‘transit’ as a planet passes across the star’s face, it will also be able to look for smaller planets, impossible to see using ground based telescopes, around those stars.

While NASA’s Kepler mission has confirmed 77 planets so far, with another 2,321 candidate planets, not one is close enough to Earth to be analysed in detail. Cheops on the other hand, will be able to take accurate measurements of the radius of the planet. For those planets with a known mass, this will reveal the planet’s density and provide an indication of the internal structure. It will help scientists understand the formation of planets from ‘super-Earths’, a few times the mass of the Earth, up to Neptune-sized worlds. It will also identify planets with significant atmospheres which can then be analysed for signs of life by ground-based telescopes, and the next generation of space telescopes now being built, such as the ground-based European Extremely Large Telescope and the NASA/ESA/CSA James Webb Space Telescope.

“By concentrating on specific known exoplanet host stars, Cheops will enable scientists to conduct comparative studies of planets down to the mass of Earth with a precision that simply cannot be achieved from the ground,” said Professor Alvaro Giménez-Cañete, ESA Director of Science and Robotic Exploration.

The plan is for Cheops to be the first of a series of similar small missions, that can be rapidly developed at low cost to investigate new scientific ideas quickly. Cheops will be developed as a partnership between ESA and Switzerland, with a number of other ESA Member States delivering substantial contributions.

Find out more about Cheops here