ESA’s Tough Choice: Dark Matter, Sun Close Flyby, Exoplanets (Pick Two)

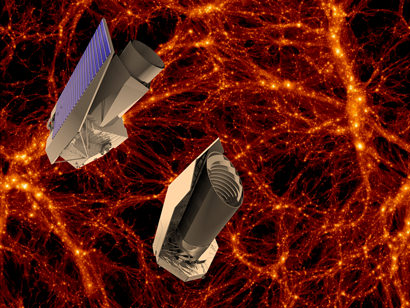
Thales Alenia Space and EADS Astrium concepts for Euclid (ESA)


Key questions relevant to fundamental physics and cosmology, namely the nature of the mysterious dark energy and dark matter (Euclid); the frequency of exoplanets around other stars, including Earth-analogs (PLATO); take the closest look at our Sun yet possible, approaching to just 62 solar radii (Solar Orbiter) … but only two! What would be your picks?

These three mission concepts have been chosen by the European Space Agency’s Science Programme Committee (SPC) as candidates for two medium-class missions to be launched no earlier than 2017. They now enter the definition phase, the next step required before the final decision is taken as to which missions are implemented.

These three missions are the finalists from 52 proposals that were either made or carried forward in 2007. They were whittled down to just six mission proposals in 2008 and sent for industrial assessment. Now that the reports from those studies are in, the missions have been pared down again. “It was a very difficult selection process. All the missions contained very strong science cases,” says Lennart Nordh, Swedish National Space Board and chair of the SPC.

And the tough decisions are not yet over. Only two missions out of three of them: Euclid, PLATO and Solar Orbiter, can be selected for the M-class launch slots. All three missions present challenges that will have to be resolved at the definition phase. A specific challenge, of which the SPC was conscious, is the ability of these missions to fit within the available budget. The final decision about which missions to implement will be taken after the definition activities are completed, which is foreseen to be in mid-2011.
[/caption]
Euclid is an ESA mission to map the geometry of the dark Universe. The mission would investigate the distance-redshift relationship and the evolution of cosmic structures. It would achieve this by measuring shapes and redshifts of galaxies and clusters of galaxies out to redshifts ~2, or equivalently to a look-back time of 10 billion years. It would therefore cover the entire period over which dark energy played a significant role in accelerating the expansion.

By approaching as close as 62 solar radii, Solar Orbiter would view the solar atmosphere with high spatial resolution and combine this with measurements made in-situ. Over the extended mission periods Solar Orbiter would deliver images and data that would cover the polar regions and the side of the Sun not visible from Earth. Solar Orbiter would coordinate its scientific mission with NASA’s Solar Probe Plus within the joint HELEX program (Heliophysics Explorers) to maximize their combined science return.

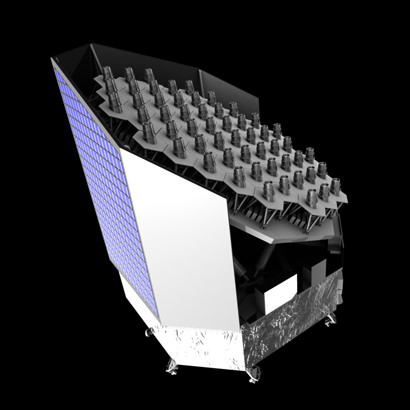
Thales Alenis Space concept, from assessment phase (ESA)

PLATO (PLAnetary Transit and Oscillations of stars) would discover and characterize a large number of close-by exoplanetary systems, with a precision in the determination of mass and radius of 1%.

In addition, the SPC has decided to consider at its next meeting in June, whether to also select a European contribution to the SPICA mission.

SPICA would be an infrared space telescope led by the Japanese Space Agency JAXA. It would provide ‘missing-link’ infrared coverage in the region of the spectrum between that seen by the ESA-NASA Webb telescope and the ground-based ALMA telescope. SPICA would focus on the conditions for planet formation and distant young galaxies.

“These missions continue the European commitment to world-class space science,” says David Southwood, ESA Director of Science and Robotic Exploration, “They demonstrate that ESA’s Cosmic Vision programme is still clearly focused on addressing the most important space science.”

Source: ESA chooses three scientific missions for further study

WISE Spies Its First Comet

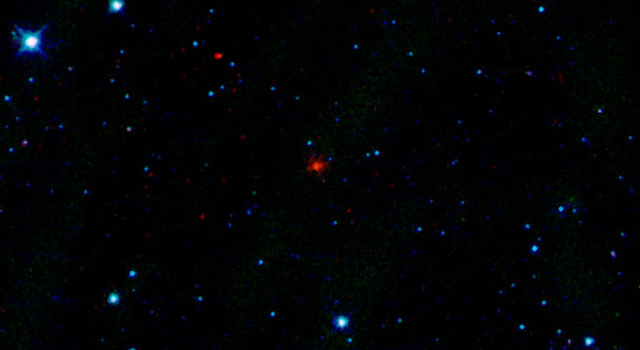
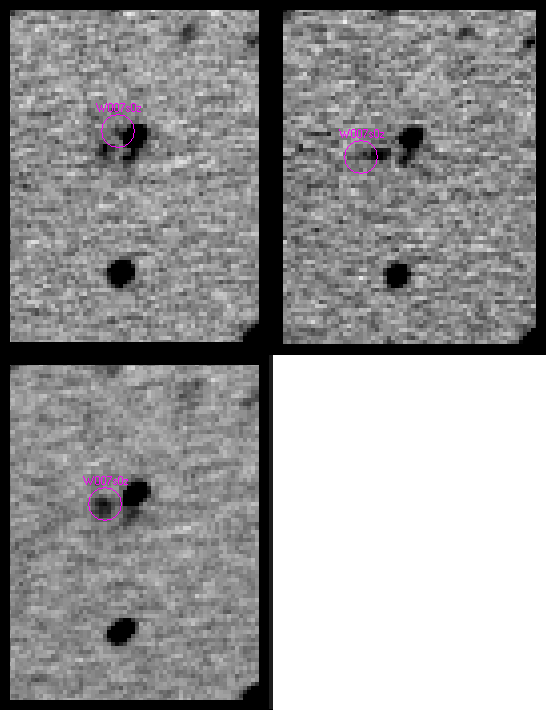
The red smudge at the center of this picture is the first comet discovered by NASA's Wide-Field Infrared Survey Explorer, or WISE. Image credit: NASA/JPL-Caltech/UCLA

[/caption]
The Wide-field Infrared Survey Explorer or WISE is living up to expectations, as it now has discovered its first comet, shortly after finding its first asteroid. The spacecraft, just launched on Dec. 14, 2009 and first spotted the comet on January 22, 2010. WISE is expected to find millions of other objects during its ongoing survey of the whole sky in infrared light. Officially named “P/2010 B2 (WISE),” the comet is a dusty mass of ice more than 2 kilometers (1.2 miles) in diameter.

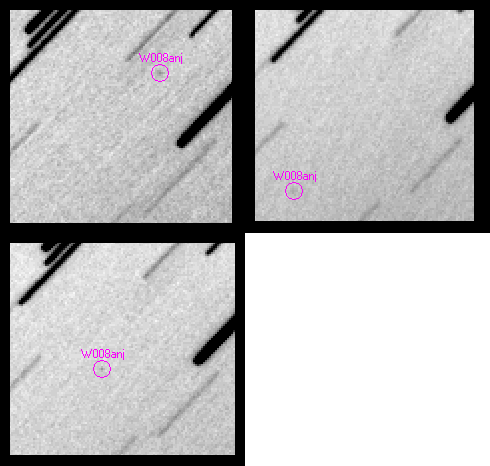
Animation of WISE Comet discovery W007s0z. Confirmation observation by ARO at magnitude 19.7 with observation from ARO found at MPEC 2010-C23. ARO was the first ground base observation of the WISE comet discovery. Credit: Robert Holmes/ARO

Comet and asteroid hunter Robert Holmes, who we have written about previously on Universe Today (whose Astronomical Research Observatory and Killer Asteroid Project in Illinois is not far from where I live) made the first ground-based confirmation of WISE’s comet discovery, with his home-built 0.81-meter telescope. Many large observatories attempted to confirm this discovery more than 7 days earlier including the Faulkes 2.0m telescope in Hawaii, without success. And due to poor weather, Holmes had to wait several days to get a look at the WISE comet himself. Holmes produces images for educational and public outreach programs like the International Astronomical Search Collaboration (IASC), which gives students and teachers the opportunity to make observations and discoveries, and a teacher actually assisted in the confirmation of this new comet.

Astronomers from the WISE team say the comet probably formed around the same time as our solar system, about 4.5 billion years ago. Comet WISE started out in the cold, dark reaches of our solar system, but after a long history of getting knocked around by the gravitational forces of Jupiter, it settled into an orbit much closer to the sun. Right now, the comet is heading away from the sun and is about 175 million kilometers (109 million miles) from Earth.

“Comets are ancient reservoirs of water. They are one of the few places besides Earth in the inner solar system where water is known to exist,” said Amy Mainzer of NASA’s Jet Propulsion Laboratory in Pasadena, Calif. Mainzer is the principal investigator of NEOWISE, a project to find and catalog new asteroids and comets spotted by WISE (the acronym combines WISE with NEO, the shorthand for near-Earth object).

Animation of WISE discovery W008anj confirmation observation by ARO at magnitude 21.4. Credit: Robert Holmes/ARO

“With WISE, we have a powerful tool to find new comets and learn more about the population as a whole,” said Mainzer. “Water is necessary for life as we know it, and comets can tell us more about how much there is in our solar system.”

“It is very unlikely that a comet will hit Earth,” said James Bauer, a scientist at JPL working on the WISE project, “But, in the rare chance that one did, it could be dangerous. The new discoveries from WISE will give us more precise statistics about the probability of such an event, and how powerful an impact it might yield.”

Comet WISE takes 4.7 years to circle the sun, with its farthest point being about 4 astronomical units away, and its closest point being 1.6 astronomical units (near the orbit of Mars). An astronomical unit is the distance between Earth and the sun. Heat from the sun causes gas and dust to blow off the comet, resulting in a dusty coma, or shell, and a tail.

Sources: JPL, Killer Asteroid Project

The Solar Dynamics Observatory Soars to Study the Sun

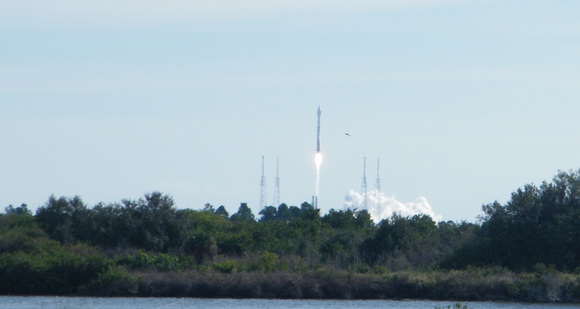
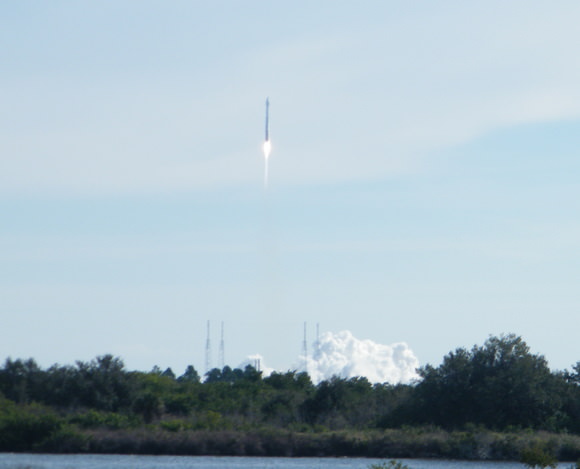
The Atlas V rocket carrying SDO roars off the launchpad. Credit: Nancy Atkinson

The Solar Dynamics Observatory launched successfully – and beautifully – Thursday morning from Cape Canaveral Launch Complex 41 to begin a 5-year mission that will provide streaming, high-definition views of our sun. It was the 100th launch of the Atlas/Centaur combo, and was a gorgeous sight as it roared and soared into the blue Florida sky. “It was great; a beautiful launch,” said Dean Pesnell, SDO Project Scientist, immediately after the launch. “The rocket rises so slowly off the pad — it is wonderful to see. This is third Atlas launch I’ve seen and this is the best one so far.”

Amazingly, viewers here at Kennedy Space Center saw the Atlas rocket fly close to a sundog just as the spacecraft reached Max-Q, creating a ripple effect around the spacecraft. “We saw this sundog come out and SDO flew right through it. Then the sun dog disappeared,” said Pesnell. “This may be the first time we’ve sent a probe through a sundog, and people will be studying this, so already we are learning things about our atmosphere from SDO.”

See this amazing video shot by a 13-year-old girl in attendance at the KSC VIP site that shows the sundog and shockwave. (as noted by Jon Hanford in the comments).

Today’s countdown was extremely smooth as the high winds that thwarted Wednesday’s launch attempt calmed as the opening of the launch window approached. After counting down to the planned T-4 minute hold, launch managers proceeded directly to launch at the beginning of the window at 10:23 a.m. EST.

Project Scientist Dean Pesnell describing the launch. Image: Nancy Atkinson

“I was a little worried about the clouds coming in,” said Tom Woods, Principal Investigator for the EVE instrument on SDO, the EUV Variability Experiment, which will be studying the extreme ultraviolet radiation of the Sun. “But we were very excited to see SDO launch today, as otherwise it would have been a 10-day delay until the next attempt. It was a wonderful launch!”

“It was so beautiful,” said Lika Guhathakurta, SDO program scientist immediately following the launch as we walked together back to the press building. “I can still feel the rumbling in my stomach!”

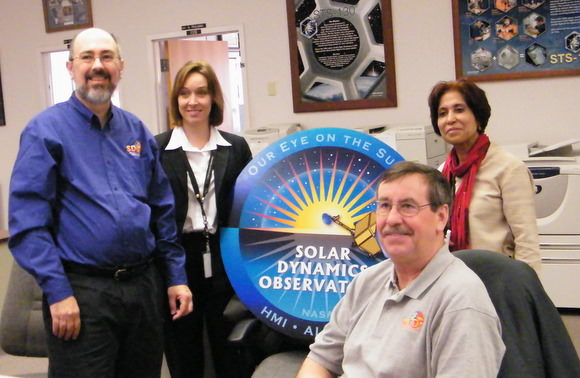
SDO science team celebrates after the launch: Dean Pesnell, Jennifer Rumburg, Chris St. Cyr, and Lika Guhathakurta. Image: Nancy Atkinson

Called the “Crown Jewel” of NASA’s fleet of solar observatories, SDO is a technologically advanced spacecraft that will take images of the sun every 0.75 seconds and daily send back about 1.5 terabytes of data to Earth — the equivalent of downloading 380 full-length movies every day.

SDO launch. Credit: Nancy Atkinson

“We’re going to be able to better understand the Sun as a star,” said Guathakurta, “but SDO will also give us a comprehensive view of how it interacts with the Earth and everything else in the solar system.

The sun’s dynamic processes affect everyone and everything on Earth. SDO will explore activity on the sun that can disable satellites, cause power grid failures, and disrupt GPS communications. SDO also will provide a better understanding of the role the sun plays in Earth’s atmospheric chemistry and climate.

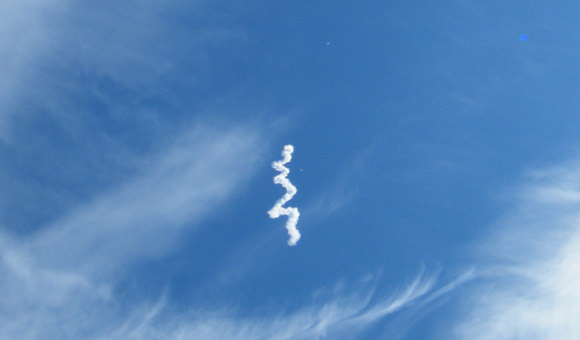
Vapor trail from the Atlas rocket after the SDO launch. Image: Nancy Atkinson

A contrail from the launch appeared only in the region of Earth’s atmosphere where conditions were right for cloud formation. “There weren’t any clouds there, but we provided the very fine particles so that a contrail cloud appeared,” said Pesnell.

A later update confirmed that SDO separated from the Centaur and the spacecraft’s solar arrays deployed on time and correctly, and are now generating power.

Here’s the video of the launch from NASA TV:

Satellite Captures Solar Eclipse from Space

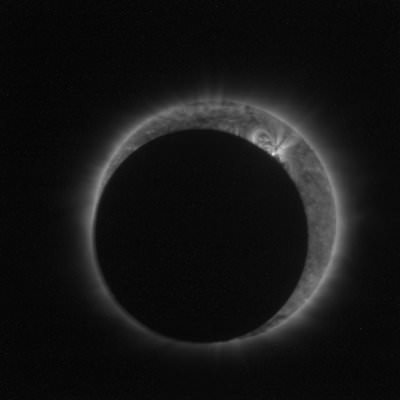
Solar eclipse seen by Proba-2's SWAP instrument. Credit: ESA

[/caption]
The recently launched Proba-2 satellite was able to observe the annular solar eclipse on January 15, 2010, with stunning results. The PRoject for OnBoard Autonomy satellite was launched on November 2, 2009 and is intended to test hardware and software that might be incorporated into future ESA missions. The eclipse offered a unique chance to test out the Sun-imaging instrument, SWAP (Sun Watcher using APS detectors and imaging processing). Another radiometer instrument was also able to take measurements during the eclipse.

Proba-2 is one of the smallest satellites launched. The 0.6m by 0.6m by 0.8m satellite contains several instruments, a computer, battery, thrusters, and solar panel systems.

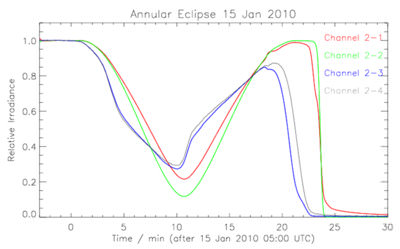
The eclipse was also detected by the Proba-2's LYRA (Lyman Alpha Radiometer) instrument. Credit: ESA

The eclipse was also detected by the Proba-2’s LYRA (Lyman Alpha Radiometer) instrument, the first ultraviolet radiometer in space that employs diamond detectors. LYRA will measure solar flares with an unprecedented rapid time resolution of 0.5 sec. LYRA data will soon be feeding research investigations and space weather forecasts.

Proba-2 was a secondary payload included on the launch of the SMOS mission, the Soil Moisture and Ocean Salinity Earth Explorer.

Source: ESA

Satellites Save the Day (and Lives)

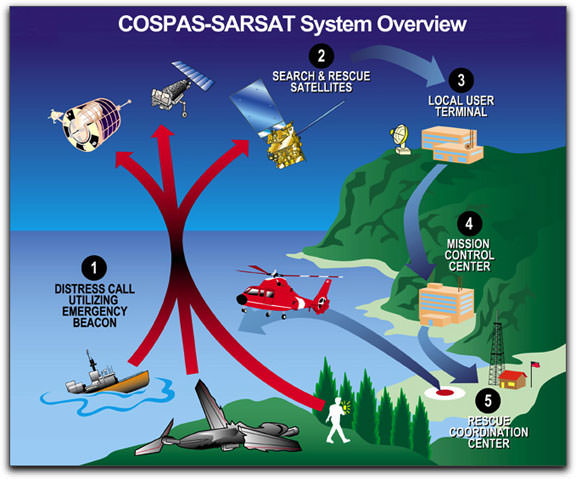
COSPAS-SARSAT satellite system. Credit: NOAA

[/caption]
We all know how satellites make our lives better and easier (television, communications, GPS, weather forecasting, etc) but satellites also directly save people’s lives. In 2009 alone, satellites helped with the rescue of 195 people during life-threatening situations throughout the United States and its surrounding waters. In each incident, a NOAA satellites pinpointed downed pilots, shipwrecked mariners, or stranded hikers by detecting a distress signal from an emergency beacon and relaying the information to first responders on the ground.

NOAA’s polar-orbiting and geostationary satellites, along with Russia’s Cospas spacecraft, are part of the international Search and Rescue Satellite Aided Tracking system, called COSPAS-SARSAT. This system uses a network of satellites to quickly detect and locate distress signals from emergency beacons onboard aircraft and boats, and from smaller, handheld personal locator beacons.

“NOAA satellite weather and ocean data help us detect changes in weather and climate which is critically important to our everyday lives and economy,” said Mary E. Kizca, assistant administrator for NOAA’s Satellite and Information Service. “It’s a little known fact that these valuable instruments also made the difference between life and death for 195 people last year.”

When a NOAA satellite finds the location of a distress signal within the United States or its surrounding waters, the information is relayed to the SARSAT Mission Control Center based at NOAA’s Satellite Operations Facility in Suitland, Md. From there, it is sent to a Rescue Coordination Center, operated by either the U.S. Air Force, for land rescues, or the U.S. Coast Guard, for water rescues.

Now in its 28th year, COSPAS-SARSAT has been credited with supporting more than 27,000 rescues worldwide, including 6,232 in the United States and its surrounding waters. “With each rescue, the system performs the way it was intended – as a real life-saving network,” said Chris O’Connors, program manager for NOAA SARSAT.

Source: SatNews.com

UK’s Big Snowfall, As Seen From Space

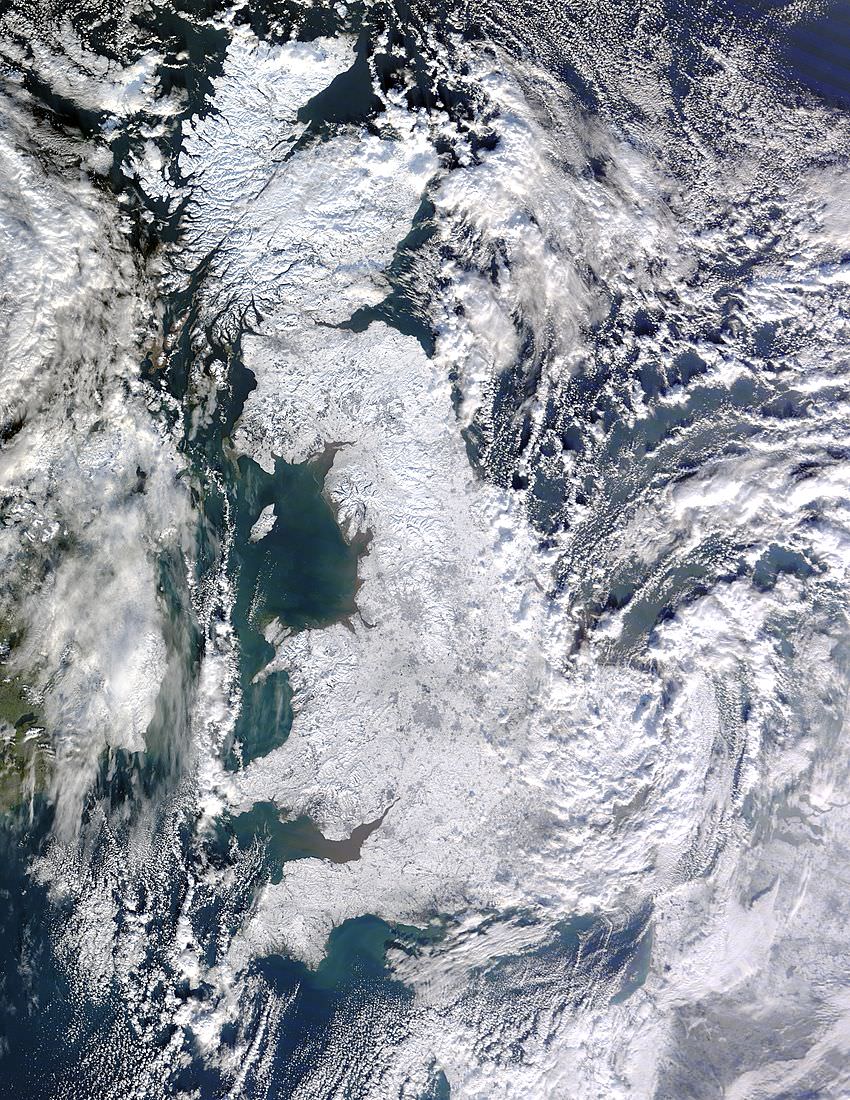
Great Britain, as seen on Jan. 7, 2010 by the Terra Satellies. Credit: NASA

[/caption]
This satellite image taken by NASA’s Terra satellite shows the entire island of Great Britain blanketed by heavy snowfall, with some areas seeing the most snow in 50 years. It looks pretty from space, but frigid temperatures followed snowfall, leaving roads and sidewalks treacherously icy, according to news reports. As of January 7, overnight temperatures had plunged to -18 degrees Celsius (-0.4 degrees Fahrenheit) in isolated spots, with more widespread temperatures of -10 degrees Celsius (14 degrees Fahrenheit). The heavy snowfall downed power lines, leaving several thousand homes in southern England without electricity.

North America is also experiencing heavy snows and cold temperatures. NASA’s Earth Observatory website says that a possible contributor to the persistent cold and snow across much of the Northern Hemisphere’s mid-latitudes in December 2009 and January 2010 could be the fact that the atmosphere was in an extreme negative phase of the Arctic Oscillation (AO). The AO is a seesawing strengthening and weakening of semi-permanent areas of low and high atmospheric pressure in the Arctic and the mid-latitudes. One consequence of the oscillation’s negative phase is cold, snowy weather in Eurasia and North America during the winter months. The extreme negative dip of the Arctic Oscillation Index in December 2009 was the lowest monthly value observed for the past six decades.

Source: Earth Observatory

Surf’s Up! Astronomers Ride Stellar Waves

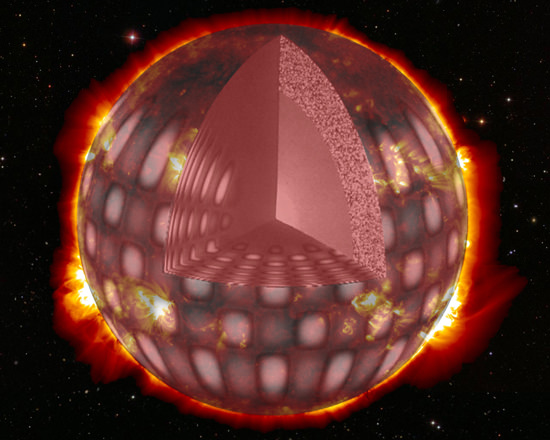
Astronomers peer inside stars by interpreting the waves they create

[/caption]

This week, first results from the Kepler mission are coming out in waves from the meeting of the American Astronomical Society (AAS) in Washington, DC. Carried along on those waves are papers on waves in stars. I’m referring to a branch of astronomy you’ll be hearing more about as Kepler and other missions begin to reveal the interior structures of stars- asteroseismology. So, what is asteroseismology?

Seismology is the study of earthquakes on Earth. But more importantly to our discussion, it is the study of seismic waves. Earthquakes produce different types of seismic waves that travel through different layers of rock, providing us with a way to image structures deep within the Earth. Essentially, large earthquakes provide us with a natural sonogram to look inside the Earth, far deeper then we can tunnel or drill. Since these waves propagate all the way from one side of the planet to the other we can look all the way to the center of the Earth. This is how we know the outer core of the Earth is liquid, and the relative dimensions and densities of the other parts of the Earth’s internal and surface structure.

Copyright Nick Strobel http://www.astronomynotes.com/

Asteroseismology, also known as stellar seismology, gives us the same kind of insight into the structure of stars. By studying the oscillations in pulsating stars, astronomers can peer into the very hearts of stars, one of the most difficult places to observe in the entire universe. The reason stellar interiors can be probed from oscillations is that different oscillation modes penetrate to different depths inside the star. Combining the rate, and amplitude of pulsation with other information, such as spectra, which reveals what the composition of the star is we obtain information on the internal structure of stars.

Stellar oscillation modes are divided into three categories, based on the force that drives them: acoustic, gravity, and surface-gravity wave modes. p-mode, or acoustic waves, have pressure as their force, hence the name “p-mode”. These waves can tell us things about the structure and density of regions below the surface of a star. g-mode, or gravity waves, are confined to the interior of the star. f-mode, or surface gravity waves are also gravity waves, but occur at or near the outer layers of stars, so they give us information about the surface conditions of stars.

Helioseismology is the study of the propagation of wave oscillations in the Sun. Since the Sun is the closest star to us, it is much easier to study its pulsations in greater detail. By interpreting solar oscillations we can even detect sunspots on the far side of the Sun before they rotate into view. Many of our models of stellar interiors are based on information gained through studying the Sun’s oscillations. But the Sun is only one star at one point in its evolution, so to really understand stars we need to observe many more stars of different size, mass, composition and age.

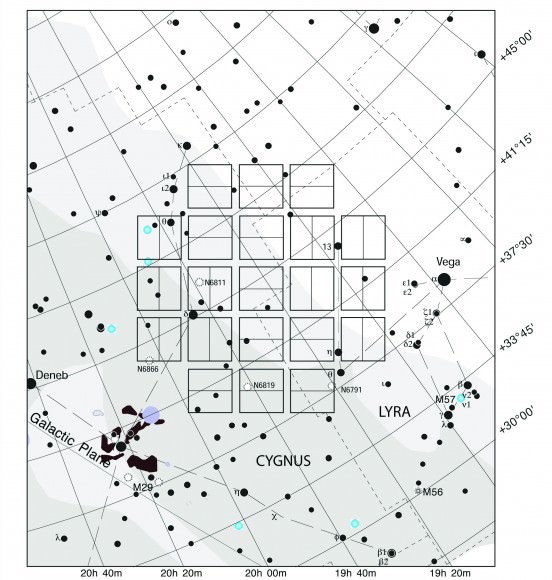
Kepler stares at a portion of the sky taking hi-precision photometric data

That is precisely what Kepler is doing right now. The satellite is staring at a 100 square degree section of the sky between Cygnus and Lyra continuously taking data on the brightness of over 150,000 stars for the next three to five years. While Kepler’s primary mission is to discover the existence and abundance of earth-like planets around stars, all this high precision photometry will be used for other science, especially studying variable stars of all types and performing asteroseismology on stars showing solar-like oscillations.

The much-anticipated release of the first science results from the Kepler mission January 4th, included numerous papers on asteroseismology and the potential for understanding stellar structure in unprecedented detail. Astronomers are riding the new wave of information on wave propagation in stars. Surf’s up!

Further reading:

The asteroseismic potential of Kepler: first results for solar-type stars
W. J. Chaplin, T. Appourchaux, Y. Elsworth, et al
http://arxiv.org/abs/1001.0506

Solar-like oscillations in low-luminosity red giants: first results from Kepler
T. R. Bedding, D. Huber, D. Stello, et al
http://arxiv.org/abs/1001.0229

Kepler Asteroseismology Program: Introduction and First Results
Ronald L. Gilliland, T. M. Brown, J. Christensen-Dalsgaard
http://arxiv.org/abs/1001.0139

WISE Launches to Begin All-Sky Survey (Video)

WISE launch. Image Credit: Bill Hartenstein/United Launch Alliance

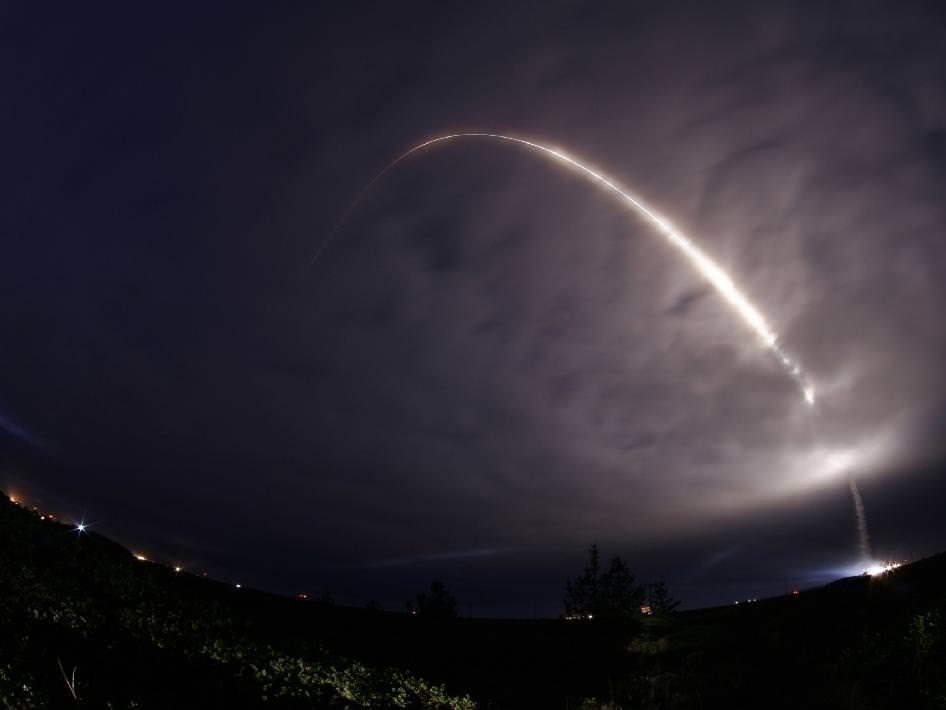
NASA’s Wide-field Infrared Survey Explorer, or WISE, successfully lifted off this morning on its way to map the entire sky in infrared light. A Delta II rocket carrying the spacecraft launched at 6:09 a.m. PST (9:09 a.m. EST) from Vandenberg Air Force Base in California. WISE quickly began transmitting data – just 10 seconds after spacecraft separation — and all through the events that lead to bringing the satellite into a polar orbit 326 miles above Earth.

[/caption]

“WISE thundered overhead, lighting up the pre-dawn skies,” said William Irace, the mission’s project manager at NASA’s Jet Propulsion Laboratory in Pasadena, Calif. “All systems are looking good, and we are on our way to seeing the entire infrared sky better than ever before.”

Because the instrument sees the infrared, or heat, signatures of objects, it must be kept at chilly temperatures. Its coldest detectors are less than minus 447 degrees Fahrenheit.

“WISE needs to be colder than the objects it’s observing,” said Ned Wright of UCLA, the mission’s principal investigator. “Now we’re ready to see the infrared glow from hundreds of thousands of asteroids, and hundreds of millions of stars and galaxies.”

With the spacecraft stable, cold and communicating with mission controllers at JPL, a month-long checkout and calibration is underway.

WISE will see the infrared colors of the whole sky with sensitivity and resolution far better than the last infrared sky survey, performed 26 years ago. The space telescope will spend nine months scanning the sky once, then one-half the sky a second time. The primary mission will end when WISE’s frozen hydrogen runs out, about 10 months after launch.

WISE will catalog a variety of astronomical targets. Near-Earth asteroids, stars, planet-forming disks and distant galaxies all will be easy for the mission to see. Hundreds of millions of objects will populate the WISE atlas, providing astronomers and other space missions, such as NASA’s planned James Webb Space Telescope, with a long-lasting infrared roadmap.

Source: NASA

Two ESA Satellites Launch Successfully

UPDATE: Information about both SMOS and the Proba-2 satelite are on ESA Television. The program loop is embedded at the bottom of this post. Enjoy!

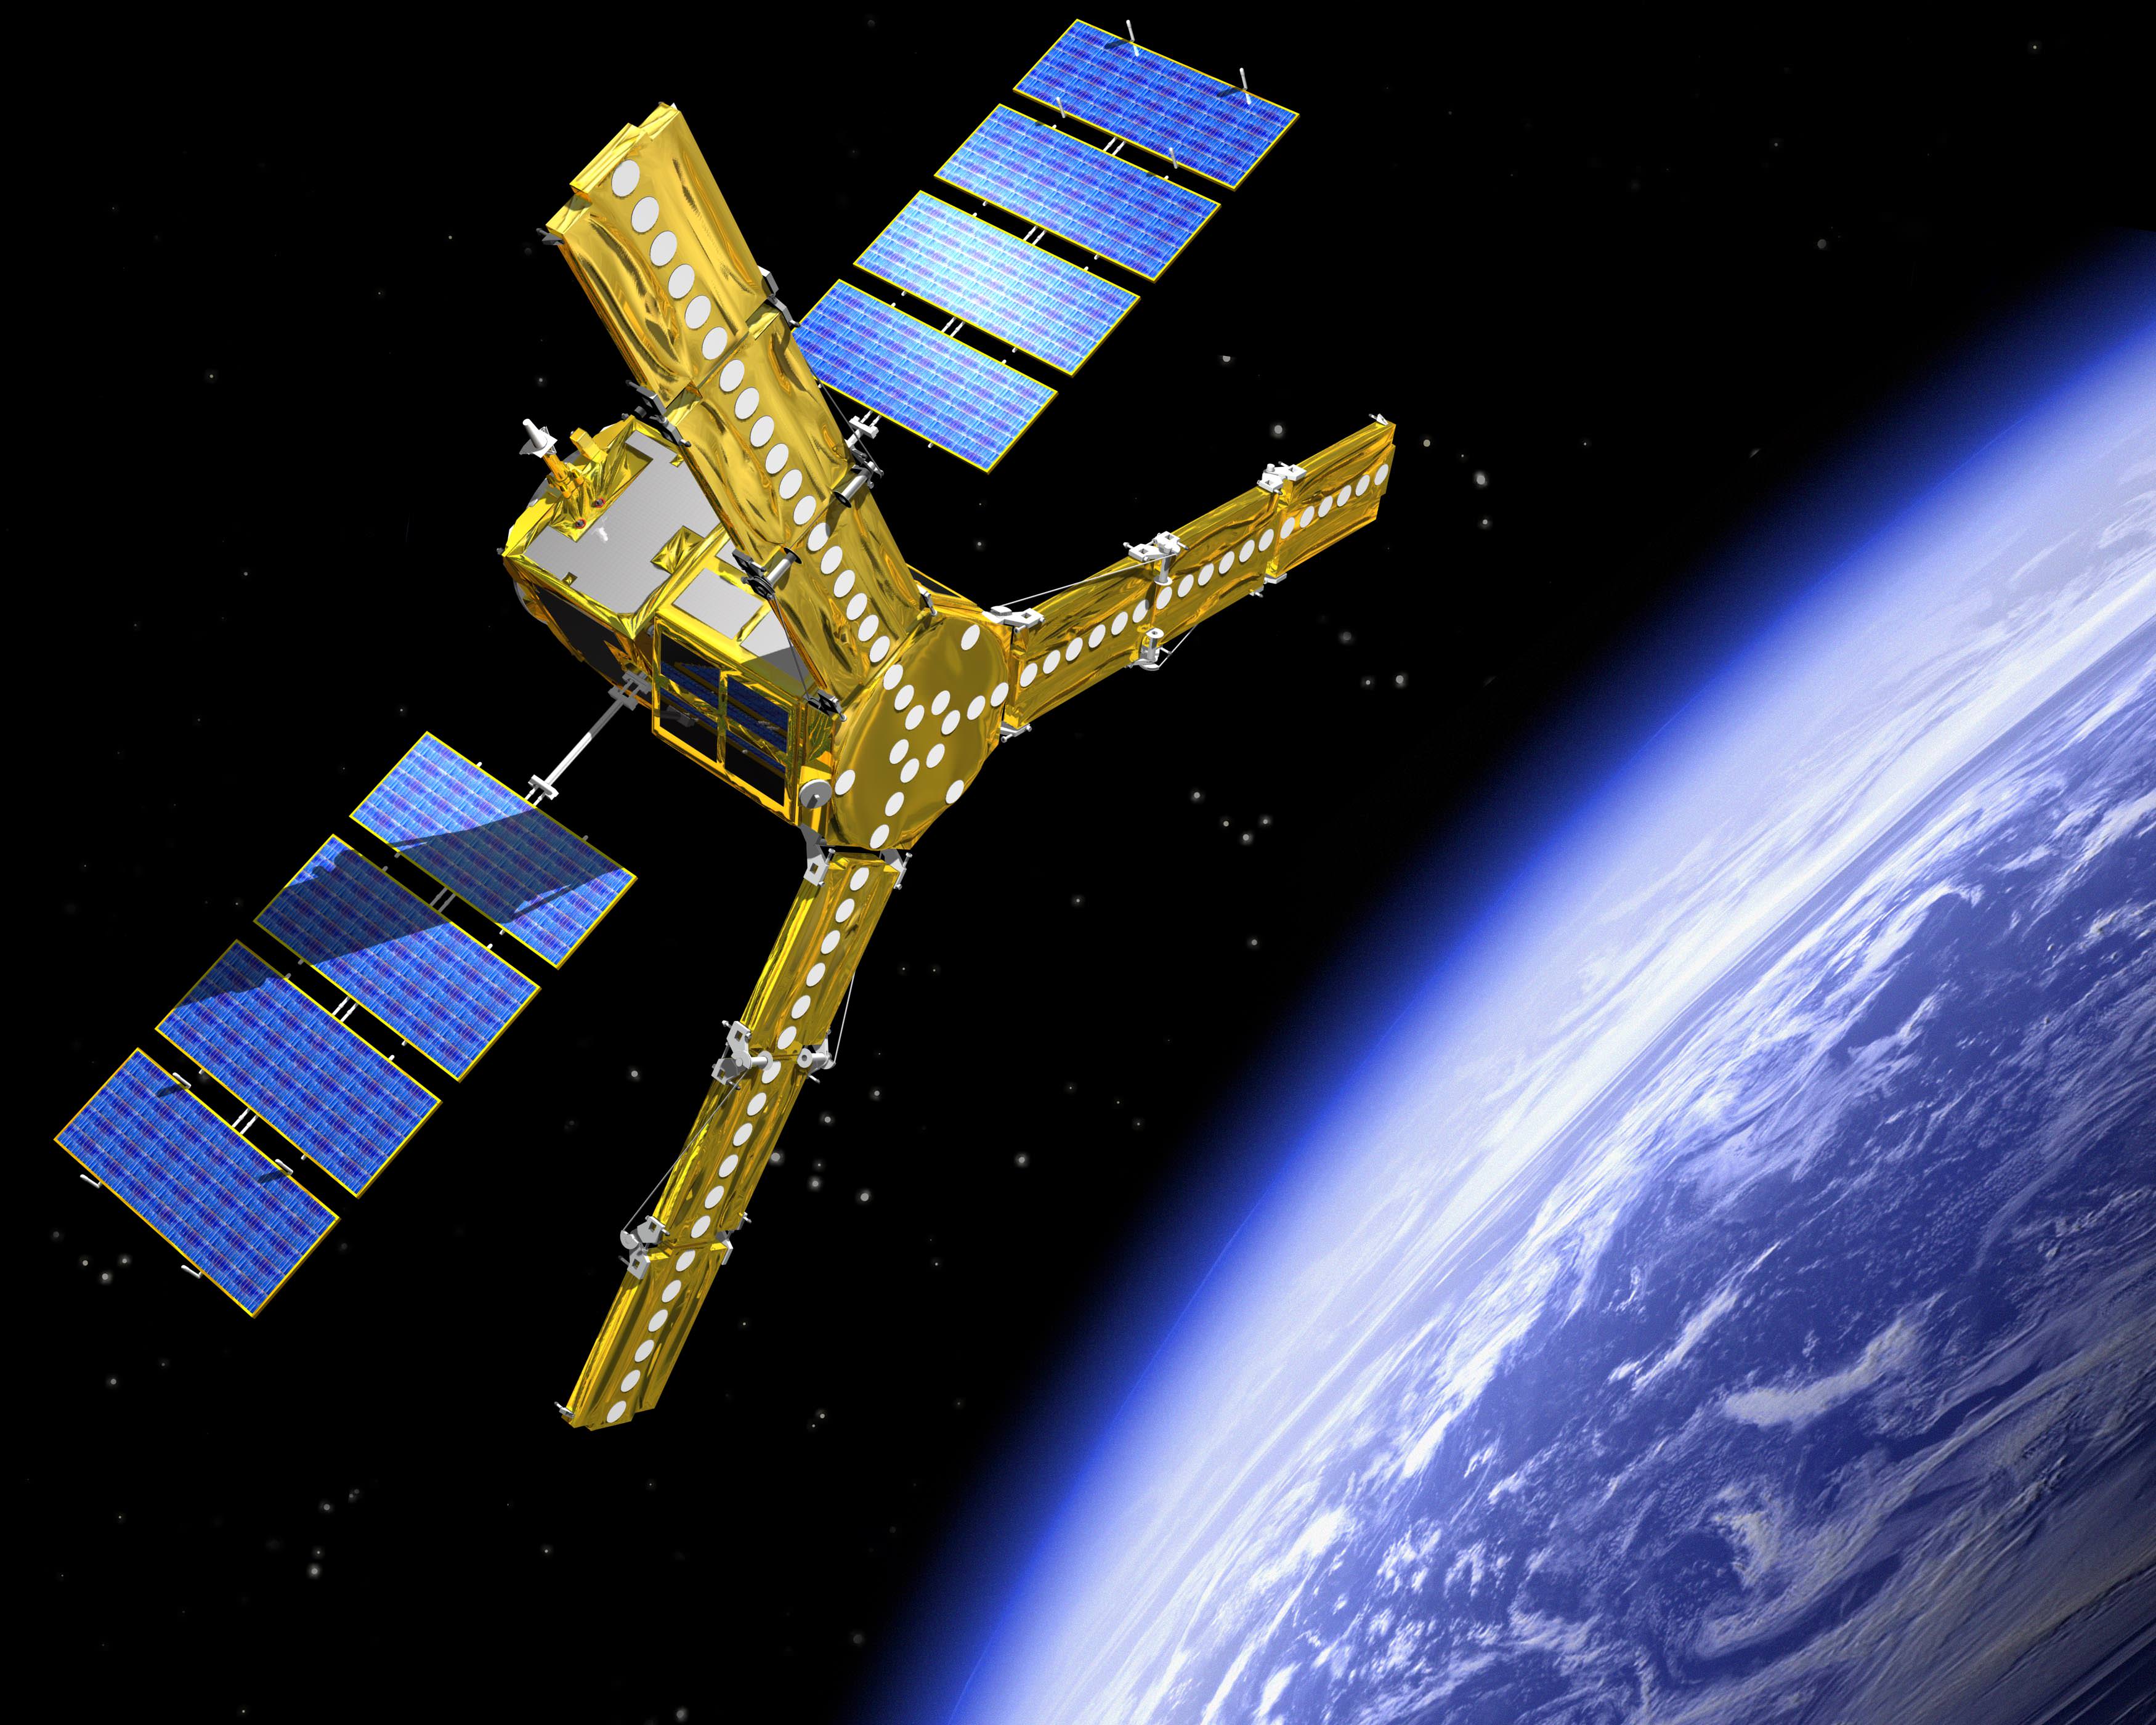
Last night at 2:50 am Central European Time, two European Space Agency (ESA) satellites were successfully launched from the Plesetsk Cosmodrome in Northern Russia. The Rockot launch vehicle was carrying both the Soil Moisture and Ocean Salinity (SMOS) satellite, and the Proba-2 satellite. SMOS will monitor the moisture exchange of the Earth between the ocean, air and land as well as the salinity of the oceans and the moisture of the soil in an effort to better understand how these factors influence the climate of our planet. Proba-2 will test out various instruments, including a small wide angle optical camera, and instruments for monitoring the plasma environment in orbit and the Sun’s corona.

SMOS is part of the ESA’s Earth Observation Envelope Program, an initiative to study in scientific detail from space the ongoing changes of the Earth. The GOCE satellite launched earlier this year to study the Earth’s gravity field and ocean circulation is another part of this program.

SMOS is the first satellite designed with the intent of measuring ocean salinity from space. To do this, it will implement a multi-part microwave antenna to monitor the oceans at a wavelength of about 23cm. At this frequency, an antenna of 5-10 meters (15-30 feet) is needed to make the measurements. This is too large to fit into a standard rocket payload bay, so the mission engineers employed what is called ‘synthetic aperture synthesis’. This is a technique used in radio astronomy that strings together separate antennae in different places, allowing the antennae to act as one larger antenna. A perfect example of this is the Very Large Array in New Mexico. The SMOS antenna has three foldable arms that are 3 meters (6 feet) long apiece, and extend to form a Y shape. Along the arms are 69 small antennae that all act together to take measurements as if they were one larger antenna.

Volker Liebig, ESA’s Director of Earth Observation Programs said in an ESA press release:

“The data collected by SMOS will complement measurements already performed on the ground and at sea to monitor water exchanges on a global scale. Since these exchanges – most of which occur in remote areas – directly affect the weather, they are of paramount importance to meteorologists. Moreover, salinity is one of the drivers for the Thermohaline Circulation, the large network of currents that steers heat exchanges within the oceans on a global scale, and its survey has long been awaited by climatologists who try to predict the long-term effects of today’s climate change.”

The Proba-2 satellite is the second in a series of ESA missions to test out new technologies in space. Image Credit:ESAThe other satellite piggybacking on the SMOS mission launch is the suitcase-sized Proba-2, part of  a series of missions in the ESA’s General Support Technology Program to test out new technology in space for further development on other ESA missions. Proba-2 is carrying a digital sun sensor, a high-precision magnetometer, and dual frequency GPS space receiver among other instruments for a Belgian study of solar physics and Czech study of plasma physics.

Both satellites arrived in their sun-synchronous orbits, and initial systems checks indicate that both are operating as expected. SMOS will orbit at 760 km (472 miles) above the Earth, and Proba-2 at 725 km (450 miles). SMOS, once calibrated, will reach full operational status in about six months, and Proba-2 will become fully operation in two months.

Source: ESA, Eurekalert

NASA 3-D Map Shows Flooding Rains of Typhoon Ketsana

Data from NASA's TRMM satellite was used to create an enhanced 3-D topographic rainfall map of Ketsana's flooding rains received in the Philippines. The dark yellow and orange areas indicate 375 mm (~15 inches) to over 475 mm (~19 inches), respectively. The red area over Manila indicates almost 2 feet of rain fell. Credit: SSAI/NASA, Hal Pierce

[/caption]
Data from the Tropical Rainfall Measuring Mission or TRMM satellite has been used to create a 3-D map of rainfall over the Phillipines from September 21-28, 2008. Armed with both a passive microwave sensor and a space-borne precipitation radar, TRMM has been measuring the amount of rainfall created by the tropical cyclone, Typhoon Ketsana (known in the Phillippines as “Ondoy”). A record 13.43 inches of rain fell in Manila in six hours between 8 a.m. and 2 p.m. local time, which is equivalent to about a month’s worth of rain for the area. In just 24 hours, Ketsana dropped 17.9 inches (455 mm) of rain in Manila in just 24 hours on Saturday, September 26.

The TRMM-based, near-real time Multi-satellite Precipitation Analysis (TMPA) at the NASA Goddard Space Flight Center, Greenbelt, Md. is used to monitor rainfall over the global Tropics. TMPA rainfall totals for the 7-day period 21 to 28 September 2009 for the northern Philippines and the surrounding region showed that the highest rainfall totals occurred south of the storm’s track in an east-west band over central Luzon that includes Manila. Amounts in this region are on the order of 375 mm (~15 inches) to over 475 mm (~19 inches). The highest recorded amount from the TMPA near Manila was 585.5 mm (almost 24 inches).

Ketsana maintained minimal tropical storm intensity as it crossed central Luzon on the afternoon of September 26 (local time). The main deluge in the Manila area, located on the western side of Luzon, began around 8:00 a.m. local time even though the center of Ketsana had yet to make landfall on the eastern side of the island.

Click here to watch an animation of the TRMM satellite data.

The enhanced rainfall over on the Manila-side of the island as the storm approached was because of an interaction between Ketsana’s circulation and the seasonal southwest monsoon.

On-the-ground photos of the devastation Ketsana’s rains caused can been seen at the Boston Globe’s Big Picture.

More info about TRMM.
Source: NASA