NASA 3-D Map Shows Flooding Rains of Typhoon Ketsana

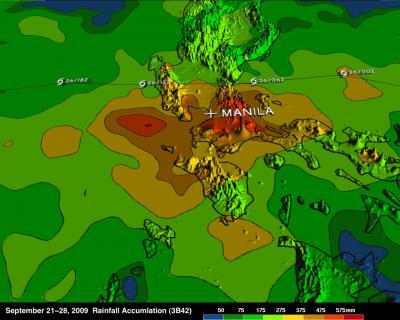
Data from NASA's TRMM satellite was used to create an enhanced 3-D topographic rainfall map of Ketsana's flooding rains received in the Philippines. The dark yellow and orange areas indicate 375 mm (~15 inches) to over 475 mm (~19 inches), respectively. The red area over Manila indicates almost 2 feet of rain fell. Credit: SSAI/NASA, Hal Pierce

[/caption]
Data from the Tropical Rainfall Measuring Mission or TRMM satellite has been used to create a 3-D map of rainfall over the Phillipines from September 21-28, 2008. Armed with both a passive microwave sensor and a space-borne precipitation radar, TRMM has been measuring the amount of rainfall created by the tropical cyclone, Typhoon Ketsana (known in the Phillippines as “Ondoy”). A record 13.43 inches of rain fell in Manila in six hours between 8 a.m. and 2 p.m. local time, which is equivalent to about a month’s worth of rain for the area. In just 24 hours, Ketsana dropped 17.9 inches (455 mm) of rain in Manila in just 24 hours on Saturday, September 26.

The TRMM-based, near-real time Multi-satellite Precipitation Analysis (TMPA) at the NASA Goddard Space Flight Center, Greenbelt, Md. is used to monitor rainfall over the global Tropics. TMPA rainfall totals for the 7-day period 21 to 28 September 2009 for the northern Philippines and the surrounding region showed that the highest rainfall totals occurred south of the storm’s track in an east-west band over central Luzon that includes Manila. Amounts in this region are on the order of 375 mm (~15 inches) to over 475 mm (~19 inches). The highest recorded amount from the TMPA near Manila was 585.5 mm (almost 24 inches).

Ketsana maintained minimal tropical storm intensity as it crossed central Luzon on the afternoon of September 26 (local time). The main deluge in the Manila area, located on the western side of Luzon, began around 8:00 a.m. local time even though the center of Ketsana had yet to make landfall on the eastern side of the island.

Click here to watch an animation of the TRMM satellite data.

The enhanced rainfall over on the Manila-side of the island as the storm approached was because of an interaction between Ketsana’s circulation and the seasonal southwest monsoon.

On-the-ground photos of the devastation Ketsana’s rains caused can been seen at the Boston Globe’s Big Picture.

More info about TRMM.
Source: NASA

GOCE Satellite Begins Mapping Earth’s Gravity in Lower Orbit Than Expected

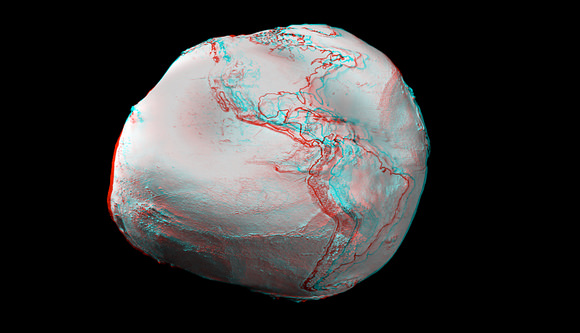
Anaglyph images created from an ESA video animation of global gravity gradients. A more accurate global map will be generated by ESA's GOCE craft. Credit: ESA and Nathaniel Burton Bradford.

[/caption]
Is Earth’s gravity field as intriguing and misshapen as this image above? We’re about to find out. The sexy looking Gravity field and steady-state Ocean Circulation Explorer or GOCE satellite has completed its calibration and is now in its science orbit to map the tiny variations of Earth’s gravity in unprecedented detail. And it turns out the sun’s current period of low solar activity has a side benefit for the GOCE mission. Less solar activity means a calmer environment for GOCE in its low Earth orbit, so its current orbit of 255 km is a few kilometers lower than engineers had originally planned. This is good news – the gravity measurements being made at the moment will be even more accurate.

“The completion of the commissioning and first in-flight calibration marks an important milestone for the mission, ” said Rune Floberghagen, ESA’s GOCE Mission Manager. “We are now entering science operations and are looking forward to receiving and processing excellent three-dimensional information on the structure of Earth’s gravity field.”

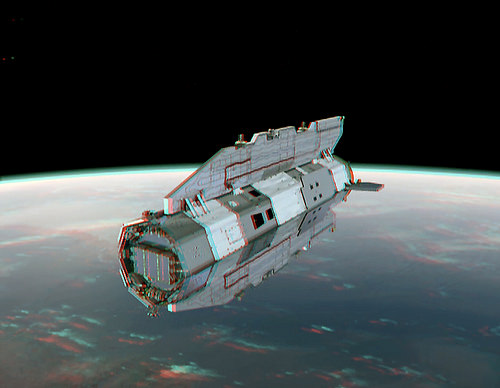
Anaglyph created from an ESA GOCE craft animation. Credit:  ESA and Nathanial Burton Bradford
Anaglyph created from an ESA GOCE craft animation. Credit: ESA and Nathanial Burton Bradford

Gravity is stronger closer to Earth, so GOCE was designed to orbit as low as possible while remaining stable as it flies through the fringes of our atmosphere. GOCE’s sleek aerodynamic design helps this the satellite to cut though the tenuous fringes of Earth’s atmosphere at this low altitude. Moreover, the electric ion thruster at the back continuously generates tiny forces to compensate for any drag that GOCE experiences along its orbit.

To help avoid drag and ensure that the gravity measurements are of true gravity, the satellite has to be kept stable in ‘free fall’. Any buffeting from residual air at this low altitude could potentially drown out the gravity data.

Space gradiometry and the use of the sophisticated electric propulsion are both ‘firsts’ in satellite technology, so the commissioning and calibration were particularly important for the success of the mission. This phase was completed in the summer, ready for the tricky task of bringing GOCE down to its operational altitude, which took a couple of months.

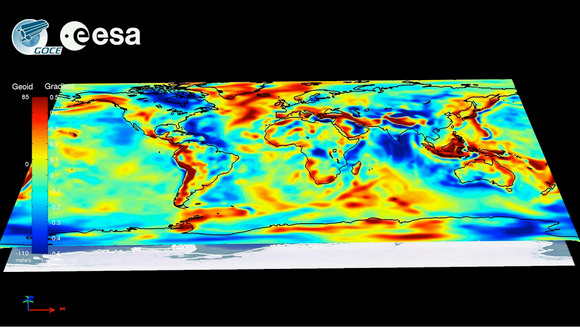
Worldwide gravity gradients from simulations. GOCE is now gathering data such as shown here to map Earth's gravity with unprecedented accuracy and spatial resolution. Credit:  ESA
Worldwide gravity gradients from simulations. GOCE is now gathering data such as shown here to map Earth's gravity with unprecedented accuracy and spatial resolution. Credit: ESA

Over two six-month uninterrupted periods, GOCE will map these subtle variations with extreme detail and accuracy. This will result in a unique model of the ‘geoid’ – the surface of an ideal global ocean at rest.

A precise knowledge of the geoid is crucial for accurate measurement of ocean circulation and sea-level change, both of which are influenced by climate. The data from GOCE are also much-needed to understand the processes occurring inside Earth. In addition, by providing a global reference to compare heights anywhere in the world, the GOCE-derived geoid will be used for practical applications in areas such as surveying and leveling.

Stay tuned for some unique data about our home planet from GOCE.

Thanks to Nathanial Burton-Bradford for the terrific anaglyphs he created from a GOCE animation. See more of Nathanial’s images on his Flickr page.

Source: ESA

Best Ever View of Andromeda in Ultraviolet

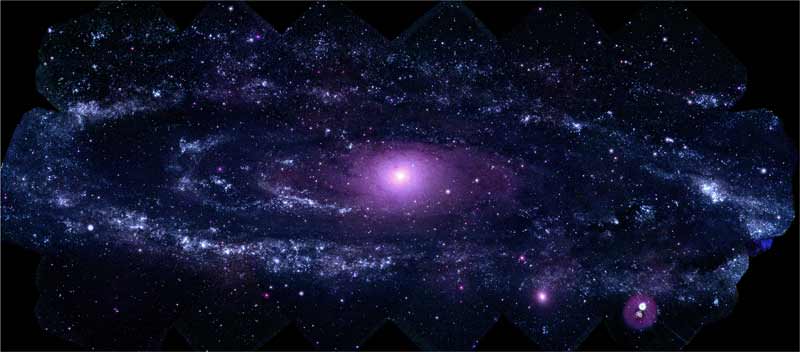
Andromeda by the Swift Telescope. Credit: NASA/Swift/Stefan Immler (GSFC) and Erin Grand (UMCP)

[/caption]
Normally, the Swift satellite is searching for distant cosmic explosions. But recently it took some time to take a long look (total exposure time: 24 hours) with its ultraviolet eyes at the Andromeda galaxy, a.k.a. M31. The result is this gorgeous image. “Swift reveals about 20,000 ultraviolet sources in M31, especially hot, young stars and dense star clusters,” said Stefan Immler, a research scientist on the Swift team at NASA’s Goddard Space Flight Center. “Of particular importance is that we have covered the galaxy in three ultraviolet filters. That will let us study M31’s star-formation processes in much greater detail than previously possible.”

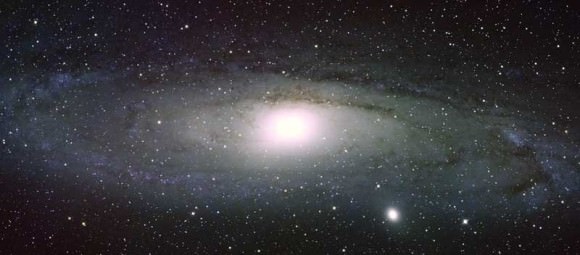
Compare this image to an optical version taken by a ground-based telescope:

Andromeda.  Credit: Bill Schoening, Vanessa Harvey/REU program/NOAO/AURA/NSF
Andromeda. Credit: Bill Schoening, Vanessa Harvey/REU program/NOAO/AURA/NSF

M31, also known as the Andromeda Galaxy, is more than 220,000 light-years across and lies 2.5 million light-years away. On a clear, dark night, the galaxy is faintly visible as a misty patch to the naked eye.

Between May 25 and July 26, 2008, Swift’s Ultraviolet/Optical Telescope (UVOT) acquired 330 images of M31 at wavelengths of 192.8, 224.6, and 260 nanometers.

“Swift is surveying nearby galaxies like M31 so astronomers can better understand star- formation conditions and relate them to conditions in the distant galaxies where we see gamma-ray bursts occurring,” said Neil Gehrels, the mission’s principal investigator. Since Swift’s November 2005 launch, the satellite has detected more than 400 gamma-ray bursts — massive, far-off explosions likely associated with the births of black holes.

For more info on this image see this page from NASA. There’s also a podcast from Swift about this image, as well.

Earth From Space: Plankton Bloom

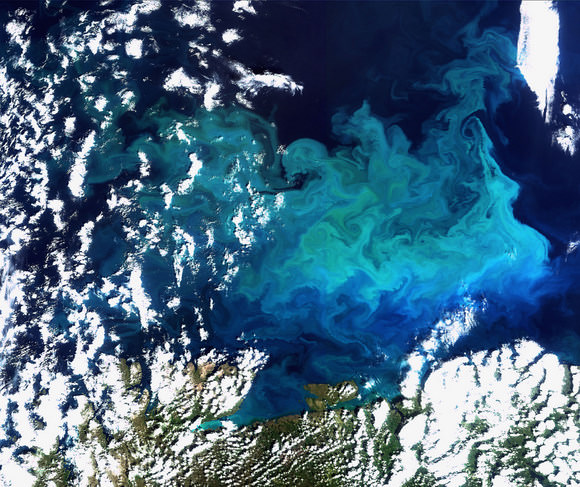
This Envisat image captures a plankton bloom in the Barents Sea. Credit: ESA

[/caption]
What a gorgeous shot of our blue planet! This Envisat satellite image taken on August 19, 2009 captures a plankton bloom larger than the country of Greece stretching across the Barents Sea off the tip of northern Europe. The land visible across the bottom of the image belongs to Norway (left) and Russia’s Murmansk Oblast.

Plankton, the most abundant type of life found in the ocean, are microscopic marine plants that drift on or near the surface of the sea. Microscopic plankton have been called ‘the grass of the sea’ because they are the basic food on which all other marine life depends.

The colorful blossoming bloom in the Barents Sea, a rather deep shelf sea with an average depth around 230 m, is approximately 136,000 sq km. In comparison, Greece has a land area of 131,940 sq km.

For more about this image, see this page from ESA.

South Korea Launches Rocket; Satellite Fails to Reach Its Orbit


South Korea successfully launched its first rocket on Tuesday, but the satellite payload failed to reach its designated orbit, officials said. The rocket, a two-stage rocket, called the Naro lifted off on schedule at 5:00 pm local time, (0800 GMT). The first stage separated successfully less than five minutes after lift-off and the South Korean-built 100-kilogram (220-pound) scientific research satellite was placed into Earth orbit. But science and technology minister Ahn Byong-Man said it was not following the designated orbit, hampering communications with mission control. “All aspects of the launch were normal, but the satellite exceeded its planned orbit and reached an altitude of 360 kilometres (225 miles),” Ahn said.
Continue reading “South Korea Launches Rocket; Satellite Fails to Reach Its Orbit”

Launch Your Own Personal Satellite for $8,000 USD

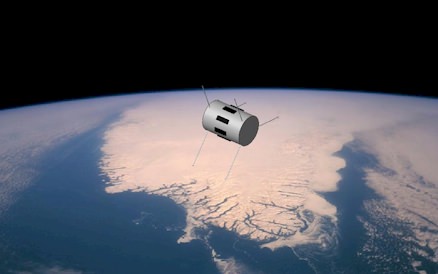
A TubeSat. Credit: InterOrbital.com

[/caption]
Want to launch something into space? You can now do just that for only $8,000 USD. The rocket company Interorbital Services (IOS) is offering their “TubeSat Personal Satellite Kit” that can carry 0.75-kg into orbit. The price includes a launch into low Earth orbit on an IOS NEPTUNE 30 launch vehicle to 310 kilometers (192 miles) above the Earth. TubeSats are designed to be orbit-friendly, and not contribute to orbital debris by being in a self-decaying orbit. Launches are expected to begin in the fourth quarter of 2010.

Interorbital says a TubeSat is designed to function as a basic satellite bus or as a simple stand-alone satellite. Each TubeSat kit includes the satellite’s structural components, safety hardware, solar panels, batteries, power management hardware and software, transceiver, antennas, microcomputer, and the required programming tools. With these components alone, the builder can construct a satellite that puts out enough power to be picked up on the ground by a hand-held HAM radio receiver. Simple applications include broadcasting a repeating message from orbit or programming the satellite to function as a private orbital HAM radio relay station. These are just two examples. The TubeSat also allows the builder to add his or her own experiment or function to the basic TubeSat kit.

Possible experiments include Earth imagery, measuring the orbital environment, tracking something like migratory animals, testing hardware or software in the space environment, or doing on-orbit advertising.

There are two different payment options. If you pay the full cost upfront, you will be placed immediately placed on a launch manifest according to the order in which the payment was received. If you pay half the cost upfront, and then pay the other half of the cost at a later date, you will be placed on a launch manifest according to the time when full payment is received.

Good news: Interorbital takes Paypal.

Find out more at Interorbital’s TubeSat page.

The Grand Canyon From Space

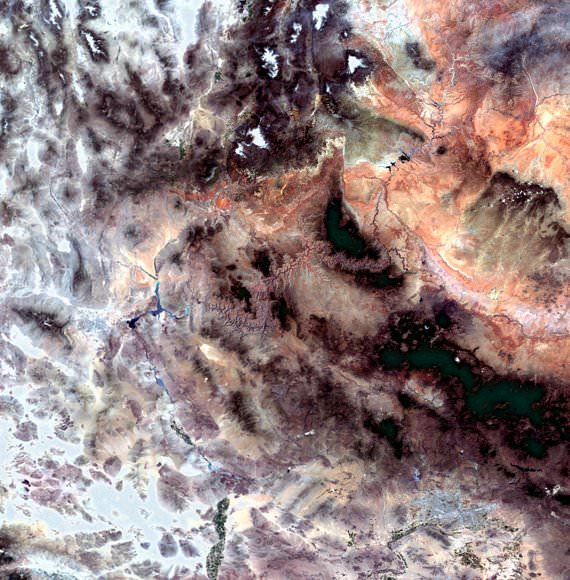
Grand Canyon from space. Click for larger version. Credit: ESA

[/caption]
The Grand Canyon is an awesome sight on Earth — one of the seven natural wonders of the world – and it looks breathtaking from space, too. This image was taken by the Envisat satellite, showing canyon walls, rock structures, old lava flows, buttes, ravines, stair-step topography in hues of pink, violet and gray.

Also visible in the image are the Colorado Plateau (upper right corner), the Mogollon Plateau (dark area under Colorado Plateau), Lake Meade (Y-shaped water body left of the canyon), Las Vegas, Nevada (bright white and blue area left of Lake Meade) and the southern tip of Utah (upper left).

Although a number of processes combined to create the Grand Canyon, it was formed primarily by the eroding action of the Colorado River that began about six million years ago. Other contributing factors include volcanism, continental drift and the semiarid climate.

As water erosion sculpted this majestic showplace, it revealed layers and layers of exposed rocks that provide us with a profound record of geologic events. As some of Earth’s oldest rock lies at the bottom of the canyon, it is said to be 1800 meters and a billion years deep. It is about 443 km long and 8 to 29 km wide.

This image was acquired by Envisat’s Medium Resolution Imaging Spectrometer (MERIS) instrument on 10 May 2009, working in Full Resolution mode to provide a spatial resolution of 300 meters.

Source: ESA

NASA, Japan Release Most Complete Topographic Map of Earth

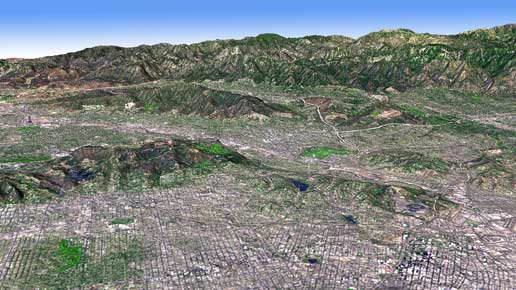
In this perspective view, the new topographic maps show the LA Basin. Credit: NASA, MET

[/caption]

Topographic maps are some of the most used and valuable maps for both government and the general public. Now, NASA and Japan have released a new digital topographic map of Earth Monday that covers more of our planet than ever before and was created from nearly 1.3 million individual stereo-pair images collected by the Japanese Advanced Spaceborne Thermal Emission and Reflection Radiometer, or ASTER, on board NASA’s Terra spacecraft. It is available online to users everywhere at no cost.

“This is the most complete, consistent global digital elevation data yet made available to the world,” said Woody Turner, ASTER program scientist at NASA Headquarters in Washington. “This unique global set of data will serve users and researchers from a wide array of disciplines that need elevation and terrain information.”
ASTER is one of five Earth-observing instruments launched on Terra in December 1999. ASTER acquires images from the visible to the thermal infrared wavelength region, with spatial resolutions ranging from about 50 to 300 feet.

According to Mike Abrams, ASTER science team leader at JPL the new topographic information will be of value throughout the Earth sciences and has many practical applications. “ASTER’s accurate topographic data will be used for engineering, energy exploration, conserving natural resources, environmental management, public works design, firefighting, recreation, geology and city planning, to name just a few areas,” Abrams said.

Click here for visualizations of the new ASTER topographic data.

Click here to download the ASTER global digital elevation model.

NASA and Japan’s Ministry of Economy, Trade and Industry, known as METI, developed the data set.

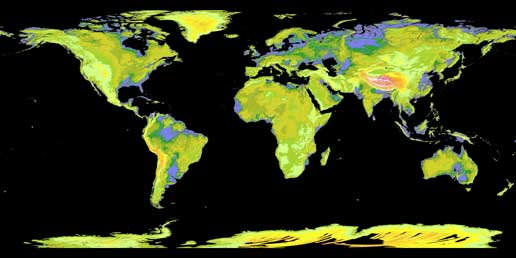
Global map from ASTER. Credit: NASA, METI

Previously, the most complete topographic set of data publicly available was from NASA’s Shuttle Radar Topography Mission. That mission mapped 80 percent of Earth’s landmass, between 60 degrees north latitude and 57 degrees south. The new ASTER data expands coverage to 99 percent, from 83 degrees north latitude and 83 degrees south. Each elevation measurement point in the new data is 98 feet apart.

The ASTER data fill in many of the voids in the shuttle mission’s data, such as in very steep terrains and in some deserts,” said Michael Kobrick, Shuttle Radar Topography Mission project scientist at the Jet Propulsion Laboratory. “NASA is working to combine the ASTER data with that of the Shuttle Radar Topography Mission and other sources to produce an even better global topographic map.”

Source: NASA

NASA IBEX Spacecraft Detects Neutral Hydrogen Bouncing Off Moon

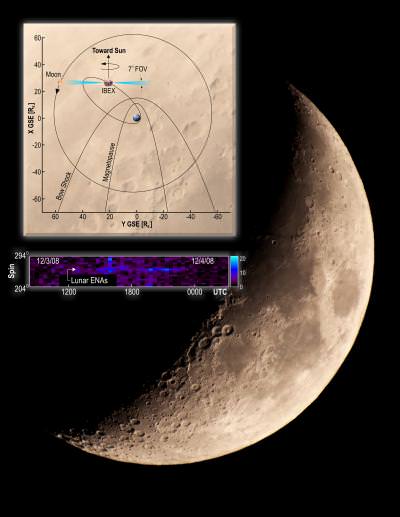
NASA's Interstellar Boundary Explorer has made the first detection of neutral atoms coming from the Moon (background image). The color-coded data toward the bottom shows the neutral particles and geometry measured at the Moon on Dec. 3, 2008.

[/caption]

NASA’s Interstellar Boundary Explorer (IBEX) spacecraft has made the first observations of fast hydrogen atoms coming from the moon, following decades of speculation and searching for their existence.   Launched last October, the IBEX has a mission to image and map the dynamic interactions caused by the hot solar wind slamming into the cold expanse of space.  But as the IBEX team commissioned the spacecraft, they discovered the stream of neutral hydrogen atoms which are caused by the solar wind scattering off the moon’s surface.


The detector which made the discovery, called IBEX-Hi, was designed and built by the Southwest Research Institute and Los Alamos National Labs to measure particles moving at speeds of 0.5 million to 2.5 million miles an hour.

“Just after we got IBEX-Hi turned on, the moon happened to pass right through its field of view, and there they were,” says Dr. David J. McComas, IBEX principal investigator and assistant vice president of the SwRI Space Science and Engineering Division, where the IBEX-Hi particle detector was primarily built. “The instrument lit up with a clear signal of the neutral atoms being detected as they backscattered from the moon.”

The solar wind, the supersonic stream of charged particles that flows out from the sun, moves out into space in every direction at speeds of about a million mph. The Earth’s strong magnetic field shields our planet from the solar wind. The moon, with its relatively weak magnetic field, has no such protection, causing the solar wind to slam onto the moon’s sunward side.

From its vantage point in high earth orbit, IBEX sees about half of the moon — one quarter of it is dark and faces the nightside (away from the sun), while the other quarter faces the dayside (toward the sun). Solar wind particles impact only the dayside, where most of them are embedded in the lunar surface, while some scatter off in different directions. The scattered ones mostly become neutral atoms in this reflection process by picking up electrons from the lunar surface.

The IBEX team estimates that only about 10 percent of the solar wind ions reflect off the sunward side of the moon as neutral atoms, while the remaining 90 percent are embedded in the lunar surface. Characteristics of the lunar surface, such as dust, craters and rocks, play a role in determining the percentage of particles that become embedded and the percentage of neutral particles, as well as their direction of travel, that scatter.

McComas says the results also shed light on the “recycling” process undertaken by particles throughout the solar system and beyond. The solar wind and other charged particles impact dust and larger objects as they travel through space, where they backscatter and are reprocessed as neutral atoms. These atoms can travel long distances before they are stripped of their electrons and become ions and the complicated process begins again.

The combined scattering and neutralization processes now observed at the moon have implications for interactions with objects across the solar system, such as asteroids, Kuiper Belt objects and other moons. The plasma-surface interactions occurring within protostellar nebula, the region of space that forms around planets and stars — as well as exoplanets, planets around other stars — also can be inferred.

IBEX’s primary mission is to observe and map the complex interactions occurring at the edge of the solar system, where the million miles per hour solar wind runs into the interstellar material from the rest of the galaxy. The spacecraft carries the most sensitive neutral atom detectors ever flown in space, enabling researchers to not only measure particle energy, but also to make precise images of where they are coming from.

And the spacecraft is just getting started.  Towards the end of the summer, the team will release the spacecraft’s first all-sky map showing the energetic processes occurring at the edge of the solar system. The team will not comment until the image is complete, but McComas hints, “It doesn’t look like any of the models.”

The research was published recently in the journal Geophysical Research Letters.

Source: Southwest Research Institute

Researchers Seeing Red on Ocean Health

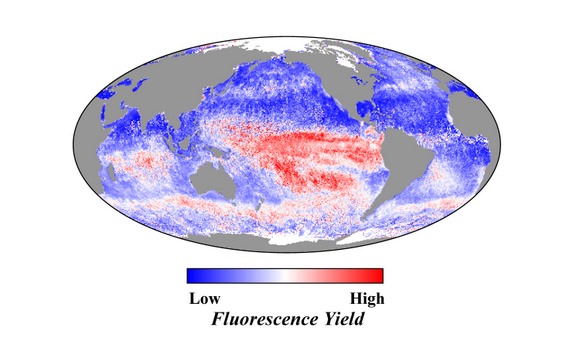
The MODIS instrument on NASA’s Aqua satellite compiled this global view of the amount of fluorescent light emitted by phytoplankton in the ocean. Credit: Oregon State University

[/caption]
With the help of an orbiting satellite, researchers have conducted the first global analysis of the health and productivity of ocean plants. Using the Moderate Resolution Imaging Spectroradiometer (MODIS) on NASA’s Aqua satellite, scientists have for the first time measured remotely the amount of fluorescent red light emitted by ocean phytoplankton and assess how efficiently the microscopic plants are turning sunlight and nutrients into food through photosynthesis. Now that they have their first data, this method should allow scientists to effectively keep an eye on the health of our oceans. So what did they find out so far?

Over the past two decades, scientists have employed various satellite sensors to measure the amount and distribution of the green pigment chlorophyll, an indicator of the amount of plant life in the ocean. But with MODIS, “red-light fluorescence” has been observed over the open ocean.

“Chlorophyll gives us a picture of how much phytoplankton is present,” said Scott Doney, a marine chemist from the Woods Hole Oceanographic Institution and a co-author of the paper. “Fluorescence provides insight into how well they are functioning in the ecosystem.”

Phytoplankton -- such as this colony of chaetoceros socialis -- naturally give off fluorescent light as they dissipate excess solar energy that they cannot consume through photosynthesis. Credit: Maria Vernet, Scripps Institution of Oceanography

Red-light fluorescence reveals insights about the physiology of marine plants and the efficiency of photosynthesis, as different parts of the plant’s energy-harnessing machinery are activated based on the amount of light and nutrients available. For instance, the amount of fluorescence increases when phytoplankton are under stress from a lack of iron, a critical nutrient in seawater. When the water is iron-poor, phytoplankton emit more solar energy as fluorescence than when iron is sufficient.

The fluorescence data from MODIS gives scientists a tool that enables research to reveal where waters are iron-enriched or iron-limited, and to observe how changes in iron influence plankton. The iron needed for plant growth reaches the sea surface on winds blowing dust from deserts and other arid areas, and from upwelling currents near river plumes and islands.

The new analysis of MODIS data has allowed the research team to detect new regions of the ocean affected by iron deposition and depletion. The Indian Ocean was a particular surprise, as large portions of the ocean were seen to “light up” seasonally with changes in monsoon winds. In the summer, fall, and winter – particularly summer – significant southwesterly winds stir up ocean currents and bring more nutrients up from the depths for the phytoplankton. At the same time, the amount of iron-rich dust delivered by winds is reduced.

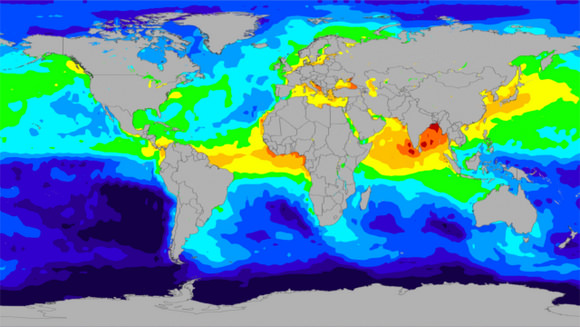
This data-based map shows iron dust deposition on the oceans in spring 2004. Areas with low dust deposition have high fluorescence yields. Credit: NASA's Scientific Visualization Studio

“On time-scales of weeks to months, we can use this data to track plankton responses to iron inputs from dust storms and the transport of iron-rich water from islands and continents,” said Doney. “Over years to decades, we can also detect long-term trends in climate change and other human perturbations to the ocean.”

Climate change could mean stronger winds pick up more dust and blow it to sea, or less intense winds leaving waters dust-free. Some regions will become drier and others wetter, changing the regions where dusty soils accumulate and get swept up into the air. Phytoplankton will reflect and react to these global changes.

Single-celled phytoplankton fuel nearly all ocean ecosystems, serving as the most basic food source for marine animals from zooplankton to fish to shellfish. In fact, phytoplankton account for half of all photosynthetic activity on Earth. The health of these marine plants affects commercial fisheries, the amount of carbon dioxide the ocean can absorb, and how the ocean responds to climate change.

“This is the first direct measurement of the health of the phytoplankton in the ocean,” said Michael Behrenfeld, a biologist who specializes in marine plants at the Oregon State University in Corvallis, Ore. “We have an important new tool for observing changes in phytoplankton every week, all over the planet.”

Source: NASA