The Orbit of Saturn. How Long is a Year on Saturn?

Saturn. Image credit: Hubble

Every planet in the Solar System takes a certain amount of time to complete a single orbit around the Sun. Here on Earth, this period lasts 365.25 days – a period that we refer to as a year. When it comes to the other planets, we use this measurement to characterize their orbital periods. And what we have found is that on many of these planets, depending on their distance from the Sun, a year can last a very long time!

Consider Saturn, which orbits the Sun at a distance of about 9.5 AU – i.e. nine and a half times the distance between the Earth and the Sun. Because of this, the speed with which it orbits the Sun is also considerably slower. As a result, a single year on Saturn lasts an average of about twenty-nine and a half years. And during that time, some interesting changes happen for the planet’s weather systems.

Orbital Period:

Saturn orbits the Sun at an average distance (semi-major axis) of 1.429 billion km (887.9 million mi; 9.5549 AU). Because its orbit is elliptical – with an eccentricity of 0.05555 – its distance from the Sun ranges from 1.35 billion km (838.8 million mi; 9.024 AU) at its closest (perihelion) to 1.509 billion km (937.6 million mi; 10.086 AU) at its farthest (aphelion).

A diagram showing the orbits of the outer Solar planets. Saturn’s orbit is represented in yellow Credit: NASA

With an average orbital speed of 9.69 km/s, it takes Saturn 29.457 Earth years (or 10,759 Earth days) to complete a single revolution around the Sun. In other words, a year on Saturn lasts about as long as 29.5 years here on Earth. However, Saturn also takes just over 10 and a half hours (10 hours 33 minutes) to rotate once on its axis. This means that a single year on Saturn lasts about 24,491 Saturnian solar days.

It is because of this that what we can see of Saturn’s rings from Earth changes over time. For part of its orbit, Saturn’s rings are seen at their widest point. But as it continues on its orbit around the Sun, the angle of Saturn’s rings decreases until they disappear entirely from our point of view. This is because we are seeing them edge-on. After a few more years, our angle improves and we can see the beautiful ring system again.

Orbital Inclination and Axial Tilt:

Another interesting thing about Saturn is the fact that its axis is tilted off the plane of the ecliptic. Essentially, its orbit is inclined 2.48° relative to the orbital plane of the Earth. Its axis is also tilted by 26.73° relative to the ecliptic of the Sun, which is similar to Earth’s 23.5° tilt. The result of this is that, like Earth, Saturn goes through seasonal changes during the course of its orbital period.

R. G. French (Wellesley College) et al., NASA, ESA, and The Hubble Heritage Team (STScI/AURA)

Seasonal Changes:

For half of its orbit, Saturn’s northern hemisphere receives more of the Sun’s radiation than the southern hemisphere. For other half of its orbit, the situation is reversed, with the southern hemisphere receiving more sunlight than the northern hemisphere. This creates storm systems that dramatically change depending on which part of its orbit Saturn is in.

For staters, winds in the upper atmosphere can reach speeds of up to 5oo meters per second (1,600 feet per second) around the equatorial region. On occasion, Saturn’s atmosphere exhibits long-lived ovals, similar to what is commonly observed on Jupiter. Whereas Jupiter has the Great Red Spot, Saturn periodically has what’s known as the Great White Spot (aka. Great White Oval).

This unique but short-lived phenomenon occurs once every Saturnian year, around the time of the northern hemisphere’s summer solstice. These spots can be several thousands of kilometers wide, and have been observed on many occasions throughout the past – in 1876, 1903, 1933, 1960, and 1990.

Since 2010, a large band of white clouds called the Northern Electrostatic Disturbance have been observed, which was spotted by the Cassini space probe. Given the periodic nature of these storms, another one is expected to happen in 2020, coinciding with Saturn’s next summer in the northern hemisphere.

The huge storm churning through the atmosphere in Saturn’s northern hemisphere overtakes itself as it encircles the planet in this true-color view from NASA’s Cassini spacecraft. Image credit: NASA/JPL-Caltech/SSI

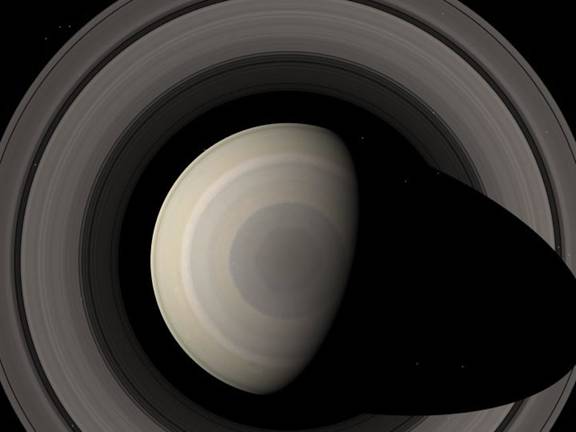
Similarly, seasonal changes affect the very large weather patterns that exist around Saturn’s northern and southern polar regions. At the north pole, Saturn experiences a hexagonal wave pattern which measures some 30,000 km (20,000 mi) in diameter, while each of it six sides measure about 13,800 km (8,600 mi). This persistent storm can reach speeds of about 322 km per hour (200 mph).

Thanks to images taken by the Cassini probe between 2012 and 2016, the storm appears to undergo changes in color (from a bluish haze to a golden-brown hue) that coincide with the approach of the summer solstice. This was attributed to an increase in the production of photochemical hazes in the atmosphere, which is due to increased exposure to sunlight.

Similarly, in the southern hemisphere, images acquired by the Hubble Space Telescope have indicated the existence of large jet stream. This storm resembles a hurricane from orbit, has a clearly defined eyewall, and can reach speeds of up to 550 km/h (~342 mph). And much like the northern hexagonal storm, the southern jet stream undergoes changes as a result of increased exposure to sunlight.

Saturn makes a beautifully striped ornament in this natural-color image, showing its north polar hexagon and central vortex (Credit: NASA/JPL-Caltech/Space Science Institute)

Cassini was able to captured images of the south polar region in 2007, which coincided with late fall in the southern hemisphere. At the time, the polar region was becoming increasingly “smoggy”, while the northern polar region was becoming increasingly clear. The reason for this, it was argued, was that decreases in sunlight led to the formation of methane aerosols and the creation of cloud cover.

From this, it has been surmised that the polar regions become increasingly obscured by methane clouds as their respective hemisphere approaches their winter solstice, and clearer as they approach their summer solstice. And the mid-latitudes certainly show their share of changes thanks to increases/decreases in exposure to solar radiation.

Much like the length of a single year, what we know about Saturn has a lot to do with its considerable distance from the Sun. In short, few missions have been able to study it in depth, and the length of a single year means it is difficult for a probe to witness all the seasonal changes the planet goes through. Still, what we have learned has been considerable, and also quite impressive!

We have written many articles about years on other planets here at Universe Today. Here’s The Orbit of the Planets. How Long Is A Year On The Other Planets?, The Orbit of Earth. How Long is a Year on Earth?, The Orbit of Mercury. How Long is a Year on Mercury?, The Orbit of Venus. How Long is a Year on Venus?,  The Orbit of Mars. How Long is a Year on Mars?, The Orbit of Jupiter. How Long is a Year on Jupiter?, The Orbit of Uranus. How Long is a Year on Uranus?, The Orbit of Neptune. How Long is a Year on Neptune?, The Orbit of Pluto. How Long is a Year on Pluto?

If you’d like more information on Saturn, check out Hubblesite’s News Releases about Saturn. And here’s a link to the homepage of NASA’s Cassini spacecraft, which is orbiting Saturn.

We have also recorded an entire episode of Astronomy Cast that’s just about Saturn. Listen here, Episode 59: Saturn.

Sources:

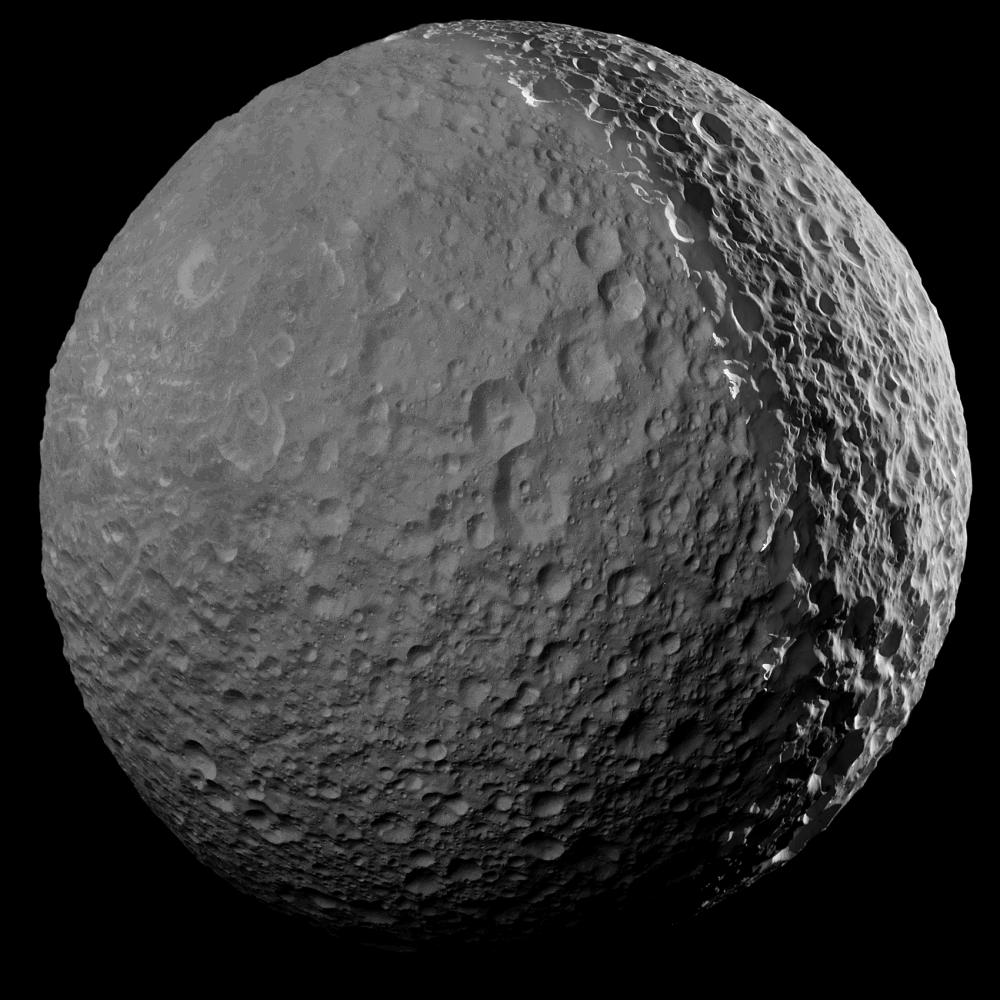
Last Look At Mimas For A Long Time

Mosaic view of Mimas, created using images taken by the Cassini probe (and illuminated to show the full surface). Credit: NASA/JPL-Caltech/Space Science Institute

Since the Cassini mission arrived in the Saturn system in 2004, it has provided some stunning images of the gas giant and its many moons. And in the course of capturing new views of Titan’s dense atmosphere, Iapetus’ curious “yin-yang” coloration, and the water plumes and “tiger stripes” of Enceladus, it snapped the most richly-detailed images of Mimas ever seen.

But like all good things, Cassini’s days of capturing close-up images of Mimas are coming to an end. As of January 30th, 2017, the probe made its final close approach to the moon, and took the last of it’s close-up pictures in the process. In the future, all observations (and pictures) of Mimas will take place at roughly twice this distance – and will therefore be less detailed.

To be fair, these close approaches were a pretty rare event during the Cassini mission. Over the course of the thirteen years that the probe has been in the Saturn system, only seven flybys have taken place, occurring at distances of less 50,000 km (31,000 mi). At its closest approach, Cassini passed within 41,230 km (25,620 mi) of Mimas.

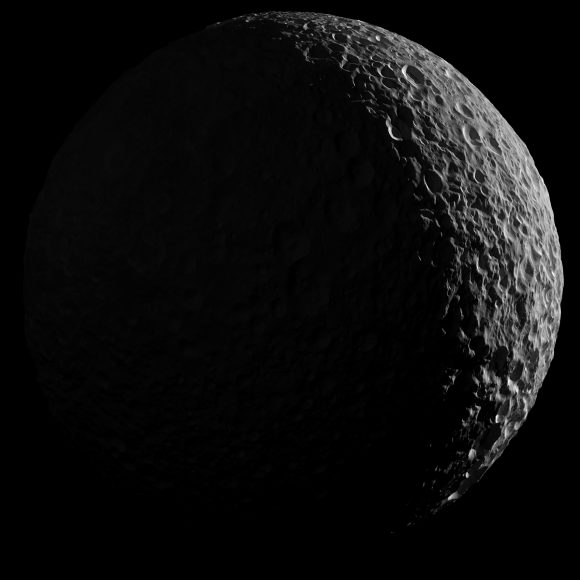
Second mosaic view of Mimas, showing illumination on only the Sun-facing side. Credit: NASA/JPL-Caltech/Space Science Institute

During this time, the probe managed to take a series of images that allowed for the creation of a beautiful mosaic. This mosaic was made from ten combined narrow-angle camera images, and is one of the highest resolution views ever captured of the icy moon. It also comes in two versions. In one, the left side of Mimas is illuminated by the Sun and the picture is enhanced to show the full moon (seen at top).

In the second version (shown above), natural illumination shows only the Sun-facing side of the moon. They also created an animation that allows viewers to switch between mosaics, showing the contrast. And as you can see, these mosaics provide a very detailed look at Mimas heavily-cratered surface, a well as the large surface fractures that are believed to have been caused by the same impact that created the Herschel Crater.

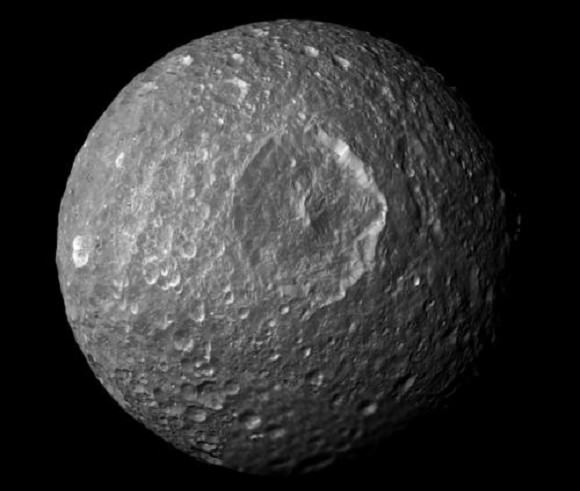
This famous crater, from which Mimas gets it’s “Death Star” appearance, was photographed during Cassini’s first flyby – which occurred on February 13th, 2010. Named in honor of William Herschel (the discoverer of Uranus, its moons Oberon, and Titania, and Saturn’s moons Enceladus and Mimas), this crater measures 130 km (81 mi) across, almost a third of Mimas’ diameter.

This mosaic, created from images taken by NASA’s Cassini spacecraft during its closest flyby of Saturn’s moon Mimas, looks straight at the moon’s huge Herschel Crater Credit: NASA/JPL

Its is also quite deep, as craters go, with walls that are approximately 5 km (3.1 mi) high. Parts of its floor reach as deep as 10 km (6.2 mi), and it’s central peak rises 6 km (3.7 mi) above the crater floor. The impact that created this crater is believed to have nearly shattered Mimas, and also caused the fractures visible on the opposite side of the moon.

It’s a shame we won’t be getting any more close ups of the moon’s many interesting features. However, we can expect a plethora of intriguing images of Saturn’s rings, which it will be exploring in depth as part of the final phase of its mission. The mission is scheduled to end on September 15th, 2017, which will culminate with the crash of the probe in Saturn’s atmosphere.

Further Reading: NASA

Warm Poles Suggest Enceladus’ Liquid Water Near Surface

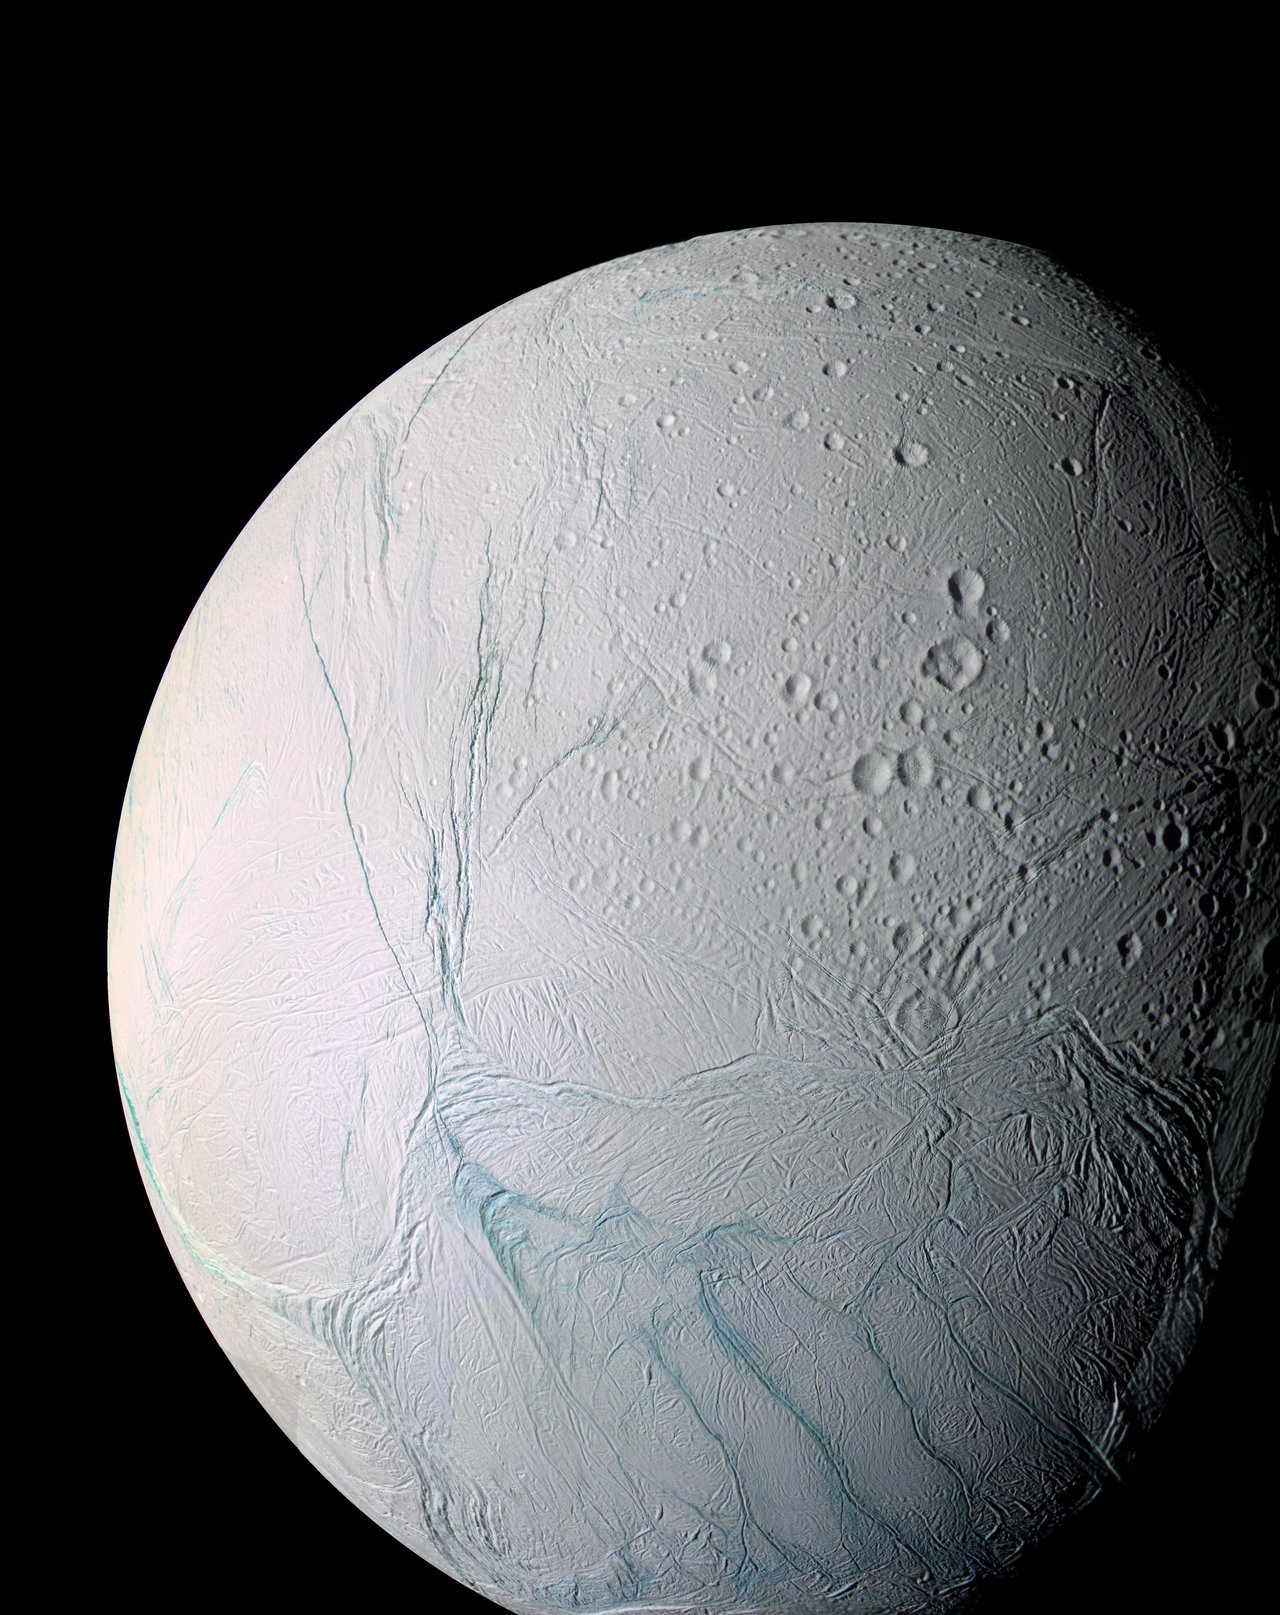
Saturn's moon Enceladus could harbor microbial life in the warm salty water thought to exist under its frozen surface. Respondents in the study seemed to like that possibility. Credits: NASA/JPL-Caltech/Space Science Institute

One of the biggest surprises from the Cassini mission to Saturn has been the discovery of active geysers at the south pole of the moon Enceladus. At only about 500 km (310 miles) in diameter, the bright and ice-covered moon should be too small and too far from the Sun to be active. Instead, this little moon is one of the most geothermally active places in the Solar System.

Now, a new study from Cassini data shows that the south polar region of Enceladus is even warmer than expected just a few feet below its icy surface. While previous studies have confirmed an ocean of liquid water inside Enceladus which fuels the geysers, this new study shows the ocean is likely closer to the surface than previously thought. Additionally – and most enticing – there has to be a source of heat inside the moon that is not completely understood.

“These observations provide a unique insight into what is going on beneath the surface,” said Alice Le Gall, who is part of the Cassini RADAR instrument team, from Laboratoire Atmosphères, Milieux, Observations Spatiales (LATMOS), and Université Versailles Saint-Quentin (UVSQ), France. “They show that the first few meters below the surface of the area that we investigated, although at a glacial 50-60 K, are much warmer than we had expected: likely up to 20 K warmer in some places. This cannot be explained only as a result of the Sun’s illumination and, to a lesser extent, Saturn’s heating so there must be an additional source of heat.”

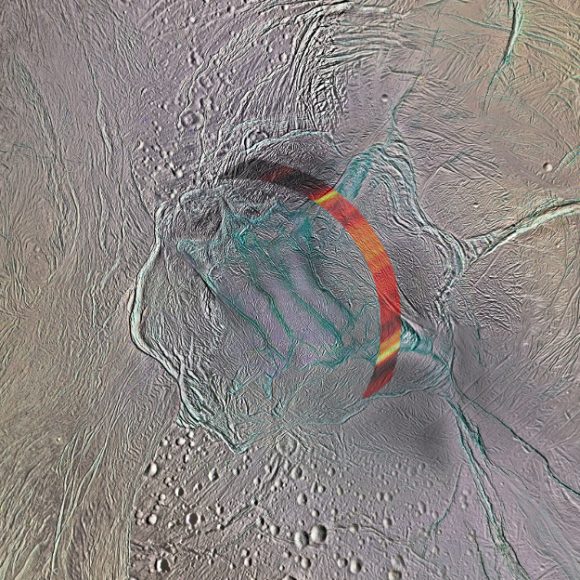
Tiger stripes on the south pole of Enceladus. The region studied is indicated by the coloured band. NASA/JPL-Caltech/Space Science Institute; Acknowledgement: A. Lucas

Microwave data taken during a close flyby in 2011 shows there is excess heat at three fractures in the surface of Enceladus. While similar to the so-called “tiger-stripe” features on this moon that are actively venting ice and water molecules into space, these three fractures don’t appear to be active, at least not in 2011.

Scientists say the seemingly dormant fractures lying above the moon’s warm, underground sea point to the dynamic character of Enceladus’ geology, suggesting the moon might have experienced several episodes of activity, in different places on its surface.

The 2011 flyby provided the first – and unfortunately, the only — high-resolution observations of Enceladus’ south pole at microwave wavelengths.

It looked at a narrow, arc-shaped swathe of the southern polar region, about 25 km (15 miles) wide, and located just 30 km to 50 km (18-30 miles) north of the tiger-stripe fractures.

The heat that was detected appears to be lying under a much colder layer of frost.

Because of operational constraints of the 2011 flyby, it was not possible to obtain microwave observations of the active fractures themselves. But this allowed the scientists to observe that the thermally anomalous terrains of Enceladus extend well beyond the tiger stripes.

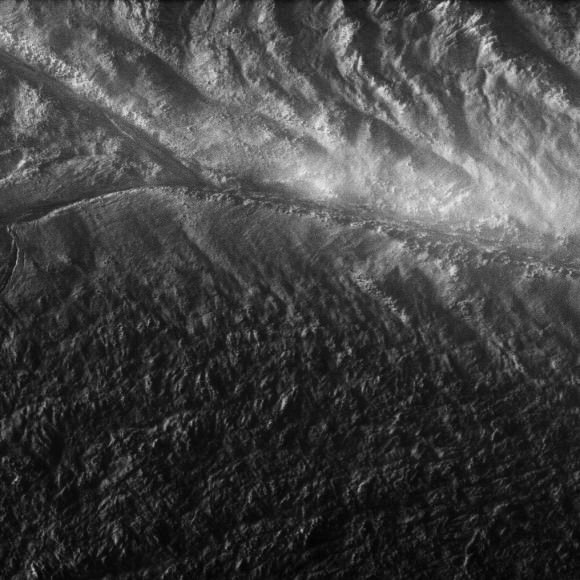
Cassini’s view down into a jetting “tiger stripe” in August 2010. Credit: NASA

Their findings show it is likely that the entire south pole region is warm underneath, meaning Enceladus’ ocean could be just 2 km under the moon’s icy surface in that area. The finding agrees with a 2016 study, led by another Cassini team member, Ondrej Cadek, which estimated the thickness of the crust on Enceladus’ south pole to be less than the rest of the moon. That study estimated the depth of the ice shell to be less than 5 km (1.2 miles) at the south pole, while average depth on other areas of Enceladus is between 18–22 km (11-13 miles).

What generates the internal heat at Enceladus? The main source of heat remains a mystery, but scientists think gravitational forces between Enceladus, Saturn, and another moon, Dione pull and flex Enceladus’ interior. Known as tidal forces, the tugging causes the moon’s interior to rub, creating friction and heat. It also creates stress compressions and deformations on the crust, leading to the formation of faults and fractures. This in turn creates more heat in the sub-surface layers. In this scenario, the thinner icy crust in the south pole region is subject to a larger tidal deformation that means more heat being created to help keep the underground water warm.

Dramatic plumes, both large and small, spray water ice out from many locations along the famed “tiger stripes” near the south pole of Saturn’s moon Enceladus. Credit: NASA/JPL/Space Science Institute

Since the geysers weren’t known until Cassini’s arrival at Saturn, the spacecraft didn’t have a specific payload to study them, but scientists used the instruments at their disposal to make the best observations they could, flying the spacecraft to within 49 km (30 miles) of the surface. To fully study the tidal heating — or to determine if there is another source of heat — scientists will continue to study the data already taken by various Cassini instruments. But since the mission will be ending in September 2017, it may require another mission to this intriguing moon to fully figure out this mystery.

“This discovery opens new perspectives to investigate the emergence of habitable conditions on the icy moons of the gas giant planets,” says Nicolas Altobelli, ESA’s Project Scientist for Cassini–Huygens. “If Enceladus’ underground sea is really as close to the surface as this study indicates, then a future mission to this moon carrying an ice-penetrating radar sounding instrument might be able to detect it.”

“Finding temperatures near these three inactive fractures that are unexpectedly higher than those outside them adds to the intrigue of Enceladus,” said Cassini Project Scientist Linda Spilker at the Jet Propulsion Laboratory. “What is the warm underground ocean really like and could life have evolved there? These questions remain to be answered by future missions to this ocean world.”

Feel free to submit your mission proposals in the comment section below…

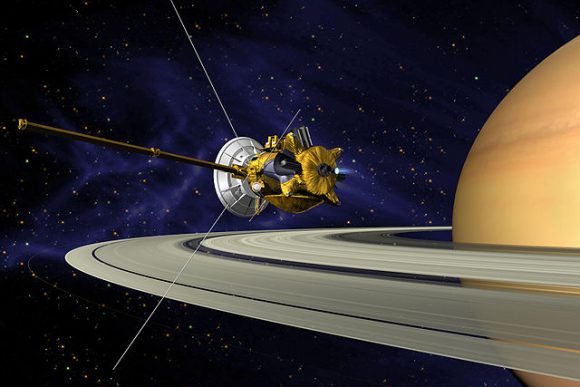
An artist’s illustration of Cassini entering orbit around Saturn. Credit: NASA/JPL.

Sources: ESA
JPL
Paper: Thermally anomalous features in the subsurface of Enceladus’s south polar terrain” by A. Le Gall et al. (2017), published in Nature Astronomy

Fried Egg? Flying Saucer? Nope. Just Cool New Closeups of Saturn’s Moon Pan

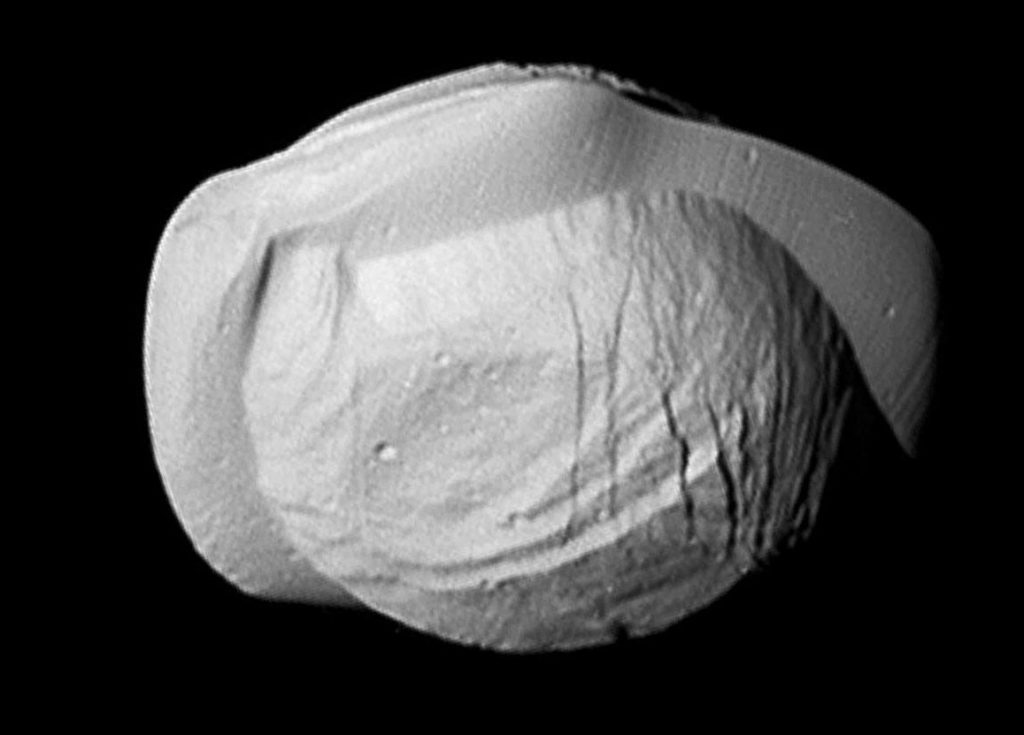
Saturn's "UFO moon" Pan up close. Credit: NASA/JPL/Space Science Institute
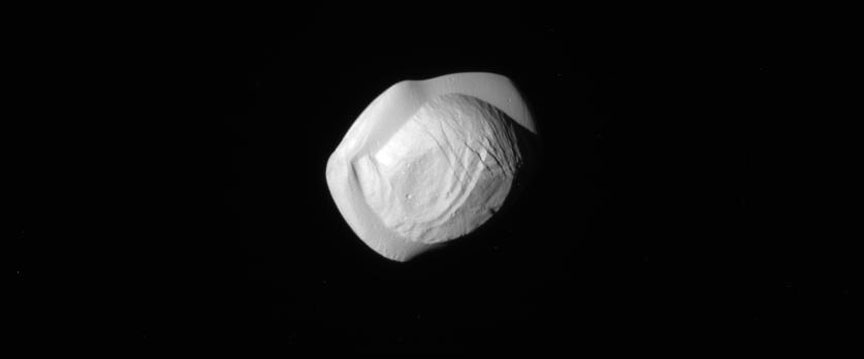
This new view of Saturn’s moon Pan is the closest yet, snapped by Cassini from a distance of 15,268 miles (24,572 km) on March 7, 2017. Pan measures 22 miles wide by 14 miles across and displays a number of small craters along with parallel ridges and grooves. Its broad, thinner equatorial ridge displays fine, parallel striations. Credit: NASA/JPL/Space Science Institute

Besides Earth, Saturn may be the only other planet where you can order rings with a side of ravioli. Closeup photos taken by the Cassini probe of the the planet’s second-innermost moon, Pan, on March 7 reveal remarkable new details that have us grasping at food analogies in a feeble attempt to describe its unique appearance.

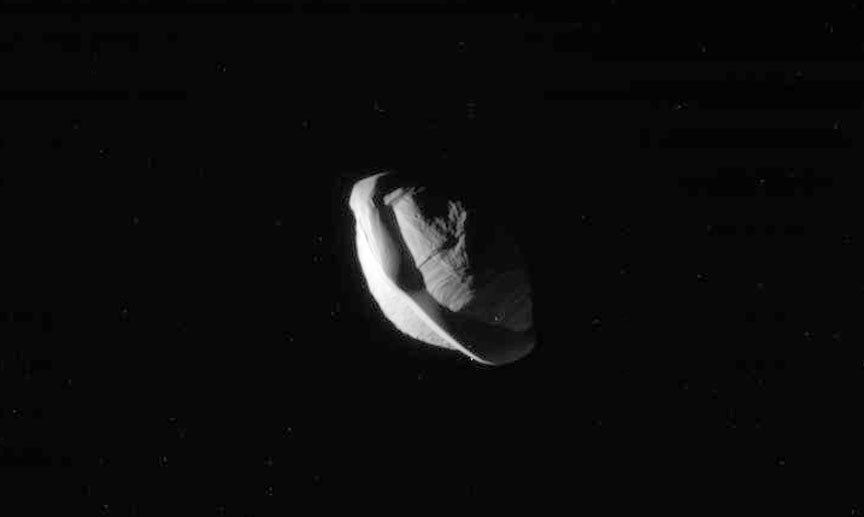
A side view of Pan better shows its thin and wavy ridge likely built up through the accumulation of particles grabbed from Saturn’s rings. The ridge is between 0.9 and 2.5 miles (1-4 km) thick. Credit: NASA/JPL/Space Science Institute


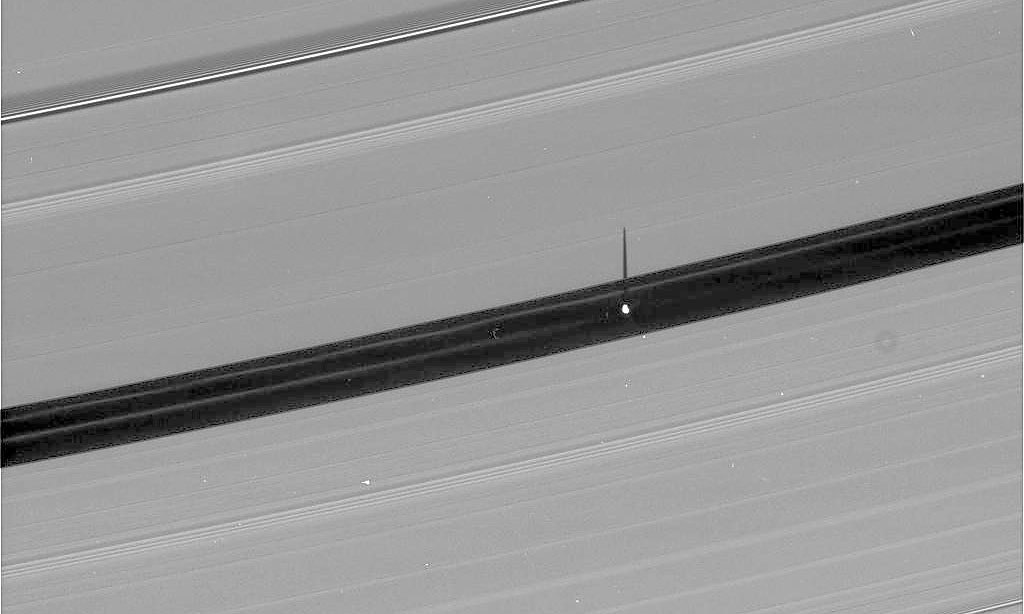
As Pan moves along the Encke Gap its gravity creates ripples in Saturn’s A-ring. Credit:
NASA/JPL/Space Science Institute

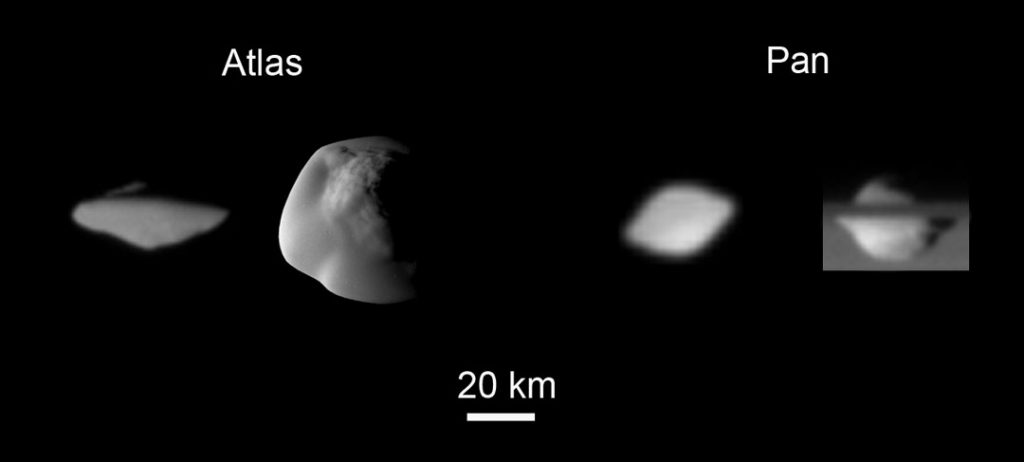
The two-part structure of the moon is immediately obvious: a core body with a thin, wavy ridge encircling its equator. How does such a bizarre object form in the first place? There’s good reason to believe that Pan was once part of a larger satellite that broke up near Saturn long ago. Much of the material flattened out to form Saturn’s rings while large shards like Pan and another ravioli lookalike, Atlas, orbited within or near the rings, sweeping up ring particles about their middles. Tellingly, the ridges are about as thick as the vertical distances each satellite travels in its orbit about the planet.

Pan casts its shadow on Saturn’s A-ring from within the 200-mile-wide (325 km) Encke Gap, which is maintained by the presence of the moon. Pan shares the gap with several diffuse ringlets from which it may still be gathering additional material around its equatorial ridge. Credit: NASA/JPL/Space Science Institute

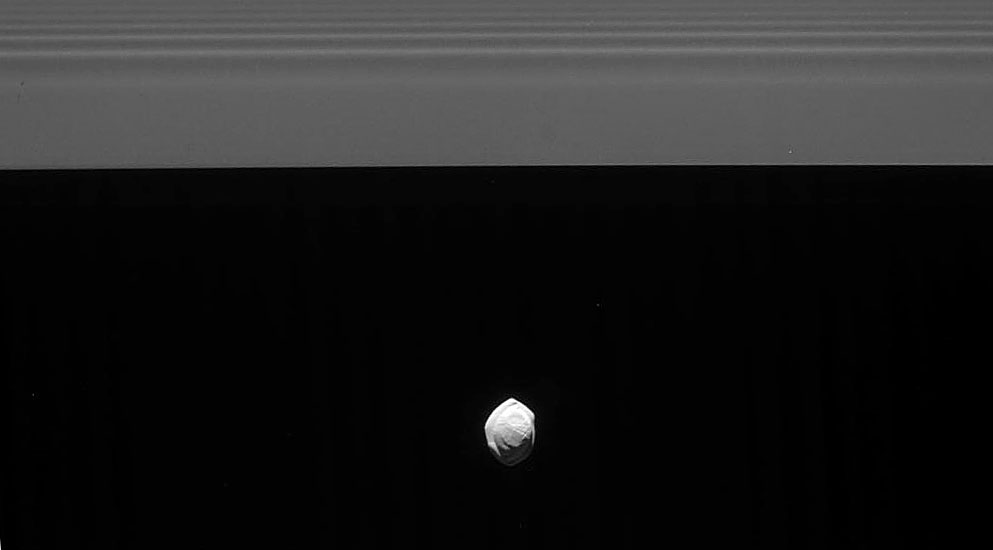
Today, Pan orbits within and clears the narrow Encke Gap in Saturn’s outer A-ring of debris. It also helps create and shape the narrow ringlets that appear in the gap It’s lookalike cousin Atlas orbits just outside the A-ring.

Pan and Altas (25×22 miles) orbit within Saturn’s ring plane and may both be fragments from a larger moon breakup that created Saturn’s rings. Both have swept up material from the rings to form equatorial ridges. Credit: NASA/JPL/Space Science Institute

Moons embedded in rings can have profound effects on that material from clearing gaps to creating new temporary ringlets and raising vertical waves of material that rise above and below the ring plane. All these effects are produced by gravity, which gives even small objects like Pan dominion over surprisingly vast regions.

Enjoy this animated gif created from photos of the close flyby of Pan. Credit:
NASA/JPL/Space Science Institute


What is the Weather like on Saturn?

The Saturn hexagon as seen by Voyager 1 in 1980 (NASA)

Welcome back to our planetary weather series! Next up, we take a look at the ringed-beauty, Saturn!

Saturn is famous for many things. Aside from its ring system, which are the most visible and beautiful of any gas giant, it is also known for its extensive system of moons (the second largest in the Solar System behind Jupiter). And then there its banded appearance and gold color, which are the result of its peculiar composition and persistent weather patterns.

Much like Jupiter, Saturn’s weather systems are known for being particularly extreme, giving rise to features that can be seen from great distances. It’s high winds periodically create massive oval-shaped storms, jet streams, hurricanes, and hexagonal wave patterns that are visible in both the northern and southern polar regions.

Saturn’s Atmosphere:

The outer atmosphere of Saturn contains 96.3% molecular hydrogen and 3.25% helium by volume. The gas giant is also known to contain heavier elements, though the proportions of these relative to hydrogen and helium is not known. It is assumed that they would match the primordial abundance from the formation of the Solar System.

The huge storm churning through the atmosphere in Saturn’s northern hemisphere overtakes itself as it encircles the planet in this true-color view from NASA’s Cassini spacecraft. Credit: NASA/JPL-Caltech/SSI

Trace amounts of ammonia, acetylene, ethane, propane, phosphine and methane have been also detected in Saturn’s atmosphere. The upper clouds are composed of ammonia crystals, while the lower level clouds appear to consist of either ammonium hydrosulfide (NH4SH) or water. Ultraviolet radiation from the Sun causes methane photolysis in the upper atmosphere, leading to a series of hydrocarbon chemical reactions with the resulting products being carried downward by eddies and diffusion.

Saturn’s atmosphere exhibits a banded pattern similar to Jupiter’s, but Saturn’s bands are much fainter and wider near the equator. As with Jupiter’s cloud layers, they are divided into the upper and lower layers, which vary in composition based on depth and pressure. In the upper cloud layers, with temperatures in range of 100–160 K and pressures between 0.5–2 bar, the clouds consist of ammonia ice.

The presence of hydrogen gas results in clouds of deep red. However, these are obscured by clouds of ammonia, which are closer to the outer edge of the atmosphere and cover the entire planet. The exposure of this ammonia to the Sun’s ultraviolet radiation causes it to appear white. Combined with its deeper red clouds, this results in the planet having a pale gold color.

Water ice clouds begin at a level where the pressure is about 2.5 bar and extend down to 9.5 bar, where temperatures range from 185–270 K. Intermixed in this layer is a band of ammonium hydrosulfide ice, lying in the pressure range 3–6 bar with temperatures of 290–235 K. Finally, the lower layers, where pressures are between 10–20 bar and temperatures are 270–330 K, contains a region of water droplets with ammonia in an aqueous solution.

Great White Spot:

On occasion, Saturn’s atmosphere exhibits long-lived ovals, similar to what is commonly observed on Jupiter. Whereas Jupiter has the Great Red Spot, Saturn periodically has what’s known as the Great White Spot (aka. Great White Oval). This unique but short-lived phenomenon occurs once every Saturnian year, roughly every 30 Earth years, around the time of the northern hemisphere’s summer solstice.

These spots can be several thousands of kilometers wide, and have been observed in 1876, 1903, 1933, 1960, and 1990. Since 2010, a large band of white clouds called the Northern Electrostatic Disturbance have been observed enveloping Saturn, which was spotted by the Cassini space probe. If the periodic nature of these storms is maintained, another one will occur in about 2020.

Meteorological Phenomena:

The winds on Saturn are the second fastest among the Solar System’s planets, after Neptune’s. This is due in part to Saturn’s high rotational velocity – which is 9.87 km/s (6.13 mi/s), which works out to 35,500 km/h (22,058.7 mi/h). At this rate, it only takes the planet 10 hours 33 minutes to rotate once on its axis. However, due to it being a gas giant, there is a difference between the rotation of its atmosphere and its core.

Data obtained by the Voyager 1 and 2 missions indicated peak easterly winds of 500 m/s (1800 km/h). Saturn’s northern and southern poles have also shown evidence of stormy weather. At the north pole, this takes the form of a hexagonal wave pattern, whereas the south shows evidence of a massive jet stream.

Saturn makes a beautifully striped ornament in this natural-color image, showing its north polar hexagon and central vortex. Credit: NASA/JPL-Caltech/Space Science Institute

The persisting hexagonal wave pattern around the north pole was first noted in the Voyager images. The sides of the hexagon are each about 13,800 km (8,600 mi) long (which is longer than the diameter of the Earth) and the structure rotates with a period of 10h 39m 24s, which is assumed to be equal to the period of rotation of Saturn’s interior.

The south pole vortex, meanwhile, was first observed using the Hubble Space Telescope. These images indicated the presence of a jet stream, but not a hexagonal standing wave. These storms are estimated to be generating winds of 550 km/h, are comparable in size to Earth, and believed to have been going on for billions of years.

In 2006, the Cassini space probe observed a hurricane-like storm that had a clearly defined eye. Such storms had not been observed on any planet other than Earth – even on Jupiter. This storm appeared to be caused by heat that was generated in the depths of the warm interior of Saturn, which then escaped to the upper atmosphere and escaped the planet.

Saturn has also been noted for its “string of pearls” feature, which was captured by Cassini’s visual and infrared mapping spectrometer in 2006. This feature, which appeared in it’s northern latitudes (and has not been seen on any other gas giant) is a series of cloud clearings spaced at regular intervals that show how Saturn’s atmosphere is lit by its own internal, thermal glow.

So how is the weather on Saturn? Pretty violent and stormy! And not surprising given the planet’s mass, composition, powerful gravity, and rapid rotation. Makes you feel happy we live on Earth, where the Earth is (comparatively speaking) pretty calm and boring!

We have written many interesting articles about planetary weather here at Universe Today. Here’s What’s the Weather Like on Mercury?, What’s the Weather Like on Venus?, What’s the Weather Like on Mars?, What’s the Weather Like on Jupiter?, What is the Weather Like on Uranus? and What is the Weather Like on Neptune?

For more information, check out NASA’s Solar System Exploration – Saturn, and the facts about Saturn from Space Facts.

Astronomy Cast has recorded some interesting episode on the subject. Here’s Episode 59: Saturn, and Episode 61: Saturn’s Moons.

Sources:
Unprecedented Views of Saturn’s Rings as Cassini Dances Death Spiral

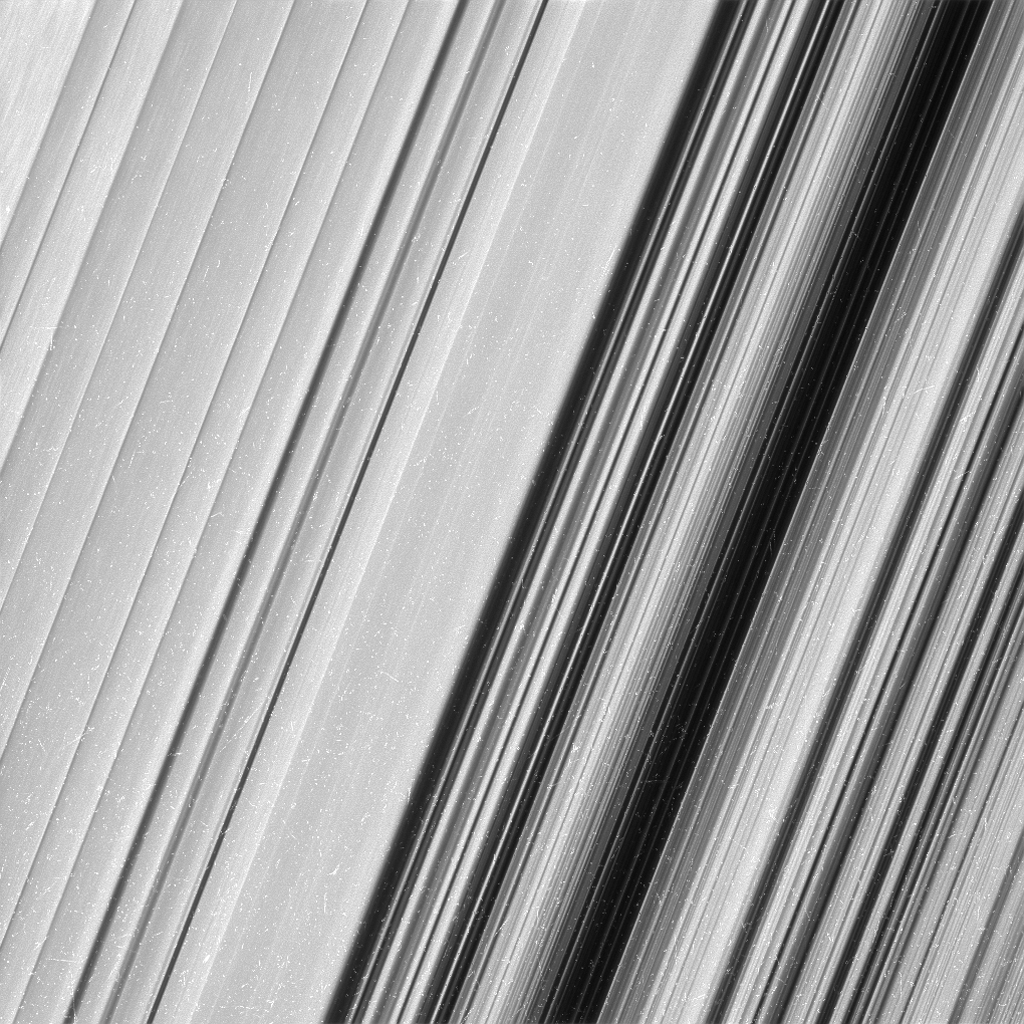
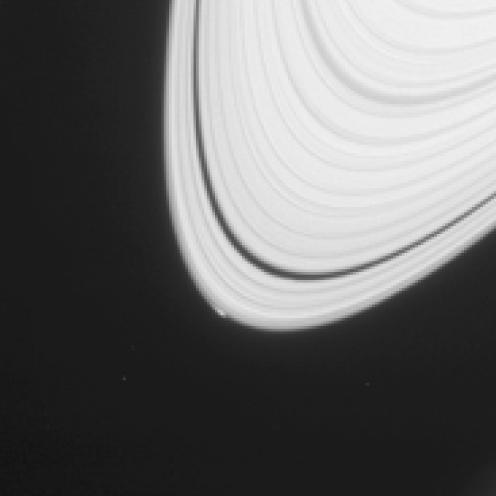
This image shows a region in Saturn's outer B ring. NASA's Cassini spacecraft viewed this area at a level of detail twice as high as it had ever been observed before. And from this view, it is clear that there are still finer details to uncover. Credit: NASA/JPL-Caltech/Space Science Institute

As the Cassini spacecraft moves ever closer to Saturn, new images provide some of the most-detailed views yet of the planet’s spectacular rings. From its “Ring-Grazing” orbit phase, Cassini’s cameras are resolving details in the rings as small as 0.3 miles (550 meters), which is on the scale of Earth’s tallest buildings.

On Twitter, Cassini Imaging Team Lead Carolyn Porco called the images “outrageous, eye-popping” and the “finest Cassini images of Saturn’s rings.”

Project Scientist Linda Spilker said the ridges and furrows in the rings remind her of the grooves in a phonograph record.

These images are giving scientists the chance to see more details about ring features they saw earlier in the mission, such as waves, wakes, and things they call ‘propellers’ and ‘straw.’

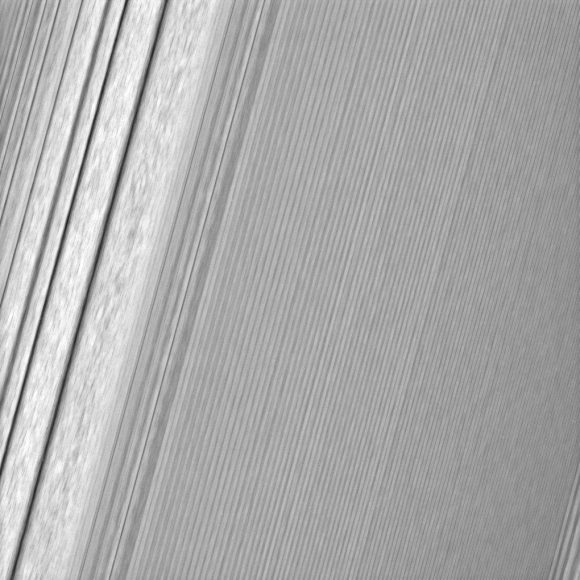
This Cassini image features a density wave in Saturn’s A ring (at left) that lies around 134,500 km from Saturn. Density waves are accumulations of particles at certain distances from the planet. This feature is filled with clumpy perturbations, which researchers informally refer to as “straw.” Credit: NASA/JPL-Caltech/Space Science Institute

As of this writing, Cassini just started the 10th orbit of the 20-orbit ring-grazing phase, which has the spacecraft diving past the outer edge of the main ring system. The ring-grazing orbits began last November, and will continue until late April, when Cassini begins its grand finale. During the 22 finale orbits, Cassini will repeatedly plunge through the gap between the rings and Saturn. The first of these plunges is scheduled for April 26.

The spacecraft is actually close enough to the ‘F’ ring that occasionally tenuous particle strike Cassini, said project scientist Linda Spilker, during a Facebook Live event today.

“These are very small and tenuous, only a few microns in size,” Spilker said, “like dust particles you’d see in the sunlight. We can actually ‘hear’ them hitting the spacecraft in our data, but these particles are so small, they won’t hurt Cassini.”

I talked with Spilker about ring particles for my book “Incredible Stories From Space:”

Spilker has envisioned holding a ring particle in her hand. What would it look like?

“We have evidence of the particles that have an icy core covered with fluffy regolith material that is very porous,” she said, “and that means the particle can heat up and cool down very quickly compared to a solid ice cube.”

The straw features are caused by clumping ring particles and the propellers are caused by small, embedded moonlets that creates propeller shaped wakes in the rings.

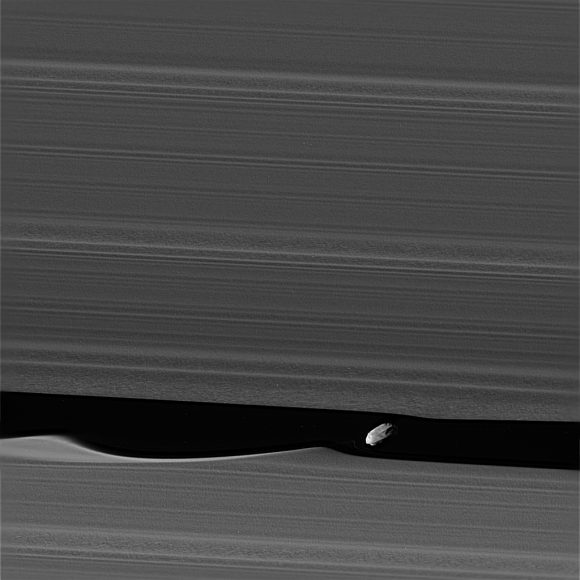
The wavemaker moon, Daphnis, is featured in this view, taken as NASA’s Cassini spacecraft made one of its ring-grazing passes over the outer edges of Saturn’s rings on Jan. 16, 2017. This is the closest view of the small moon obtained yet. Daphnis is 5 miles or 8 kilometers across. Credit: NASA/JPL-Caltech/Space Science Institute

This stunning view of the moon Daphnis shows the moon interacting with the ring particles, creating waves in the rings around it.

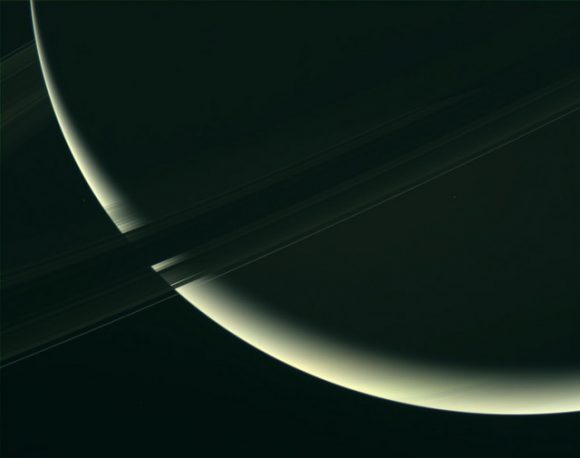
A close-up of Saturn and its rings. Assembled using raw uncalibrated RGB filtered images taken by the Cassini spacecraft on January 18 2017. Credit:
NASA/JPL-Caltech/SSI/image editing by Kevin M. Gill

“These close views represent the opening of an entirely new window onto Saturn’s rings, and over the next few months we look forward to even more exciting data as we train our cameras on other parts of the rings closer to the planet,” said Matthew Tiscareno, a Cassini scientist who studies Saturn’s rings at the SETI Institute, Mountain View, California. Tiscareno planned the new images for the camera team.

Further reading: JPL, CICLOPS

The Incredible Story of How the Huygens Mission to Titan Succeeded When It Could Have Failed

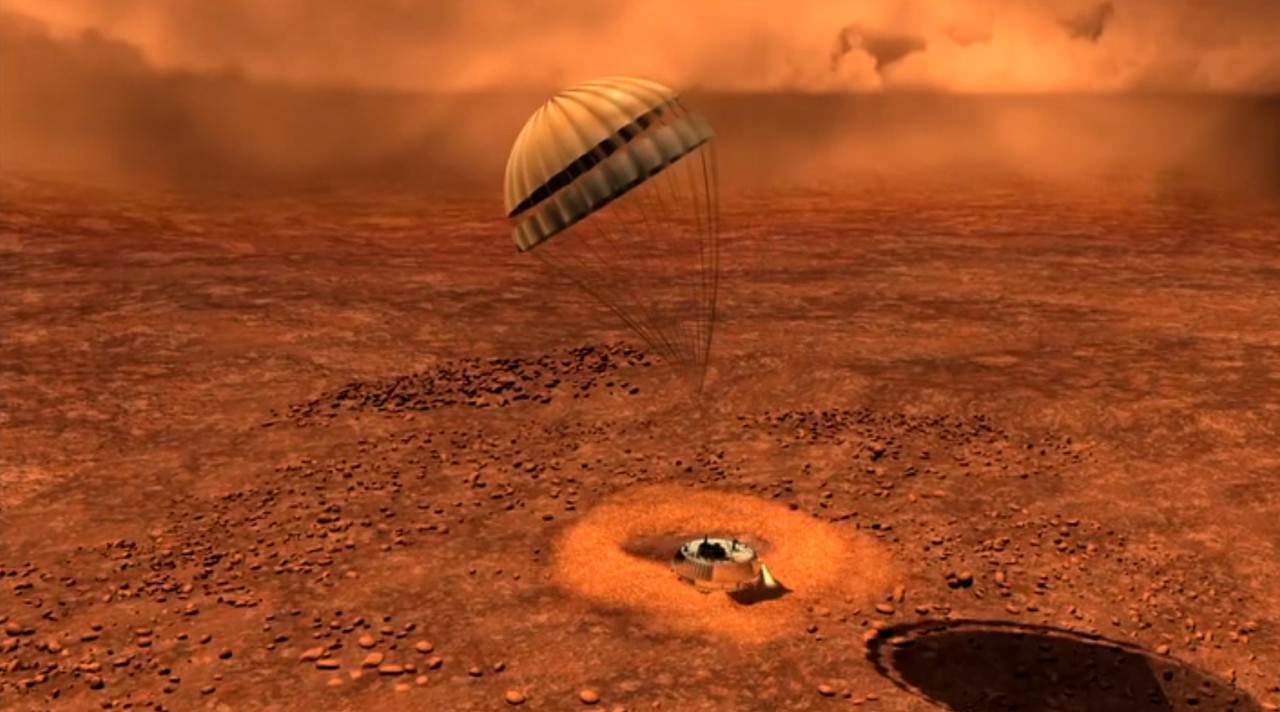
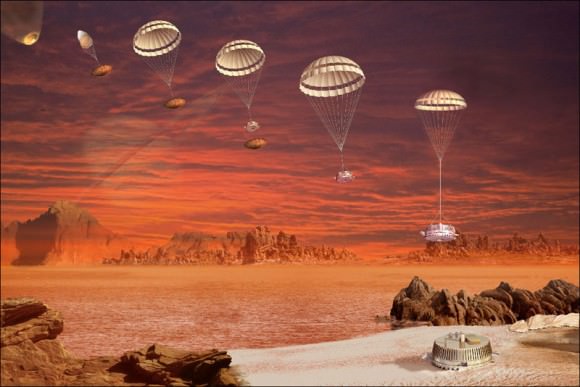
Artist depiction of Huygens landing on Titan. Credit: ESA

Twelve years ago today, the Huygens probe landed on Titan, marking the farthest point from Earth any spacecraft has ever landed. While a twelfth anniversary may be an odd number to mark with a special article, as we said in our previous article (with footage from the landing), this is the last opportunity to celebrate the success of Huygens before its partner spacecraft Cassini ends its mission on September 15, 2017 with a fateful plunge into Saturn’s atmosphere.

But Huygens is also worth celebrating because, amazingly, the mission almost failed, but yet was a marvelous success. If not for the insistence of one ESA engineer to complete an in-flight test of Huygens’ radio system, none of the spacecraft’s incredible data from Saturn’s largest and mysterious moon would have ever been received, and likely, no one would have ever known why.

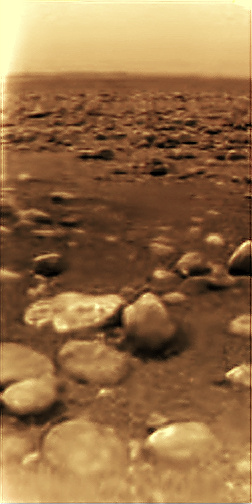
The first-ever images of the surface of a new moon or planet are always exciting. The Huygens probe was launched from Cassini to the surface of Titan, but was not able investigate the lakes and seas on the surface. Image Credit: ESA/NASA/JPL/University of Arizona
The first-ever images of the surface Titan, taken by the Huygens probe. Image Credit: ESA/NASA/JPL/University of Arizona

As I detail in my new book “Incredible Stories From Space: A Behind-the-Scenes-Look at the Missions Changing Our View of the Cosmos,” in 1999, the Cassini orbiter and the piggybacking Huygens lander were on their way to the Saturn system. The duo launched in 1997, but instead of making a beeline for the 6th planet from the Sun, they took a looping path called the VVEJGA trajectory (Venus-Venus-Earth-Jupiter Gravity Assist), swinging around Venus twice and flying past Earth 2 years later.

While all the flybys gave the spacecraft added boosts to help get it to Saturn, the Earth flyby also provided a chance for the teams to test out various systems and instruments and get immediate feedback.

“The European group wanted to test the Huygens receiver by transmitting the data from Earth,” said Earl Maize, Project Manager for the Cassini mission at JPL, who I interviewed for the book. “That’s a great in-flight test, because there’s the old adage of flight engineers, ‘test as you fly, fly as you test.’”

The way the Huygens mission would work at the Saturn system was that Cassini would release Huygens when the duo approached Titan. Huygens would drop through Titan’s thick and obscuring atmosphere like a skydiver on a parachute, transmitting data all the while. The Huygens probe didn’t have enough power or a large enough dish to transmit all its data directly to Earth, so Cassini would gather and store Huygens’ data on board and later transmit it to Earth.

Boris Smeds was head of ESOC’s Systems and Requirements Section, Darmstadt, Germany. Credit: ESA.

ESA engineer Boris Smeds wanted to ensure this data handoff was going to work, otherwise a crucial part of the mission would be lost. So he proposed a test during the 1999 Earth flyby.

Maize said that for some reason, there was quite a bit of opposition to the test from some of the ESA officials, but Smeds and Claudio Sollazzo, Huygens’s ground operations manager at ESA’s European Space Operation Centre (ESOC) in Darmstadt, Germany were insistent the test was necessary.

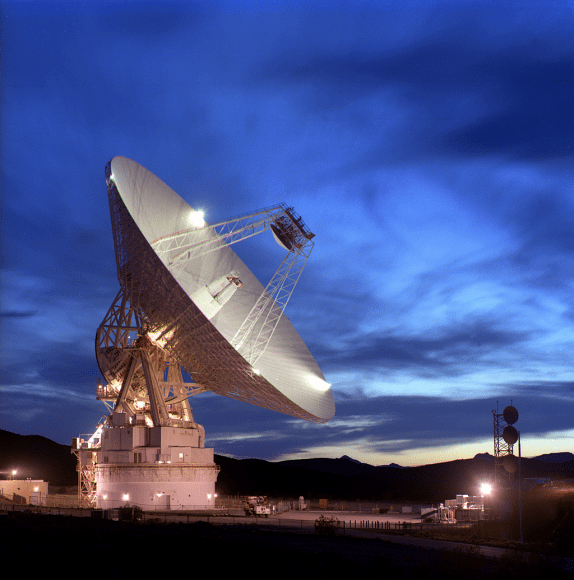
NASA's Deep Space Network is responsible for communicating with Juno as it explores Jupiter. Pictured is the Goldstone facility in California, one of three facilities that make up the Network. Image: NASA/JPL
NASA’s Deep Space Network is responsible for communicating with spacecraft. Pictured is the Goldstone facility in California, one of three facilities that make up the Network. Image: NASA/JPL

“They were not to be denied,” Maize said, “so they eventually got permission for the test. The Cassini team organized it, going to the Goldstone tracking station [in California] of the Deep Space Network (DSN) and did what’s called a ‘suitcase test,’ broke into the signal, and during the Earth flyby, Huygens, Cassini and Goldstone were all programmed to simulate the probe descending to Titan. It all worked great.”

Except for one thing: Cassini received almost no simulated data, and what it did receive was garbled. No one could figure out why.

Six months of painstaking investigation finally identified the problem. The variation in speed between the two spacecraft hadn’t been properly compensated for, causing a communication problem. It was as if the spacecraft were each communicating on a different frequency.

Artist concept of the Huygens probe descending to Titan. Credit: ESA.

“The European team came to us and said we didn’t have a mission,” Maize said. “But we put together ‘Tiger Teams’ to try and figure it out.”

The short answer was that the idiosyncrasies in the communications system were hardwired in. With the spacecraft now millions of miles away, nothing could be fixed. But engineers came up with an ingenious solution using a basic principal known as the Doppler Effect.

The metaphor Maize likes to use is this: if you are sitting on the shore and a speed boat goes by close to the coast, it zooms past you quickly. But that same boat going the same speed out on the horizon looks like it is barely moving.
“Since we couldn’t change Huygens’ signal, the only thing we could change was the way Cassini flew,” Maize said. “If we could move Cassini farther away and make it appear as if Huygens was moving slower, it would receive lander’s radio waves at a lower frequency, solving the problem.”

Maize said it took two years of “fancy coding modifications and some pretty amazing trajectory computations.” Huygens’ landing was also delayed two months for the new trajectory that was needed overcome the radio system design flaw.

Additionally, with Cassini needing to be farther away from Huygens than originally planned, it would eventually fly out of range to capture all of Huygens’ data. Astronomers instigated a plan where radio telescopes around the world would listen for Huygens’ faint signals and capture anything Cassini missed.

Huygens was released from the Cassini spacecraft on Christmas Day 2004, and arrived at Titan on January 14, 2005. The probe began transmitting data to Cassini four minutes into its descent through Titan’s murky atmosphere, snapping photos and taking data all the while. Then it touched down, the first time a probe had landed on an extraterrestrial world in the outer Solar System.

Because of the communication problem, Huygens was not able to gather as much information as originally planned, as it could only transmit on one channel instead of two. But amazingly, Cassini captured absolutely all the data sent by Huygens until it flew out of range.

“It was beautiful,” Maize said, “I’ll never forget it. We got it all, and it was a wonderful example of international cooperation. The fact that 19 countries could get everything coordinated and launched in the first place was pretty amazing, but there’s nothing that compares to the worldwide effort we put into recovering the Huygens mission. From an engineering standpoint, that might trump everything else we’ve done on this mission.”

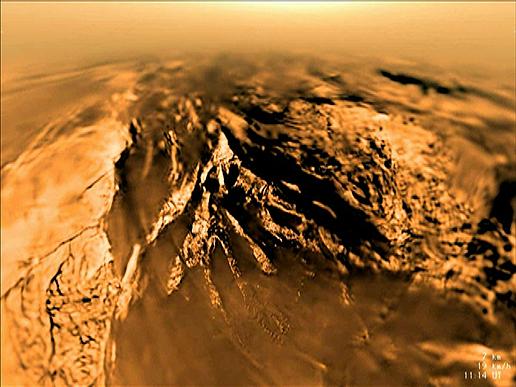
The view of Titan from the descending Huygens spacecraft on January 14, 2005. Credit: ESA/NASA/JPL/University of Arizona.

With its ground-breaking mission, Huygens provided the first real view of the surface of Titan. The data has been invaluable for understanding this unique and mysterious moon, showing geological and meteorological processes that are more similar to those on the surface of the Earth than anywhere else in the Solar System. ESA has details on the top discoveries by Huygens here.

Noted space journalist Jim Oberg has written several detailed and very interesting articles about the Huygens’ recovery, including one at IEEE Spectrum and another at The Space Review. These articles provide much more insight into the test, Smeds’ remarkable insistence for the test, the recovery work that was done and the subsequent success of the mission.

As Oberg says in IEEE Spectrum, “Smeds continued a glorious engineering tradition of rescuing deep-space missions from doom with sheer persistence, insight, and lots of improvisation.”

A modest Smeds was quoted by ESA: “This has happened before. Almost any mission has some design problem,” says Smeds, who says he’s worked on recovering from pre- and post-launch telecom issues that have arisen with several past missions. “To me, it’s just part of my normal work.”

For more stories about Huygens, Cassini and several other current robotic space missions, “Incredible Stories From Space” tells many behind-the-scenes stories from the amazing people who work on these missions.

Land On Titan With Huygens in Beautiful New Video

The view of Titan from the descending Huygens spacecraft on January 14, 2005. Credit: ESA/NASA/JPL/University of Arizona.

On December 25, 2004, the piggybacking Huygens probe was released from the ‘mothership’ Cassini spacecraft and it arrived at Titan on January 14, 2005. The probe began transmitting data to Cassini four minutes into its descent through Titan’s murky atmosphere, snapping photos and taking data all the while. Then it touched down, the first time a probe had landed on an extraterrestrial world in the outer Solar System.

JPL has released a re-mix of the data and images gathered by Huygens 12 years ago in a beautiful new video. This is the last opportunity to celebrate the success of Huygens before Cassini ends its mission in September of 2017.

Watch as the incredible view of Titan’s surface comes into view, with mountains, a system of river channels and a possible lakebed.

After a two-and-a-half-hour descent, the metallic, saucer-shaped spacecraft came to rest with a thud on a dark floodplain covered in cobbles of water ice, in temperatures hundreds of degrees below freezing.

Huygens had to quickly collect and transmit all the images and data it could because shortly after landing, Cassini would drop below the local horizon, “cutting off its link to the home world and silencing its voice forever.”

How much of this video is actual images and data vs computer graphics?

Of course, the clips at the beginning and end of the video are obviously animations of the probe and orbiter. However, the slow descending 1st-person point-of-view video is made using actual images from Huygens. But Huygens did not take a continuous movie sequence, so a lot of work was done by the team that operated Huygens’ optical imager, the Descent Imager/Spectral Radiometer (DISR), to enhance, colorize, and re-project the images into a variety of formats.

The view of the cobblestones and the parachute shadow near the end of the video is also created from real landing data, but was made in a different way from the rest of the descent video, because Huygens’ cameras did not actually image the parachute shadow. However, the upward looking infrared spectrometer took a measurement of the sky every couple of seconds, recording a darkening and then brightening to the unobstructed sky. The DISR team calculated from this the accurate speed and direction of the parachute, and of its shadow to create a very realistic video based on the data.

If you’re a data geek, there are some great videos of Huygens’ data by the University of Arizona Lunar and Planetary Laboratory team, such as this one:

The movie shows the operation of the DISR camera during the descent onto Titan. The almost 4-hour long operation
of DISR is shown in less than five minutes in 40 times actual sped up to landing and 100 times actual speed thereafter.

Erich Karkoschka from the UA team explained what all the sounds in the video are. “All parts of DISR worked together as programmed, creating a harmony,” he said. Here’s the full explanation:

Sound was added to mark various events. The left speaker follows the motion of Huygens. The pitch of the tone indicates the rotational speed. Vibrato indicates vibration of the parachute. Little clicks indicate the clocking of the rotation counter. Noise corresponds to heating of the heat shield, to parachute deployments, to the heat shield release, to the jettison of the DISR cover, and to touch down.

The sound in the right speaker follows DISR data. The pitch of the continuous tone goes with the signal strength. The 13 different chime tones indicate activity of the 13 components of DISR. The counters at the top and bottom of the list get the high and low notes, respectively.

You can see more info and videos created from Huygens’ data here.

Read some reminiscences about Huygens from some of the Cassini team here.

101 Astronomical Events for 2017: A Teaser

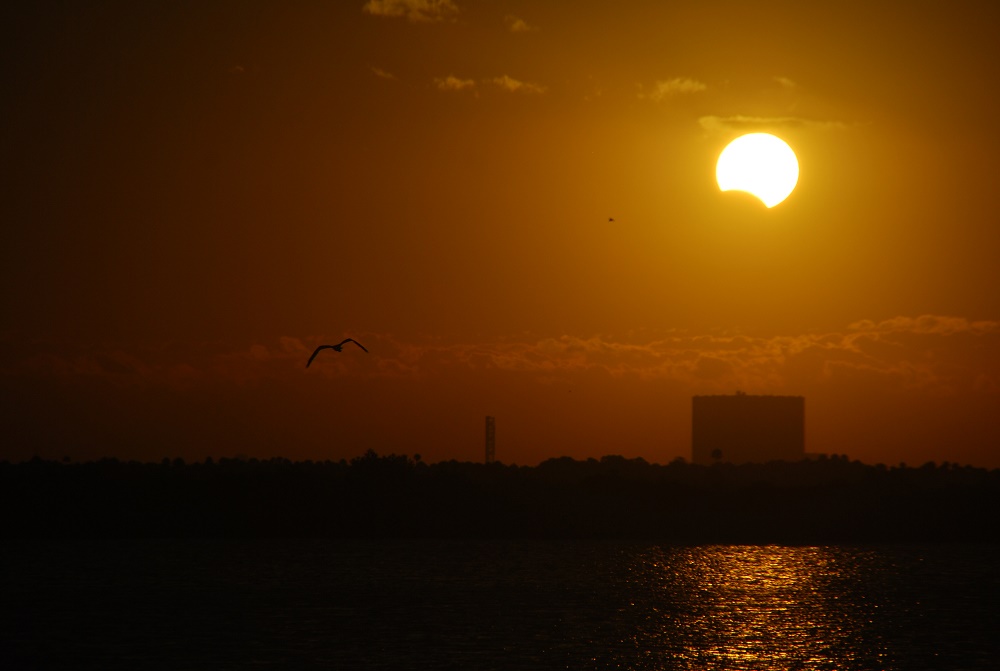
A partial solar eclipse rising over the VAB. Image by author.

It’s that time of year again… time to look ahead at the top 101 astronomical events for the coming year.

And this year ’round, we finally took the plunge. After years of considering it, we took the next logical step in 2017 and expanded our yearly 101 Astronomical Events for the coming year into a full-fledged guide book, soon to be offered here for free download on Universe Today in the coming weeks. Hard to believe, we’ve been doing this look ahead in one form or another now since 2009.

This “blog post that takes six months to write” will be expanded into a full-fledged book. But the core idea is the same: the year in astronomy, distilled down into the very 101 best events worldwide. You will find the best occultations, bright comets, eclipses and much more. Each event will be interspersed with not only the ‘whens’ and ‘wheres,’ but fun facts, astronomical history, and heck, even a dash of astronomical poetry here and there.

It was our goal to take this beyond the realm of a simple almanac or Top 10 listicle, to something unique and special. Think of it as a cross between two classics we loved as a kid, Burnham’s Celestial Handbook and Guy Ottewell’s Astronomical Calendar, done up in as guide to the coming year in chronological format. Both references still reside on our desk, even in this age of digitization.

And we’ve incorporated reader feedback from over the years to make this forthcoming guide something special. Events will be laid out in chronological order, along with a quick-list for reference at the end. Each event is listed as a one- or two-page standalone entry, ready to be individually printed off as needed. We will also include 10 feature stories and true tales of astronomy. Some of these were  culled from the Universe Today archives, while others are new astronomical tales written just for the guide.

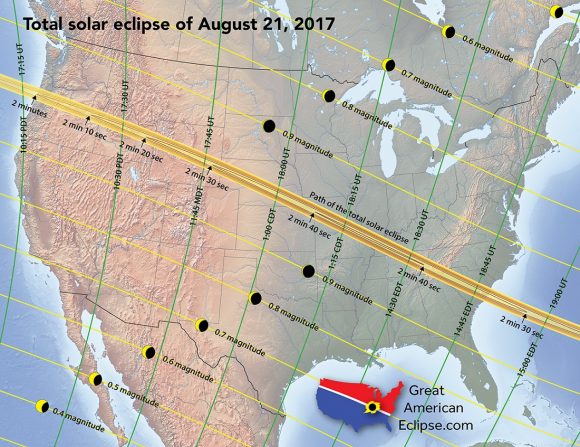
Great American Eclipse
Don’t miss 2017’s only total solar eclipse, crossing the United States! Image credit: Michael Zeiler/The Great American Eclipse.

The Best of the Best

Here’s a preview of some of the highlights for 2017:

-Solar cycle #24 begins to ebb in 2017. Are we heading towards yet another profound solar minimum?

-Brilliant Venus reaches greatest elongation in January and rules the dusk sky.

-45P/Honda-Mrkos-Pajdusakova passes 0.08 AU from Earth on February 11th, its closest passage for the remainder of the century.

-An annular solar eclipse spanning Africa and South America occurs on February 26th.

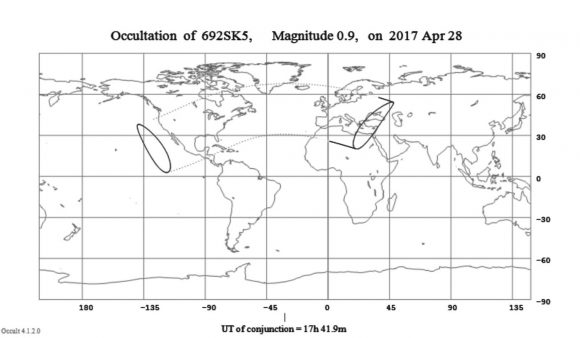
A sample occultation map from the book. Image credit: Occult 4.1.2.

-A fine occultation of Aldebaran by the Moon on March 5th for North America… plus more occultations of the star worldwide during each lunation.

-A total solar eclipse spanning the contiguous United States on August 21st.

-A complex grouping of Mercury, Venus, Mars and the Moon in mid-September.

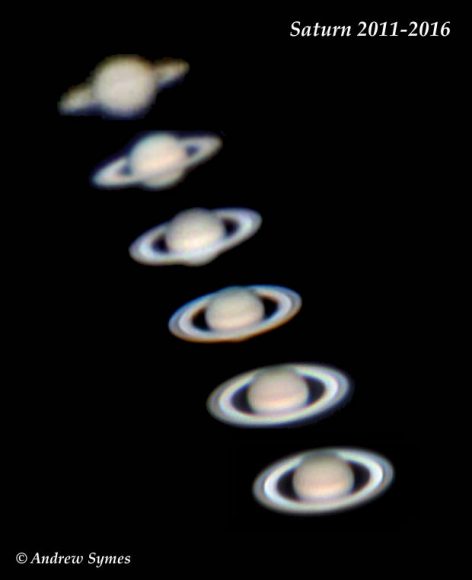
-Saturn’s rings at their widest for the decade.

Getting wider... the changing the of Saturn's rings. Image credit and copyright: Andrew Symes (@FailedProtostar).
Getting wider… the changing face of Saturn’s rings. Image credit and copyright: Andrew Symes (@FailedProtostar).

-A fine occultation of Regulus for North America on October 15th, with  occultations of the star by the Moon during every lunation for 2017.

-Asteroid 335 Roberta occults a +3rd magnitude star for northern Australia…

And that’s just for starters. Entries also cover greatest elongations for the inner planets and oppositions for the outer worlds, the very best asteroid occultations of bright stars, along with a brief look ahead at 2018.

Get ready for another great year of skywatching!

And as another teaser, here’s a link to a Google Calendar download of said events, complied by Chris Becke (@BeckePhysics). Thanks Chris!

Cassini’s First Ring-Grazing Orbit A Success

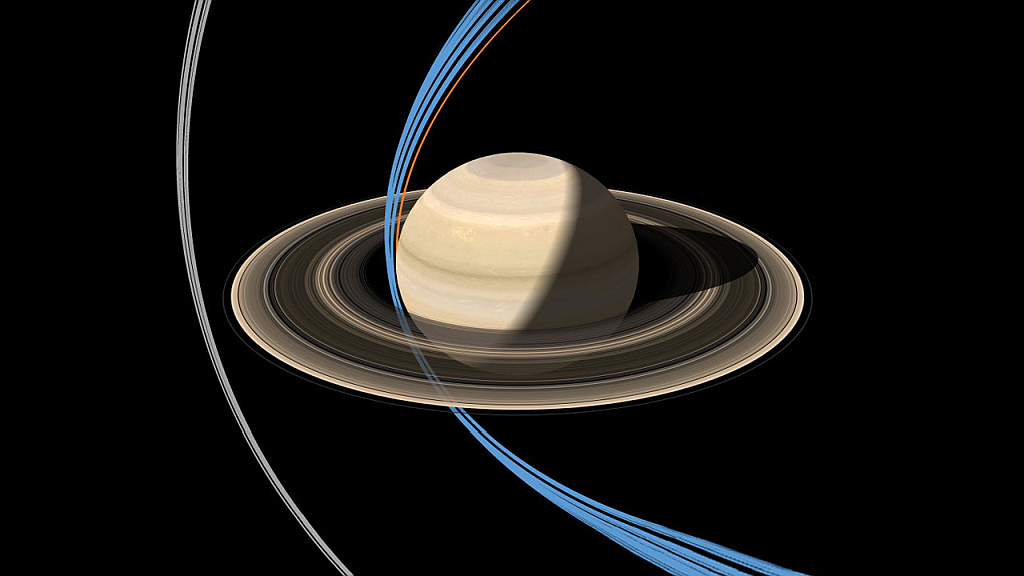
This graphic shows the closest approaches of Cassini's final two orbital phases. Ring-grazing orbits are shown in gray (at left); Grand Finale orbits are shown in blue. The orange line shows the spacecraft's Sept. 2017 final plunge into Saturn. Credit: NASA/JPL-Caltech

The Cassini-Huygens mission is coming to an end.

Cassini was launched in 1997 and reached Saturn in 2004. It will end its mission by plunging into the gas giant. But before then, it will dive through Saturn’s rings a total of 20 times.

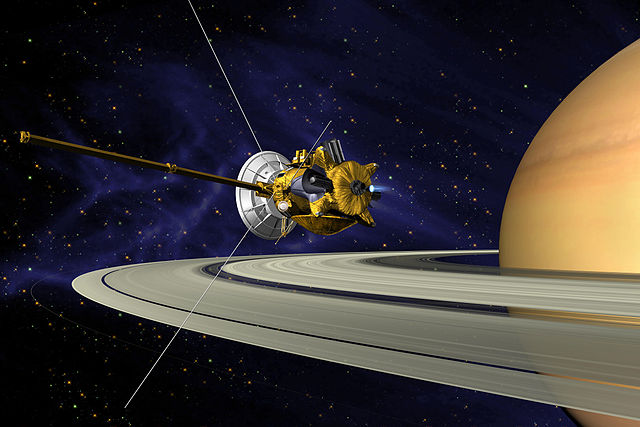
An artist's illustration of Cassini entering orbit around Saturn. Public Domain, https://commons.wikimedia.org/w/index.php?curid=626636
An artist’s illustration of Cassini entering orbit around Saturn. Public Domain, https://commons.wikimedia.org/w/index.php?curid=626636

The first dive through the rings was just completed, and represents the beginning of Cassini’s final mission phase. On December 4th at 5:09 PST the 2,150 kg, plutonium-powered probe, crossed through a faint and dusty ring created by the moons Janus and Epimetheus. This brought it to within 11,000 km of Saturn’s F-ring.

Though the end of a mission might seem sad, people behind the mission are excited about this final phase, a series of close encounters with the most iconic structures in our Solar System: Saturn’s glorious rings.

“This is a remarkable time in what’s already been a thrilling journey.” – Linda Spilker, NASA/JPL

“It’s taken years of planning, but now that we’re finally here, the whole Cassini team is excited to begin studying the data that come from these ring-grazing orbits,” said Linda Spilker, Cassini project scientist at JPL. “This is a remarkable time in what’s already been a thrilling journey.”

Even casual followers of space news have enjoyed the steady stream of eye candy from Cassini. But this first orbit through Saturn’s rings is more about science than pictures. The probe’s cameras captured images 2 days before crossing through the plane of the rings, but not during the closest approach. In future ring-grazing orbits, Cassini will give us some of the best views yet of Saturn’s outer rings and some of the small moons that reside there.

Cassini is about more than just beautiful images though. It’s a vital link in a series of missions that have opened up our understanding of the Solar System we inhabit. Here are some of Cassini’s important discoveries:

New Moons

The Cassini mission discovered 7 new moons orbiting Saturn. Methone, Pallene and Polydeuces were all discovered in 2004. Daphnis, Anthe, and Aegaeon were discovered between 2005 and 2009. The final moon is currently named S/2009 S 1.

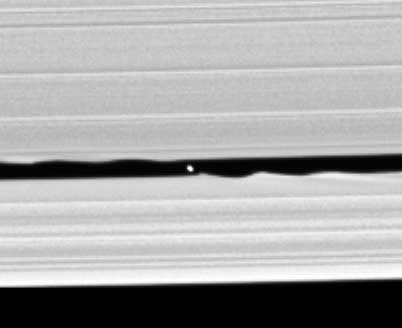
This image shows the moon Daphnis in the Keeler gap in Saturn's A ring. The moon's gravity causes the wave shapes in the rings. By NASA/JPL/Space Science Institute - http://www.esa.int/SPECIALS/Cassini-Huygens/SEM1XQ5TI8E_1.html, Public Domain, https://commons.wikimedia.org/w/index.php?curid=17953334
This image shows the moon Daphnis in the Keeler gap in Saturn’s A ring. The moon’s gravity causes the wave shapes in the rings. By NASA/JPL/Space Science Institute – http://www.esa.int/SPECIALS/Cassini-Huygens/SEM1XQ5TI8E_1.html, Public Domain, https://commons.wikimedia.org/w/index.php?curid=17953334

In 2014, NASA reported that yet another new moon may be forming in Saturn’s A ring.

This Cassini image shows what might be a new moon forming in Saturn's rings. The new moon, if it is one, is only about 1 km in diameter. By NASA/JPL-Caltech/Space Science Institute - http://photojournal.jpl.nasa.gov/jpeg/PIA18078.jpg, Public Domain, https://commons.wikimedia.org/w/index.php?curid=32184174
This Cassini image shows what might be a new moon forming in Saturn’s rings. The new moon, if it is one, is only about 1 km in diameter. By NASA/JPL-Caltech/Space Science Institute – http://photojournal.jpl.nasa.gov/jpeg/PIA18078.jpg, Public Domain, https://commons.wikimedia.org/w/index.php?curid=32184174

Huygens lands on Titan

The Huygens lander detached from the Cassini orbiter on Christmas Day 2004. It landed on the frigid surface of Saturn’s moon Titan after a 2 1/2 hour descent. The lander transmitted 350 pictures of Titan’s descent to the surface. An unfortunate software error caused the loss of another 350 pictures.

The first-ever images of the surface of a new moon or planet are always exciting. This image was taken by the Huygens probe at its landing site on Titan. Image Credit: ESA/NASA/JPL/University of Arizona

Enceladus Flyby

Cassini performed several flybys of the moon Enceladus. The first was in 2005, and the last one was in 2015. The discovery of ice-plumes and a salty liquid ocean were huge for the mission. The presence of liquid water on Enceladus makes it one of the most likely places for microbial life to exist in our Solar System.

In 2005 Cassini discovered jets of water vapor and ice erupting form the surface of Enceladus. The water could be from an subsurface sea. Image Credit: Cassini Imaging Team, SSI, JPL, ESA, NASA

Each of Cassini’s final ring-grazing orbits will last one week. Cassini’s final orbit will bring it close to Saturn’s moon Titan. That encounter will change Cassini’s path. Cassini will leap over the rings and make the first of 22 plunges through the gap between Saturn and its rings.

In September 2017, the Cassini probe will finally reach the end of its epic mission. In order to prevent any possible contamination of Saturn’s moons, the probe will make one last glorious plunge into Saturn’s atmosphere, transmitting data until it is destroyed.

The Cassini mission is a joint mission between the European Space Agency, NASA, and the Italian Space Agency.