Ancient Astronomical Calendar Discovered in Scotland Predates Stonehenge by 6,000 Years

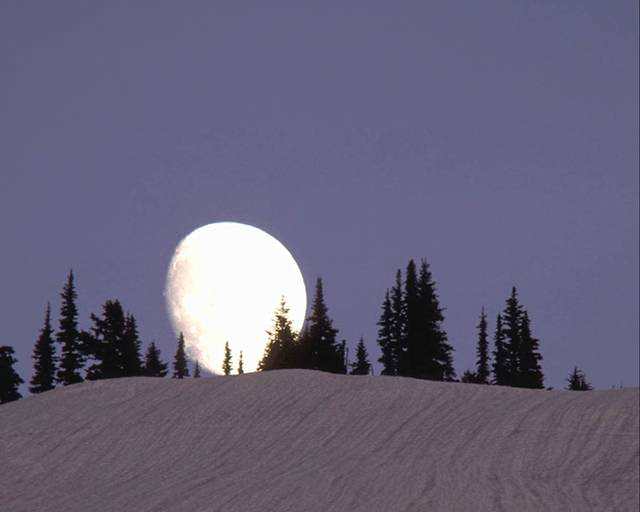
A wintertime rising gibbous Moon. (Image credit: Art Explosion).

A team from the University of Birmingham recently announced an astronomical discovery in Scotland marking the beginnings of recorded time.

Announced last month in the Journal of Internet Archaeology, the Mesolithic monument consists of a series of pits near Aberdeenshire, Scotland. Estimated to date from 8,000 B.C., this 10,000 year old structure would pre-date calendars discovered in the Fertile Crescent region of the Middle East by over 5,000 years.

But this is no ordinary wall calendar.

Originally unearthed by the National Trust for Scotland in 2004, the site is designated as Warren Field near the town of Crathes. It consists of 12 pits in an arc 54 metres long that seem to correspond with 12 lunar months, plus an added correction to bring the calendar back into sync with the solar year on the date of the winter solstice.
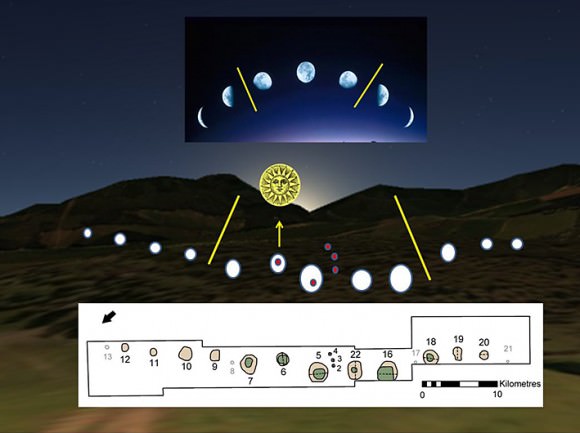
Diagram...
A diagram of the Warren Field site, showing the 12 pits (below) and the alignment with the phases of the Moon plus the rising of the winter solstice Sun. Note: the scale should read “0-10  metres.” (Credit: The University of Birmingham).

“The evidence suggests that hunter-gatherer societies in Scotland had both the need and sophistication to track time across the years, to correct for seasonal drift of the lunar year” said team leader and professor of Landscape Archaeology at the University of Birmingham Vince Gaffney.

We talked last week about the necessity of timekeeping as cultures moved from a hunter-gatherer to agrarian lifestyle. Such abilities as marking the passage of the lunar cycles or the heliacal rising of the star Sirius gave cultures the edge needed to dominate in their day.

For context, the pyramids on the plains of Giza date from around 2500 B.C., The Ice Man on display in Bolzano Italy dates from 3,300 B.C., and the end of the last Ice Age was around 20,000 to 10,000 years ago, about the time that the calendar was constructed.

“We have been taking photographs of the Scottish landscape for nearly 40 years, recording thousands of archaeological sites that would never have been detected from the ground,” said manager of Aerial projects of the Royal Commission of Aerial Survey Projects Dave Cowley. “It’s remarkable to think that our aerial survey may have helped to find the place where time was invented.”

The site at Warren Field was initially discovered during an aerial survey of the region.

Vince Gaffney professor of Landscape and Archaeology at University of Birmingham in Warren Field, Crathes, Aberdeenshire where the discovery was made.
Vince Gaffney, professor of Landscape and Archaeology at University of Birmingham in Warren Field, Crathes, Aberdeenshire where the discovery was made. (Credit: The University of Birmingham).

The use of such a complex calendar by an ancient society also came as a revelation to researchers. Emeritus Professor of Archaeoastronomy at the University of Leicester Clive Ruggles notes that the site “represents a combination of several different cycles which can be used to track time symbolically and practically.”

The lunar synodic period, or the span of time that it takes for the Moon to return to the same phase (i.e., New-to-New, Full-to-Full, etc) is approximately 29.5 days. Many cultures used a strictly lunar-based calendar composed of 12 synodic months. The Islamic calendar is an example of this sort of timekeeping still in use today.

However, a 12 month lunar calendar also falls out of sync with our modern Gregorian calendar by 11 days (12 on leap years) per year.

The familiar Gregorian calendar is at the other extreme, a calendar that is strictly solar-based.  The Gregorian calendar was introduced in 1582 and is still in use today. This reconciled the 11 minute per year difference between the Julian calendar and the mean solar year, which by the time of Pope Gregory’s reform had already caused the calendar to “drift” by 10 days since the 1st Council of Nicaea 325 AD.
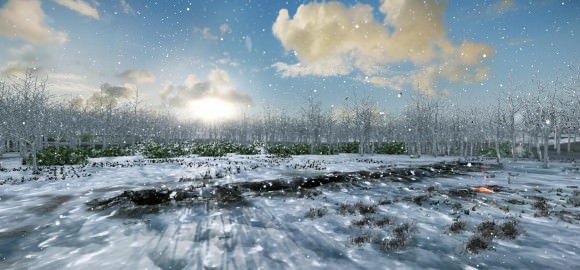
Artist’s conception of the Warren Field site during the winter solstice. (Credit: The University of Birmingham). Credit: The University of Birmingham

Surprisingly, the calendar discovered at Warren Field may be of a third and more complex variety, a luni-solar calendar. This employs the use of intercalary periods, also known as embolismic months to bring the lunar and solar calendar back into sync.

The modern Jewish calendar is an example of a luni-solar hybrid, which adds an extra month (known as the 2nd Adar or Adar Sheni) every 2-3 years. This will next occur in March 2014.

The Greek astronomer Meton of Athens noted in 5th century B.C. that 235 synodic periods very nearly add up to 19 years, to within a few hours. Today, this period bears his name, and is known as a metonic cycle. The Babylonian astronomers were aware of this as well, and with the discovery at Warren Field, it seems that ancient astronomers in Scotland may have been moving in this direction of advanced understanding as well.

It’s interesting to note that the site at Warren Field also predates Stonehenge, the most famous ancient structure in the United Kingdom by about 6,000 years. 10,000 years ago would have also seen the Earth’s rotational north celestial pole pointed near the +3.9th magnitude star Rukbalgethi Shemali (Tau Herculis) in the modern day constellation of Hercules. This is due to the 26,000 year wobble of our planet’s axis known as the precession of the equinoxes.

The precession of the north celestial pole over millenia. (Credit: Wikimedia Commons graphic under a Creative Commons Attribution 2.5 Generic license. Author: Tau'olunga).
The precession of the north celestial pole over millennia. (Credit: Wikimedia Commons graphic under a Creative Commons Attribution 2.5 Generic license. Author: Tau’olunga).

The Full Moon nearest the winter solstice also marks the “Long Nights Moon,” when the Full Moon occupies a space where the Sun resides during the summer months and  rides high above the horizon for northern observers all night. The ancients knew of the five degree tilt that our Moon has in relation to the ecliptic and how it can ride exceptionally high in the sky every 18.6 years. We’re currently headed towards a ‘shallow year’ in 2015, where the Moon rides low in relation to the ecliptic. From there, the Moon’s path in the sky will get progressively higher each year, peaking again in 2024.

Who built the Warren Field ruins along the scenic Dee Valley of Scotland? What other surprises are in store as researchers excavate the site? One thing is for certain: the ancients were astute students of the sky. It’s fascinating to realize how much of our own history has yet to be told!



Solar Cycle #24: On Track to be the Weakest in 100 Years

Projected vs observed sunspot numbers for solar cycles #23 & #24. (Credit: Hathaway/NASA/MSFC).

Our nearest star has exhibited some schizophrenic behavior thus far for 2013.

By all rights, we should be in the throes of a solar maximum, an 11-year peak where the Sun is at its most active and dappled with sunspots.

Thus far though, Solar Cycle #24 has been off to a sputtering start, and researchers that attended the meeting of the American Astronomical Society’s Solar Physics Division earlier this month are divided as to why.“Not only is this the smallest cycle we’ve seen in the space age, it’s the smallest cycle in 100 years,” NASA/Marshall Space Flight Center research scientist David Hathaway said during a recent press teleconference conducted by the Marshall Space Flight Center.

Cycle #23 gave way to a profound minimum that saw a spotless Sol on 260 out of 365 days (71%!) in 2009. Then, #Cycle 24 got off to a late start, about a full year overdue — we should have seen a solar maximum in 2012, and now that’s on track for the late 2013 to early 2014 time frame. For solar observers, both amateur, professional and automated, it seems as if the Sun exhibits a “split-personality” this year, displaying its active Cycle #24-self one week, only to sink back into a blank despondency the next.

This new cycle has also been asymmetrical as well. One hallmark heralding the start of a new cycle is the appearance of sunspots at higher solar latitudes on the disk of the Sun. These move progressively toward the Sun’s equatorial regions as the cycle progresses, and can be mapped out in what’s known as a Spörer’s Law.

The sunspot number "butterfly" graph, illustrating Spörer's Law that susnpots gradually migrate towards the equator of the Sun as the solar cycle progresses. (Credit: NASA/MSFC).
The sunspot number “butterfly” graph, illustrating Spörer’s Law that susnpots gradually migrate towards the equator of the Sun as the solar cycle progresses. (Credit: NASA/MSFC).

But the northern hemisphere of the Sun has been much more active since 2006, with the southern hemisphere experiencing a lag in activity. “Usually this asymmetry lasts a year or so, and then the hemispheres synchronize,” said Giuliana de Toma of the High Altitude Observatory.

So far, several theories have been put forth as to why our tempestuous star seems to be straying from its usual self. Along with the standard 11-year cycle, it’s thought that there may be a longer, 100 year trend of activity and subsidence known as the Gleissberg Cycle.

The Sun is a giant ball of gas, rotating faster (25 days) at the equator than at the poles, which rotate once every 34.5 days. This dissonance sets up a massive amount of torsion, causing the magnetic field lines to stretch and snap, releasing massive amounts of energy. The Sun also changes polarity with every sunspot cycle, another indication that a new cycle is underway.

But predictions have run the gamut for Cycle #24. Recently, solar scientists have projected a twin peaked solar maximum for later this year, and thus far, Sol seems to be following this modified trend.  Initial predictions by scientists at the start of Cycle #24 was for the sunspot number to have reached 90 by August 2013; but here it is the end of July, and we’re sitting at 68, and it seems that we’ll round out the northern hemisphere Summer at a sunspot number of 70 or so.

Some researchers predict that the following sunspot Cycle #25 may even be absent all together.

“If this trend continues, there will be almost no spots in Cycle 25,” Noted Matthew Penn of the National Solar Observatory, hinting that we may be on the edge of another Maunder Minimum.

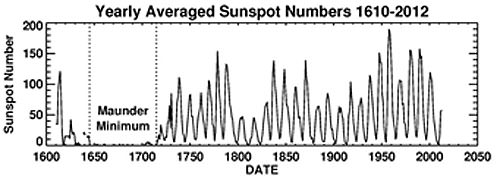
Looking back over solar cycles for the past 500 years. (Credit: D. Hathaway/NASA/MSFC).

The Maunder Minimum was a period from 1645 to 1715 where almost no sunspots were seen. This span of time corresponded to a medieval period known as the Little Ice Age. During this era, the Thames River in London froze, making Christmas “Frost Fairs” possible on the ice covered river. Several villages in the Swiss Alps were also consumed by encroaching glaciers, and the Viking colony established in Greenland perished. The name for the period comes from Edward Maunder, who first noted the minimum in papers published in the 1890s. The term came into modern vogue after John Eddy published a paper on the subject in the journal of Science in 1976. Keep in mind, the data from the period covered by the Maunder Minimum is far from complete— Galileo had only started sketching sunspots via projection only a few decades prior to the start of the Maunder Minimum. But tellingly, there was a span of time in the early 18th century when many researchers supposed that sunspots were a myth! They were really THAT infrequent…

Just what role a pause in the solar cycle might play in the climate change debate remains to be seen. Perhaps, humanity is getting a brief (and lucky) reprieve, a chance to get serious about controlling our own destiny and doing something about anthropogenic climate-forcing. On a more ominous note, however, an extended cooling phase may give us reason to stall on preparing for the inevitable while giving ammunition to deniers, who like to cite natural trends exclusively.

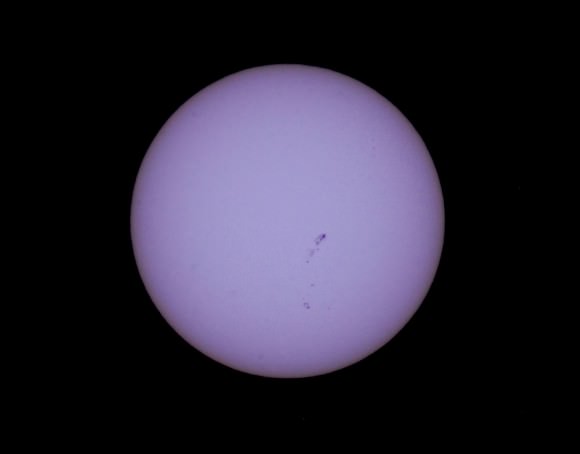
Down but not out? Sol looking more like its solar max-self earlier this month on July 8th. (Photo by author).

Whatever occurs, we now have an unprecedented fleet of solar monitoring spacecraft on hand to watch the solar drama unfold. STEREO A & B afford us a 360 degree view of the Sun. SOHO has now monitored the Sun for the equivalent of more than one solar cycle, and NASA’s Solar Dynamics Observatory has joined it in its scrutiny. NASA’s Interface Region Imaging Spectrograph (IRIS)  just launched earlier this year, and has already begun returning views of the solar atmosphere in unprecedented detail. Even spacecraft such as MESSENGER orbiting Mercury can give us vital data from other vantage points in the solar system.

Cycle #24 may be a lackluster performer, but I’ll bet the Sun has a few surprises in store. You can always get a freak cloud burst, even in the middle of a drought. Plus, we’re headed towards northern hemisphere Fall, a time when aurora activity traditionally picks up.

Be sure to keep a (safely filtered) eye on ol’ Sol— it may be the case over these next few years that “no news is big news!”


Happy (or is it Merry?) Aphelion This Friday

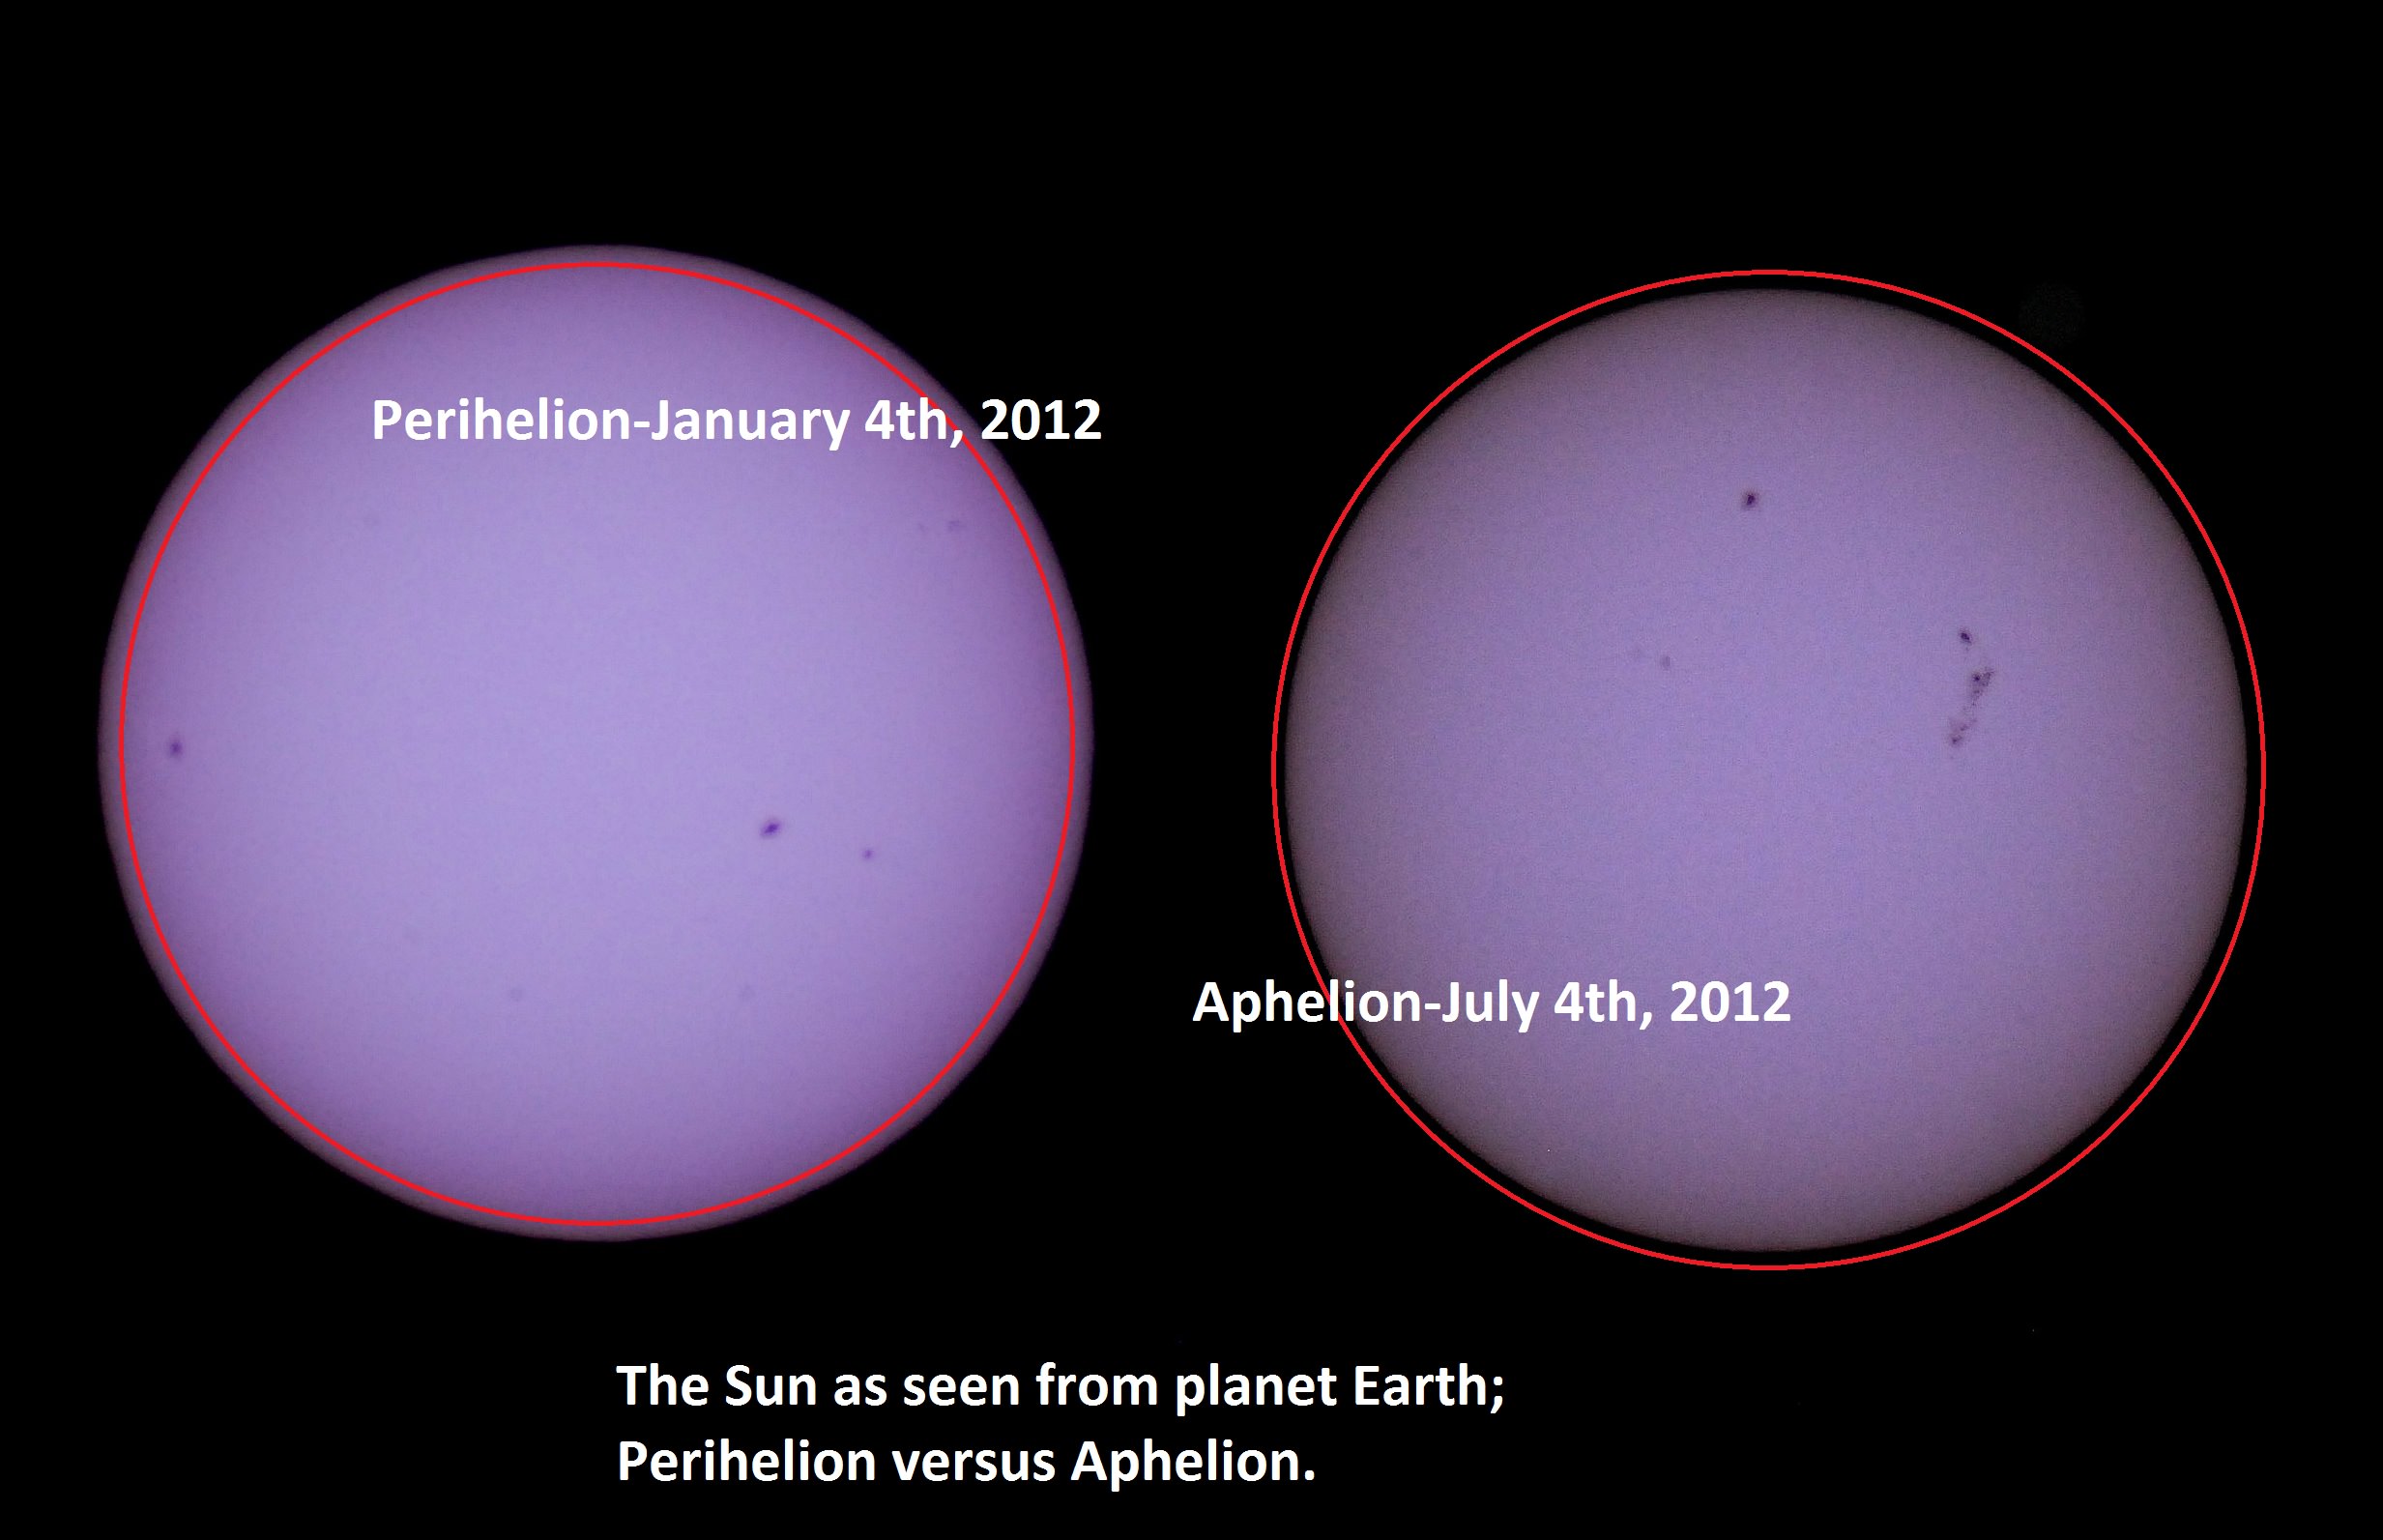
Solar apparent size- perihelion versus aphelion 2012.

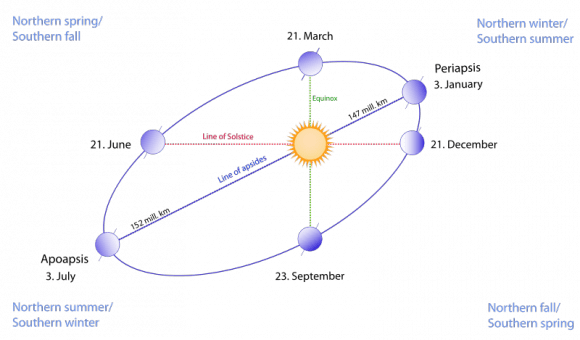
This 4th of July weekend brings us one more reason to celebrate. On July 5th at approximately 11:00 AM EDT/15:00 UT, our fair planet Earth reaches aphelion, or its farthest point from the Sun at 1.0167 Astronomical Units (A.U.s) or 152,096,000 kilometres distant.

Though it may not seem it to northern hemisphere residents sizzling in the summer heat, we’re currently 3.3% farther from the Sun than our 147,098,290 kilometre (0.9833 A.U.) approach made in early January.

We thought it would be a fun project to capture this change. A common cry heard from denier circles as to scientific facts is “yeah, but have you ever SEEN it?” and in the case of the variation in distance between the Sun and the Earth from aphelion to perihelion, we can report that we have!

We typically observe the Sun in white light and hydrogen alpha using a standard rig and a Coronado Personal Solar Telescope  on every clear day. We have two filtered rigs for white light- a glass Orion filter for our 8-inch Schmidt-Cassegrain, and a homemade Baader solar filter for our DSLR. We prefer the DSLR rig for ease of deployment. We’ve described in a previous post how to make a safe and effective solar observing rig using Baader solar film.

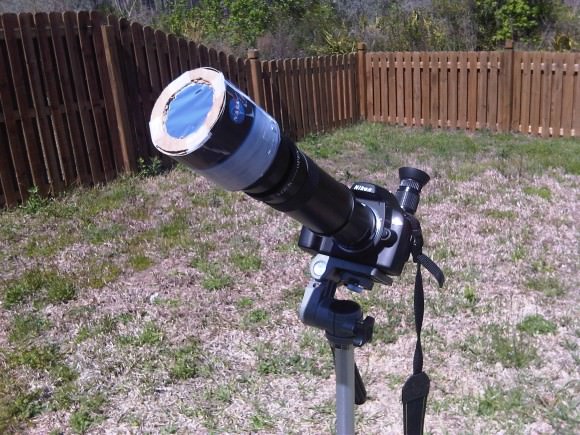
Our solar imaging rig.
Our primary solar imaging rig. A Nikon D60 DSLR with a 400mm lens + a 2x teleconverter and Baader solar filter. Very easy to employ!

We’ve been imaging the Sun daily for a few years as part of our effort to make a home-brewed “solar rotation and activity movie” of the entire solar cycle.  We recently realized that we’ve imaged Sol very near aphelion and perihelion on previous years with this same fixed rig, and decided to check and see if we caught the apparent size variation of our nearest star. And sure enough, comparing the sizes of the two disks revealed a tiny but consistent variation.

It’s a common misconception that the seasons are due to our distance from the Sun. The insolation due to the 23.4° tilt of the rotational axis of the Earth is the dominant driving factor behind the seasons. (Don’t they still teach this in grade school? You’d be surprised at the things I’ve heard!) In the current epoch, a January perihelion and a July aphelion results in milder climatic summers in the northern hemisphere and more severe summers in the southern. The current difference in solar isolation between hemispheres due to eccentricity of Earth’s orbit is 6.8%.

The orbit of the Earth also currently has one of the lowest eccentricities (how far it deviates for circular) of the planets at 0.0167, or 1.67%. Only Neptune (1%) and Venus (0.68%) are “more circular.”

The orbital eccentricity of the Earth also oscillates over a 413,000 year period between 5.8% (about the same as Saturn) down to 0.5%. We’re currently at the low end of the scale, just below the mean value of 2.8%.

Variation in eccentricity is also coupled with other factors, such as the change in axial obliquity the precession of the line of apsides and the equinoxes to result in what are known as Milankovitch cycles. These variations in extremes play a role in the riddle of climate over hundreds of thousands of years.  Climate change deniers like to point out that there are large natural cycles in the records, and they’re right – but in the wrong direction. Note that looking solely at variations in the climate due to Milankovitch cycles, we should be in a cooling trend right now.  Against this backdrop, the signal of anthropogenic climate forcing and global dimming of albedo (which also masks warming via cloud cover and reflectivity) becomes even more ominous.

Aphelion can presently fall between July 2nd at 20:00 UT (as it did last in 1960) and July 7th at 00:00 UT as it last did on 2007.  The seemingly random variation is due to the position of the Earth with respect to the barycenter of the Earth-Moon system near the time of aphelion. The once every four year reset of the leap year (with the exception of the year 2000!) also plays a lesser role.

Perihelion and aphelion vs the solstices and equinoxes, an exagarated view.
Perihelion and aphelion vs the solstices and equinoxes, an exaggerated view. (Wikimedia Commons image under a 3.0 Unported Attribution-Share Alike license. Author Gothika/Doudoudou).

I love observing the Sun any time of year, as its face is constantly changing from day-to-day. There’s also no worrying about light pollution in the solar observing world, though we’ve noticed turbulence aloft (in the form of bad seeing) is an issue later in the day, especially in the summertime.  The rotational axis of the Sun is also tipped by about 7.25° relative to the ecliptic, and will present its north pole at maximum tilt towards us on September 8th. And yes, it does seem strange to think in terms of “the north pole of the Sun…”

We’re also approaching the solar maximum through the 2013-2014 time frame, another reason to break out those solar scopes.  This current Solar Cycle #24 has been off to a sputtering start, with the Sun active one week, and quiet the next. The last 2009 minimum was the quietest in a century, and there’s speculation that Cycle #25 may be missing all together.

And yes, the Moon also varies in its apparent size throughout its orbit as well, as hyped during last month’s perigee or Super Moon. Keep those posts handy- we’ve got one more Super Moon to endure this month on July 22nd. The New Moon on July 8th at 7:15UT/3:15 AM EDT will occur just 30 hours after apogee, and will hence be the “smallest New Moon” of 2013, with a lot less fanfare. Observers worldwide also have a shot at catching the slender crescent Moon on the evening of July 9th. This lunation and the sighting of the crescent Moon also marks the start of the month of Ramadan on the Muslim calendar.

Be sure to observe the aphelion Sun (with proper protection of course!) It would be uber-cool to see a stitched together animation of the Sun “growing & shrinking” from aphelion to perihelion and back. We could also use a hip Internet-ready meme for the perihelion & aphelion Sun- perhaps a “MiniSol?” A recent pun from Dr Marco Langbroek laid claim to the moniker of “#SuperSun;” in time for next January’s perihelion;

Marco quote

Could a new trend be afoot?

Yet Another X-Class Flare From AR 1748

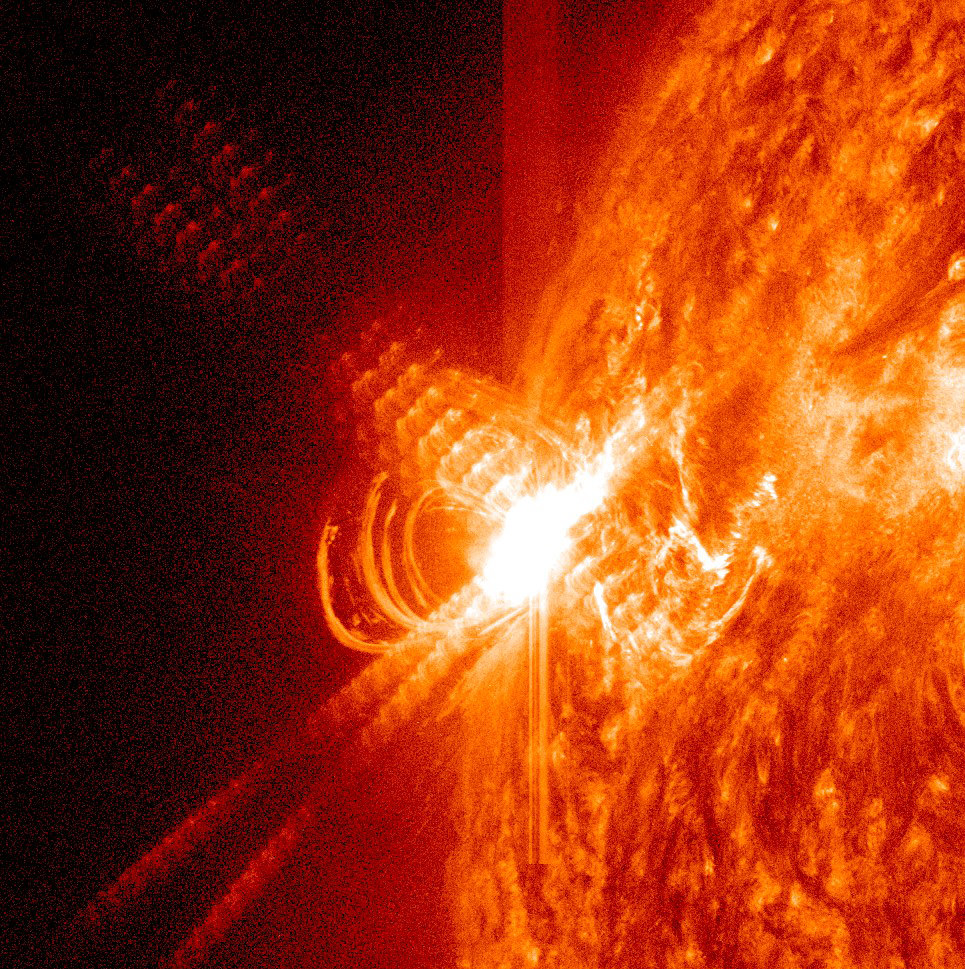
An X3.2-class flare observed by SDO's AIA instrument at 0114 UT on May 14 (NASA/SDO/AIA)

Last night, as Commander Hadfield and the Expedition 35 crew were returning to Earth in their Soyuz spacecraft, the Sun unleashed yet another X-class flare from active region 1748, the third and most powerful eruption yet from the sunspot region in the past 24 hours — in fact, at a level of X3.2, it was the most intense flare observed all year.

And with this dynamic sunspot region just now coming around the Sun’s limb and into view, we can likely expect much more of this sort of activity… along with a steadily increasing chance of an Earth-directed CME.

According to SpaceWeather.com AR1748 has produced “the strongest flares of the year so far, and they signal a significant increase in solar activity. NOAA forecasters estimate a 40% chance of more X-flares during the next 24 hours.”

(Find out more about the classification of solar flares here.)

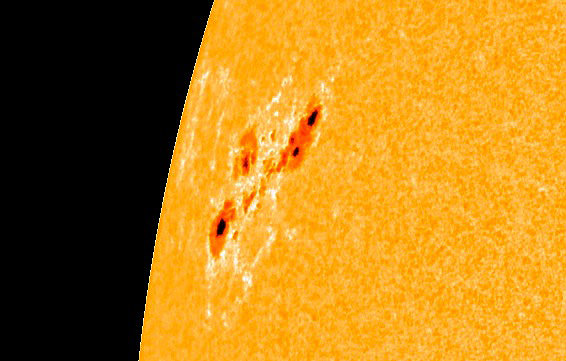
The sunspot region just became fully visible to Earth during the early hours of May 13 (UT).

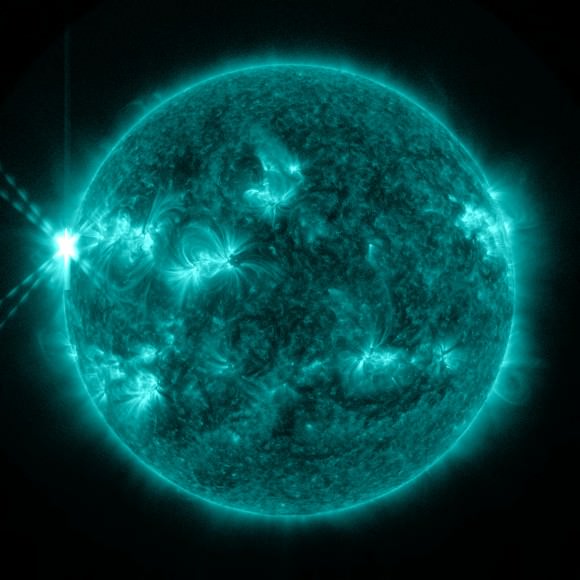
Most recent SDO image of AR1748 (NASA/SDO/AIA)

Sunspots are regions where the Sun’s internal magnetic fields rise up through its surface layers, preventing convection from taking place and creating cooler, optically darker areas. They often occur in pairs or clusters, with individual spots corresponding to the opposite polar ends of magnetic lines.

Sunspots may appear dark because they are relatively cooler than the surrounding area on the Sun’s photosphere, but in ultraviolet and x-ray wavelengths they are brilliantly white-hot. And although sunspots look small compared to the Sun, they are often many times larger than Earth.

Read more: How Big Are Sunspots?

According to SDO project scientists Dean Pesnell on the SDO is Go! blog, AR1748 is not only rapidly unleashing flares but also changing shape.

“The movies show that the sunspot is changing, the two small groups on the right merging and the elongated spot on the lower left expanding out to join them,” Pesnell wrote earlier today.

Of course, as a solar scientist Pesnell is likely much more excited about the chance to observe further high-intensity activity than he is concerned about any dramatically negative impacts of a solar storm here on Earth, which, although possible, are still statistically unlikely.

“Great times ahead for this active region!” he added enthusiastically.

For updated information on AR1748’s activity visit SpaceWeather.com and NASA’s SDO site, and also check out TheSunToday.org run by solar physicist C. Alex Young, Ph.D.

Images courtesy of NASA/SDO and the AIA, EVE, and HMI science teams.


The Sun Blasts Out Two X-Class Flares, Strongest of the Year

A close-up of an an X1.7-class solar flare on May 12, 2013 as seen by NASA's Solar Dynamics Observatory. Credit: NASA/SDO/AIA. Click for larger version.

The Sun gets active! On May 12, 2013, the Sun emitted what NASA called a “significant” solar flare, classified as an X1.7, making it the first X-class flare of 2013. Then earlier today, May 13, 2013, the Sun let loose with an even stronger flare, an X2.8-class. Both flares took place just beyond the limb of the Sun, and were also associated with another solar phenomenon, a coronal mass ejection (CME) which sent solar material out into space.

Neither CME was Earth-directed, and according to SpaceWeather.com, no planets were in the line of fire. However, the CMEs appear to be on course to hit NASA’s Epoxi, STEREO-B and Spitzer spacecraft on May 15-16. NASA said their mission operators have been notified, and if warranted, operators can put spacecraft into safe mode to protect the instruments. Experimental NASA research models show that the CMEs were traveling at about 1,930 km/second (1,200 miles per second) when they left the Sun.

The sunspot associated with these flares is just coming into view, and the next 24 to 48 hours should reveal much about the sunspot, including its size, magnetic complexity, and potential for future flares.

See more images and video below:

Both the X1.7 and the X2.8-class solar flare, plus a prominence eruption, all in one video:

SDO image of an X2.8-class flare on May 13, 2013. Credit: NASA/SDO

NASA’s Solar Dynamics Observatory (SDO) captured this X1 flare (largest of the year so far) in extreme UV light:

Comet Lemmon, Now in STEREO

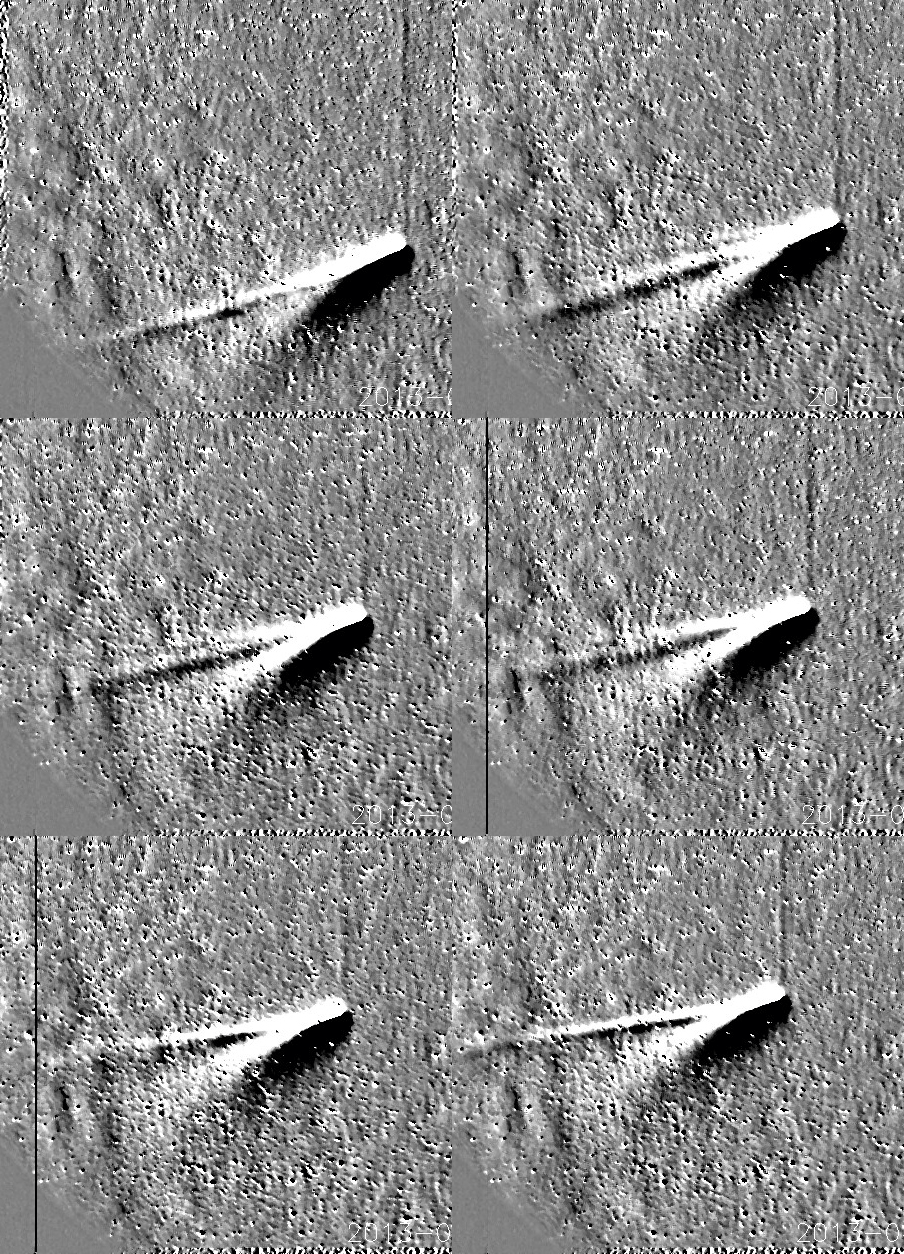
Animation of Comet 2012 F6 Lemmon as seen from NASA's STEREO ahead spacecraft. (Credit: NASA/GFSC; animation created by Robert Kaufman).

An icy interloper was in the sights of a NASA spacecraft this past weekend.

Comet 2012 F6 Lemmon passed through the field of view of NASA’s HI2A camera as seen from its solar observing STEREO Ahead spacecraft. As seen in the animation above put together by Robert Kaufman, Comet Lemmon is now displaying a fine ion and dust tail as it sweeps back out of the inner solar system on its 10,750 year plus orbit.

Comet Lemmon has been a dependable performer for southern hemisphere observers early in 2013. As we reported earlier this month for Universe Today, this comet is now becoming a binocular object low in the dawn sky for northern hemisphere astronomers.

Comet Lemmon passed perihelion at 0.73 astronomical units from the Sun on March 24th. It’s currently in the +4th to +5 magnitude range as it heads northward through the constellation Pisces.

NASA’s twin Solar TErrestrial RElations Observatory (STEREO) spacecraft often catch sungrazing comets as they observe the Sun. Known as STEREO A (Ahead) & STEREO B (Behind), these observatories are positioned in Earth leading and trailing orbits. This provides researchers with full 360 degree coverage of the Sun. Launched in 2006, STEREO also gives us a unique perspective to spy incoming sungrazing comets. Recently, STEREO also caught Comet 2011 L4 PanSTARRS and the Earth as the pair slid into view.

Another solar observing spacecraft, the European Space Agencies’ SOlar Heliospheric Observatory (SOHO) has been a prolific comet discoverer. Amateur comet sleuths often catch new Kreutz group sungrazers in the act. Thus far, SOHO has discovered over 2400 comets since its launch in 1995. SOHO won’t see PanSTARRS or Lemmon in its LASCO C3 camera but will catch a glimpse of Comet 2012 S1 ISON as it nears the Sun late this coming November.

Like SOHO and NASA’s Solar Dynamics Observatory, data from the twin STEREO spacecraft is available for daily perusal on their website. We first saw this past weekend’s animation of Comet Lemmon passing through STEREO’s field of view on the Yahoo STEREOHunters message board.

Here’s a cool but largely unrecognized fact about comets. As they move back out of the solar system, their dust tail streams out ahead of them, driven by the solar wind. I’ve even seen a few science fiction flicks get this wrong. We simply expect comets to always stream their tails out behind them!

Another observatory in our solar observing arsenal has also moved a little closer to operability recently. The Interface Region Imaging Spectrograph (IRIS) arrived at Vandenberg recently in preparation for launch this summer on June 26th. IRIS will be deployed from a Pegasus XL rocket carried aloft by an L-1011. NuSTAR was launched in a similar fashion in 2012. A Pegasus XL rocket will also launch the TESS exoplanet hunting satellite in 2017.

Keep an eye out for Comet Lemmon as it emerges from the dawn twilight in the days ahead. Also, be sure to post those pics to Universe Today’s Flickr community, and keep tabs on the sungrazing action provided to us by SOHO and STEREO!


3 Years of the Sun in 3 Minutes

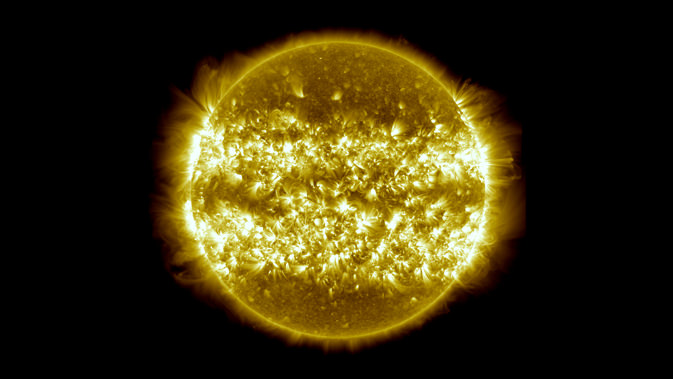
This image is a composite of 25 separate images spanning the period of April 16, 2012, to April 15, 2013. It uses the SDO AIA wavelength of 171 angstroms and reveals the zones on the sun where active regions are most common during this part of the solar cycle. Credit: NASA/SDO/AIA/S. Wiessinger

Since the Solar Dynamics Observatory opened its multi-spectral eyes in space about three years ago, we’ve posted numerous videos and images from the mission, showing incredible views of our dynamic Sun. Scott Wiessinger from Goddard Space Flight Center’s Space Visualization Studio has put together great timelapse compilation of images from the past three years, as well as a one composite still image to “try to encapsulate a timelapse into one static graphic,” he told us via email. “I blended 25 stills from over the last year, and it’s interesting to see the bright bands of active regions.” Scott said he was fascinated by seeing the views of the Sun over a long range of time.

Within the video, (below) there are some great Easter egg hunts – things to see like partial eclipses, flares, comet Lovejoy, and the transit of Venus.

How many can you find?

SDO’s Atmospheric Imaging Assembly (AIA) captures a shot of the sun every 12 seconds in 10 different wavelengths, but the images shown here are based on a wavelength of 171 Angstroms, which is in the extreme ultraviolet range. It shows solar material at around 600,000 Kelvin. In this wavelength it is easy to see the Sun’s 25-day rotation as well as how solar activity has increased over three years as the Sun’s solar cycle has ramped up towards the peak of activity in its 11-year cycle.

You’ll also notice that during the course of the video, the Sun subtly increases and decreases in apparent size. This is because the distance between the SDO spacecraft and the Sun varies over time. The image is, however, remarkably consistent and stable despite the fact that SDO orbits the Earth at 6,876 miles per hour and the Earth orbits the sun at 67,062 miles per hour.

See more views, wavelengths and information at this page at the Space Visualization Studio website.

Solar Storm Blasting to Mars Shuts Down Curiosity – 1st Rocky Sample Results on tap

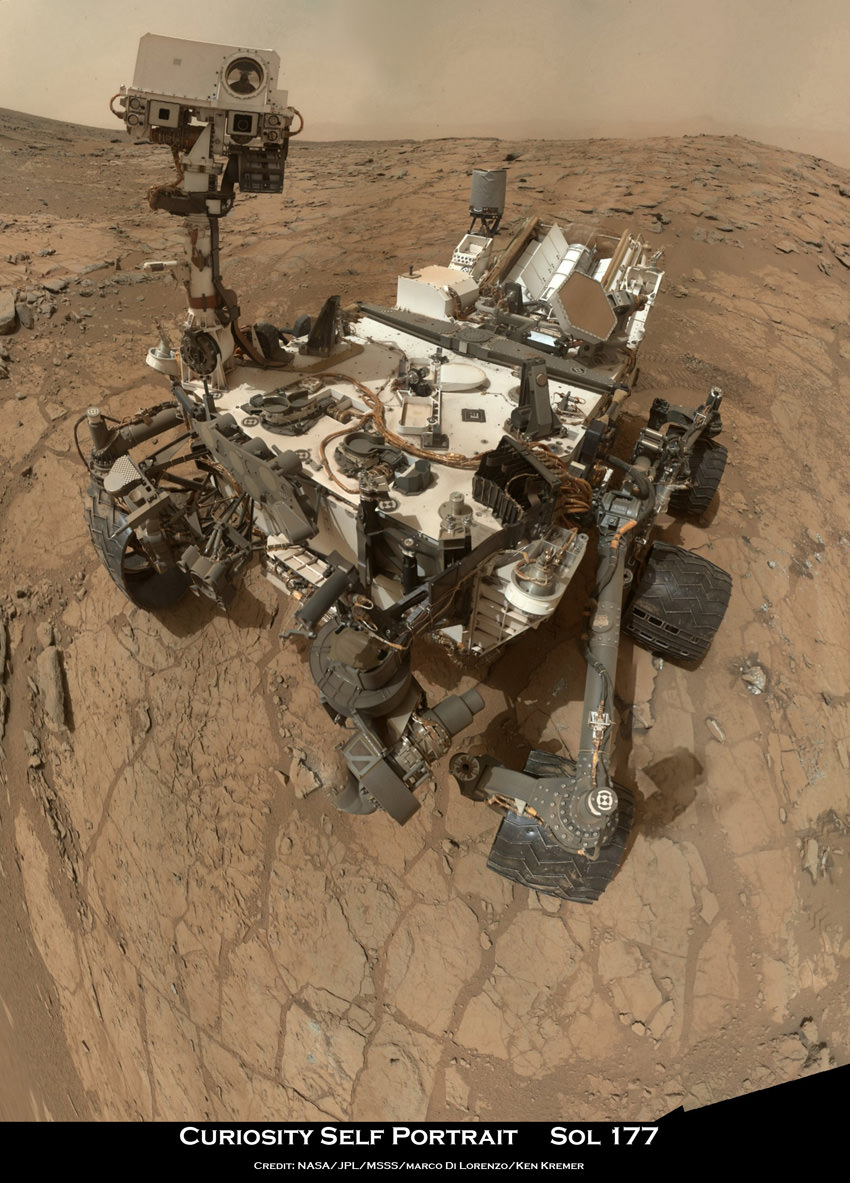
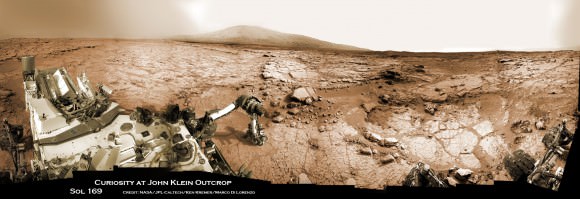
Curiosity Rover snapped this self portrait mosaic with the MAHLI camera while sitting on flat sedimentary rocks at the “John Klein” outcrop where the robot conducted historic first sample drilling inside the Yellowknife Bay basin, on Feb. 8 (Sol 182) at lower left in front of rover. The photo mosaic was stitched from raw images snapped on Sol 177, or Feb 3, 2013, by the robotic arm camera - accounting for foreground camera distortion. Credit: NASA/JPL-Caltech/MSSS/Marco Di Lorenzo/KenKremer (kenkremer.com)

Due to a fast approaching solar storm, NASA has temporarily shut down surface operations of the Curiosity Mars Science Lab (MSL) rover.

NASA took the precautionary measure because ‘a big coronal mass ejection’ was predicted to hit Mars over the next few days starting March 7, or Martian Sol 207 of the mission, researchers said.

The rover team wants to avoid a repeat of the computer memory glitch that afflicted Curiosity last week, and caused the rover to enter a protective ‘safe mode’.

“The rover was commanded to go to sleep,” says science team member Ken Herkenhoff of the US Geological Survey (USGS).

“Space weather can by nasty!”

This is the 2nd shutdown of the 1 ton robot in a week. Curiosity had just been returned to active status over the weekend.

A full resumption of science operations had been anticipated for next week, but is now on hold pending the outcome of effects from the solar storm explosions.

“We are making good progress in the recovery,” said Mars Science Laboratory Project Manager Richard Cook, of NASA’s Jet Propulsion Laboratory, prior to the new solar flare.

“Storm’s a-comin’! There’s a solar storm heading for Mars. I’m going back to sleep to weather it out,” tweeted Curiosity.

Solar flares cause intense bursts of radiation that can damage spacecraft and also harm space faring astronauts, and require the installation of radiation shielding and hardening on space based assets.

Since Mars lacks a magnetic field, the surface is virtually unprotected from constant bombardment by radiation.

NASA’s other spacecraft exploring Mars were unaffected by the solar eruptions – including the long lived Opportunity rover and the orbiters; Mars Odyssey & Mars Reconnaissance Orbiter.

Curiosity has been in the midst of analyzing the historic 1st samples of gray rocky powder ever cored from the interior of a Martian rock about a month ago.

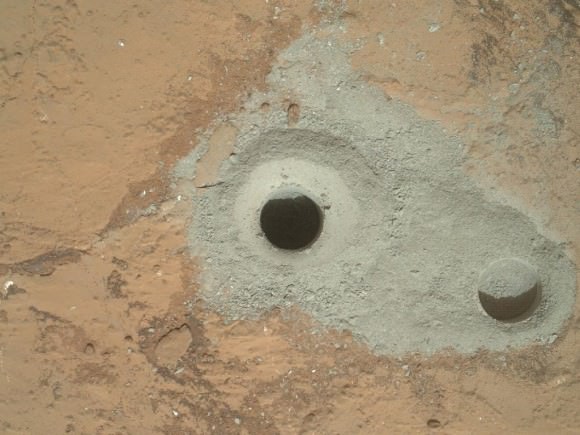
Curiosity’s First Sample Drilling hole is shown at the center of this image in a rock called “John Klein” on Feb. 8, 2013, or Sol 182 operations. The image was obtained by Curiosity’s Mars Hand Lens Imager (MAHLI). The sample-collection hole is 0.63 inch (1.6 centimeters) in diameter and 2.5 inches (6.4 centimeters) deep. The “mini drill” test hole near it is the same diameter, with a depth of 0.8 inch (2 centimeters). Credit: NASA/JPL-Caltech/MSSS Read more: http://www.universetoday.com/99911/historic-mars-rock-drilling-sample-set-for-analysis-by-curiosity-robot-in-search-of-organics/#ixzz2Mu1y6Fpr
Curiosity’s First Sample Drilling hole is shown at the center of this image in a rock called “John Klein” on Feb. 8, 2013, or Sol 182 operations. The image was obtained by Curiosity’s Mars Hand Lens Imager (MAHLI). The sample-collection hole is 0.63 inch (1.6 centimeters) in diameter and 2.5 inches (6.4 centimeters) deep. The “mini drill” test hole near it is the same diameter, with a depth of 0.8 inch (2 centimeters). Credit: NASA/JPL-Caltech/MSSSCuriosity accomplished Historic 1st drilling into Martian rock at John Klein outcrop on Feb 8, 2013 (Sol 182), shown in this context mosaic view of the Yellowknife Bay basin taken on Jan. 26 (Sol 169) where the robot is currently working. The robotic arm is pressing down on the surface at John Klein outcrop of veined hydrated minerals – dramatically back dropped with her ultimate destination; Mount Sharp. Credit: NASA/JPL-Caltech/Ken Kremer/Marco Di Lorenzo Curiosity accomplished Historic 1st drilling into Martian rock at John Klein outcrop on Feb 8, 2013 (Sol 182), shown in this context mosaic view of the Yellowknife Bay basin taken on Jan. 26 (Sol 169) where the robot is currently working. The robotic arm is pressing down on the surface at John Klein outcrop of veined hydrated minerals – dramatically back dropped with her ultimate destination; Mount Sharp. Credit: NASA/JPL-Caltech/Ken Kremer/Marco Di Lorenzo
Eventually, the six-wheeled mega rover will set off on a nearly year long trek to her main destination – the sedimentary layers of the lower reaches of the 3 mile (5 km) high mountain named Mount Sharp – some 6 miles (10 km) away.

So far Curiosity has snapped over 48,000 images and traveled nearly 0.5 miles.

Curiosity’s goal is to assess whether the Gale Crater area on Mars ever offered a habitable zone conducive for Martian microbial life, past or present.

Ken Kremer

A Rather Quiet Solar Maximum … For Now

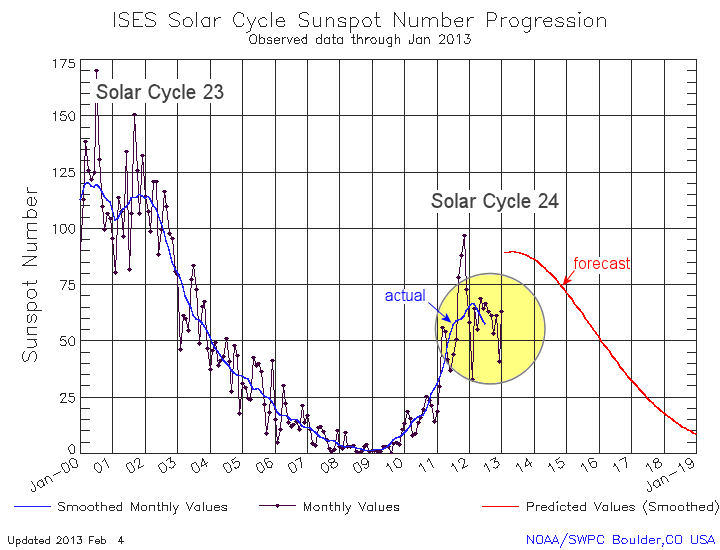
Recent sunspot counts fall short of predictions. Credit: Dr. Tony Philips & NOAA/SWPC.

2013 was supposed to be the year of Solar Max, the peak of the 11-year sunspot cycle. But so far, solar activity has been fairly low, with sunspot numbers well below expectations as well as infrequent solar flares.

Back in 2008, the NOAA/NASA Solar Cycle Prediction Panel, said that due to the extrememly deep and quite solar minimum going on at that time, they anticipated Solar Cycle 24 – our current cycle – to be below average in intensity. They’ve certainly been right about that.

In this video, solar physicist Dean Pesnell of the Goddard Space Flight Center says that this solar max looks different from what we expected because it may end up being “double peaked.”

This video shows the low amount of sunspots so far in 2013:

Read more at Science@NASA
.

NASA: Reaches for New Heights – Greatest Hits Video

Video Caption: At NASA, we’ve been a little busy: landing on Mars, developing new human spacecraft, going to the space station, working with commercial partners, observing the Earth and the Sun, exploring our solar system and understanding our universe. And that’s not even everything.Credit: NASA

Check out this cool action packed video titled “NASA: Reaching for New Heights” – to see NASA’s ‘Greatest Hits’ from the past year

The 4 minute film is a compilation of NASA’s gamut of Robotic Science and Human Spaceflight achievements to explore and understand Planet Earth here at home and the heavens above- ranging from our Solar System and beyond to the Galaxy and the vast expanse of the Universe.

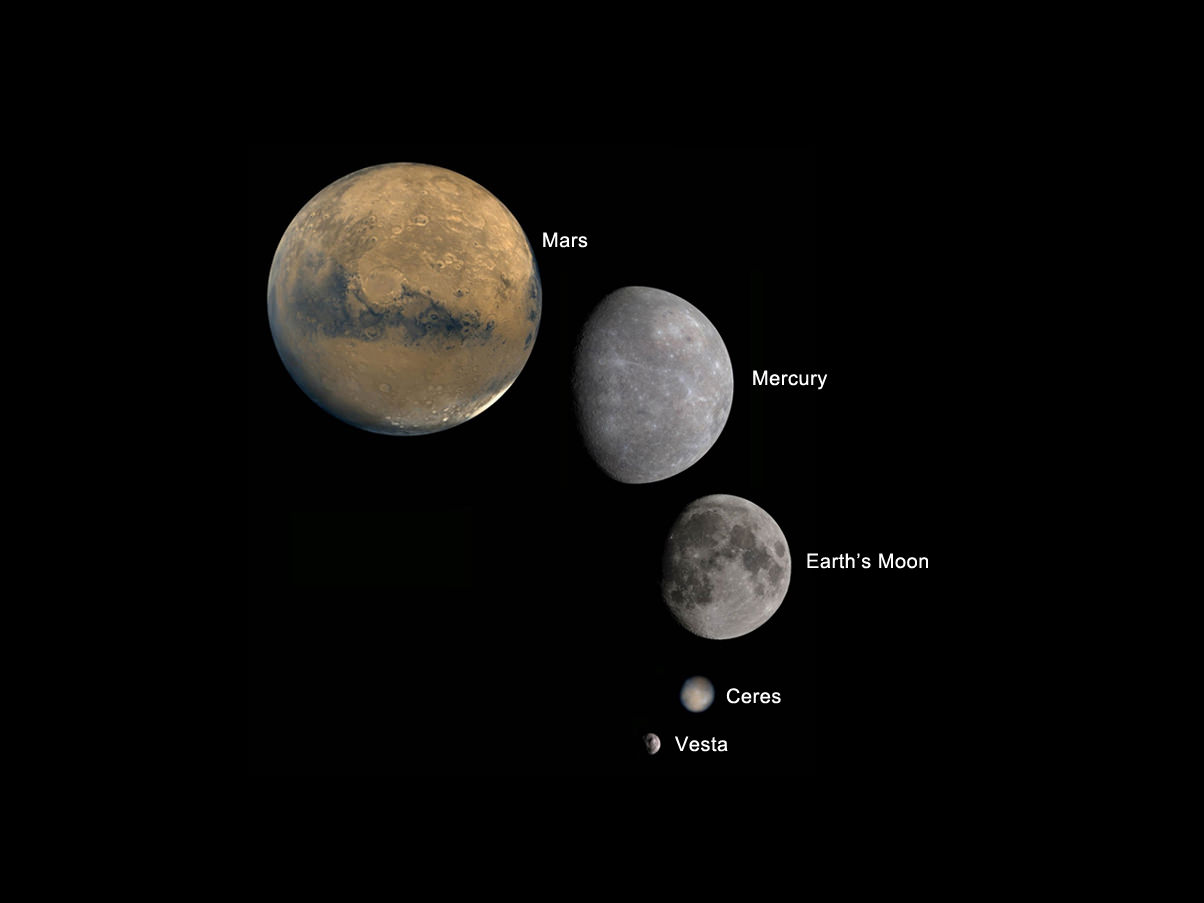
Image caption: Planets and Moons in perspective. Credit: NASA

The missions and programs featured include inspiringly beautiful imagery from : Curiosity, Landsat, Aquarius, GRACE, NuSTAR, GRAIL, Dawn at Asteroid Vesta, SDO, X-48C Amelia, Orion, SLS, Apollo, SpaceX, Sierra Nevada Dream Chaser, Boeing CST-100, Commercial Crew, Hurricane Sandy from the ISS, Robonaut and more !

And even more space exploration thrills are coming in 2013 !

Ken Kremer

IMG_3760a_SpaceX launch 22 May 2012

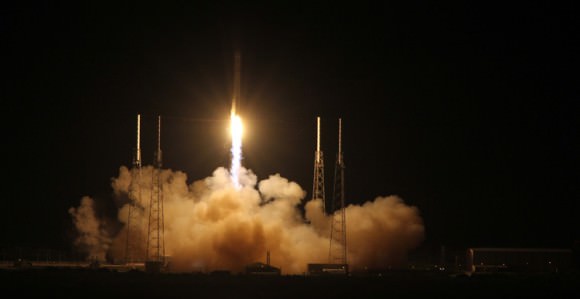
Image caption: SpaceX Falcon 9 rocket blasts off on May 22, 2012 with Dragon cargo capsule from Space Launch Complex-40 at Cape Canaveral Air Force Station, Fla., on the first commercial mission to the International Space Station. The next launch is set for March 1, 2013. Credit: Ken Kremer