Twisting and Eclipsing on the Sun

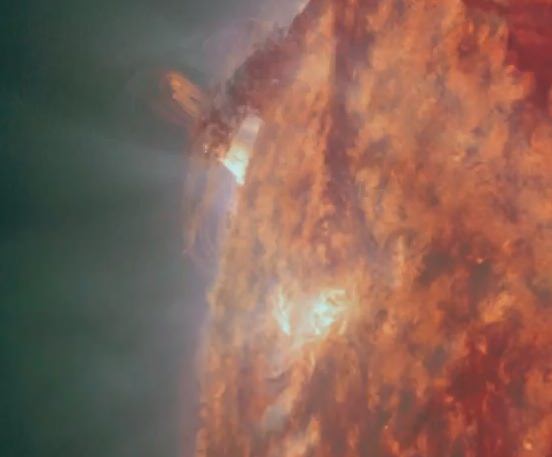
A filament partially blocks SDO's view of erupting plasma on Dec. 9. (NASA/SDO)


A video posted today by the team at NASA’s Solar Dynamics Observatory shows two recent events on the Sun: a twisting prominence and the “eclipse” of a plasma eruption by the structure of a darker, cooler filament. Most impressive!

From the SDO team:

Over the past 24 hours we have seen some beautiful solar events. None of them have a direct impact on Earth, but they are astonishing to watch. It just shows how an active star our Sun really is… far from boring! 

On December 8, 2011 a twisting prominence eruption occurred on the lower eastern limb. The view through the AIA 304 angstrom filter shows us this beautiful eruption. 

A filament partially blocks SDO's view of erupting plasma on Dec. 9. (NASA/SDO)
In the early hours of December 9, 2011 SDO observed a little bit of a different eclipse. An erupting cloud of plasma was eclipsed by a dark magnetic filament. The eruption is still on the far side of the Sun, behind the eastern limb and is slowly moving forward and over the limb sometime next week. 

In front you can observe the filament of relatively cool dark material floating across the Sun’s surface in the foreground. That filament partially blocks the view of the hot plasma eruption behind it. 

Excellent footage of our constantly-active Sun! It’s easy to forget too that these events and structures are many, many times larger than our entire planet… the sheer power of a star is quite an impressive thing to see. Thanks to SDO we get an unblinking front-row seat to all the action!

See more from SDO on the mission site here.

Thanks to Camilla Corona SDO, the team’s mascot, official spokesbird and all-around “hot chick”!

Could Solar Storms ‘Sandblast’ the Moon?

Coronal Mass Ejection as viewed by the Solar Dynamics Observatory on June 7, 2011. A similar type of outburst triggered aurorae during a strong geomagnetic storm in February 1872. Image Credit: NASA/SDO

[/caption]According to a new set of NASA computer simulations, solar storms and Coronal Mass Ejections (CMEs) can erode the lunar surface. Researchers speculate that not only can these phenomena erode the lunar surface, but could also be a cause of atmospheric loss for planets without a global magnetic field, such as Mars.

A team led by Rosemary Killen at NASA’s Goddard Space Flight Center, has written papers exploring different aspects of these phenomena and will appear in an issue of the Journal of Geophysical Research Planets. The team’s research was also presented earlier this week during the fall meeting of the American Geophysical Union.

What are CME’s? Corona Mass Ejections are intense outbursts of the Sun’s usually normal solar wind which consists of electrically charged particles (plasma). CME’s blow outward from the surface of the Sun at speeds in excess of 1.6 million kilometers per hour into space and can contain over a billion tons of plasma in a cloud larger than Earth.

Our Moon has the faintest traces of an atmosphere, which is technically referred to as an exosphere. The lack of any significant atmosphere, combined with the lack of a magnetic field, makes the lunar surface vulnerable to the effects of CME’s.

William Farrell, DREAM (Dynamic Response of the Environment at the Moon) team lead at NASA Goddard, remarked, “We found that when this massive cloud of plasma strikes the Moon, it acts like a sandblaster and easily removes volatile material from the surface. The model predicts 100 to 200 tons of lunar material – the equivalent of 10 dump truck loads – could be stripped off the lunar surface during the typical 2-day passage of a CME.”

While CME’s have been extensively studied, Farrell’s research is the first of its kind that attempts to predict the effects of a CME on the Moon. “Connecting various models together to mimic conditions during solar storms is a major goal of the DREAM project” added Farrell.

When intense heat or radiation is applied to a gas, the electrons can be removed, turning the atoms into ions. This process is referred to as “ionization”, and creates the fourth form of matter, known as plasma. Our Sun’s intense heat and radiation excites gaseous emissions, thus creating a solar wind plasma of charged particles. When plasma ions eject atoms from a surface, the process is called “sputtering”.

The lead author of the research paper Rosemary Killen described this phenomenon: “Sputtering is among the top five processes that create the Moon’s exosphere under normal solar conditions, but our model predicts that during a CME, it becomes the dominant method by far, with up to 50 times the yield of the other methods.”

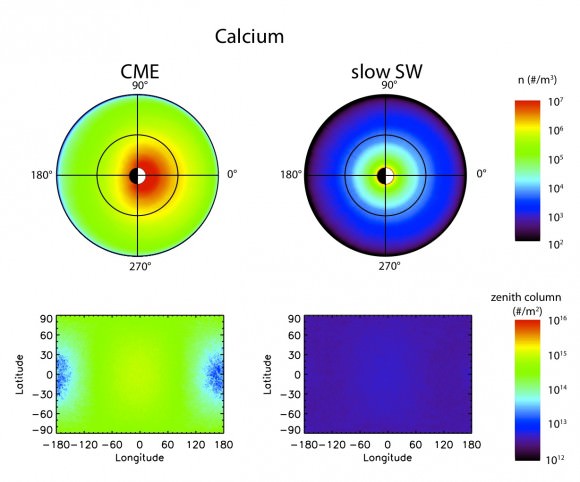
Images from computer simulations of the lunar calcium exosphere during a CME (left) and the slow solar wind (right). Red and yellow indicate a relatively high abundance of calcium atoms while blue, purple, and black indicate a low abundance. The CME produces a much denser exosphere than the slow solar wind. Image Credit: NASA / Johns Hopkins University

In an effort to better test the team’s predictions, studies will be performed using NASA’s Lunar Atmosphere And Dust Environment Explorer (LADEE). Scheduled to launch in 2013 and orbit the Moon, the team is confident that the strong sputtering effect will send atoms from the lunar surface to LADEE’s orbital altitude (20 to 50 km).

Farrell also added, “This huge CME sputtering effect will make LADEE almost like a surface mineralogy explorer, not because LADEE is on the surface, but because during solar storms surface atoms are blasted up to LADEE.”

Affecting more than just our Moon, solar storms also affect Earth’s magnetic field and are the root cause of the Northern and Southern lights (aurorae). The effect solar storms have on Mars is a bit more significant, due in part to the Red Planet’s lack of a planet-wide magnetic field. It is widely theorized that this lack of a magnetic field allows the solar wind and CME’s to erode the martian atmosphere. In late 2013, NASA will launch the Mars Atmosphere and Volatile Evolution (MAVEN) mission. The goal of MAVEN is to orbit Mars and help researchers better understand how solar activity, including CMEs, affects the atmosphere of the red planet.

Learn more about the DREAM team at: http://ssed.gsfc.nasa.gov/dream/
If you’d like to know more about NASA’s Lunar efforts, visit: http://lunarscience.nasa.gov/

Source: NASA Solar System News

Was a Fifth Giant Planet Expelled from Our Solar System?

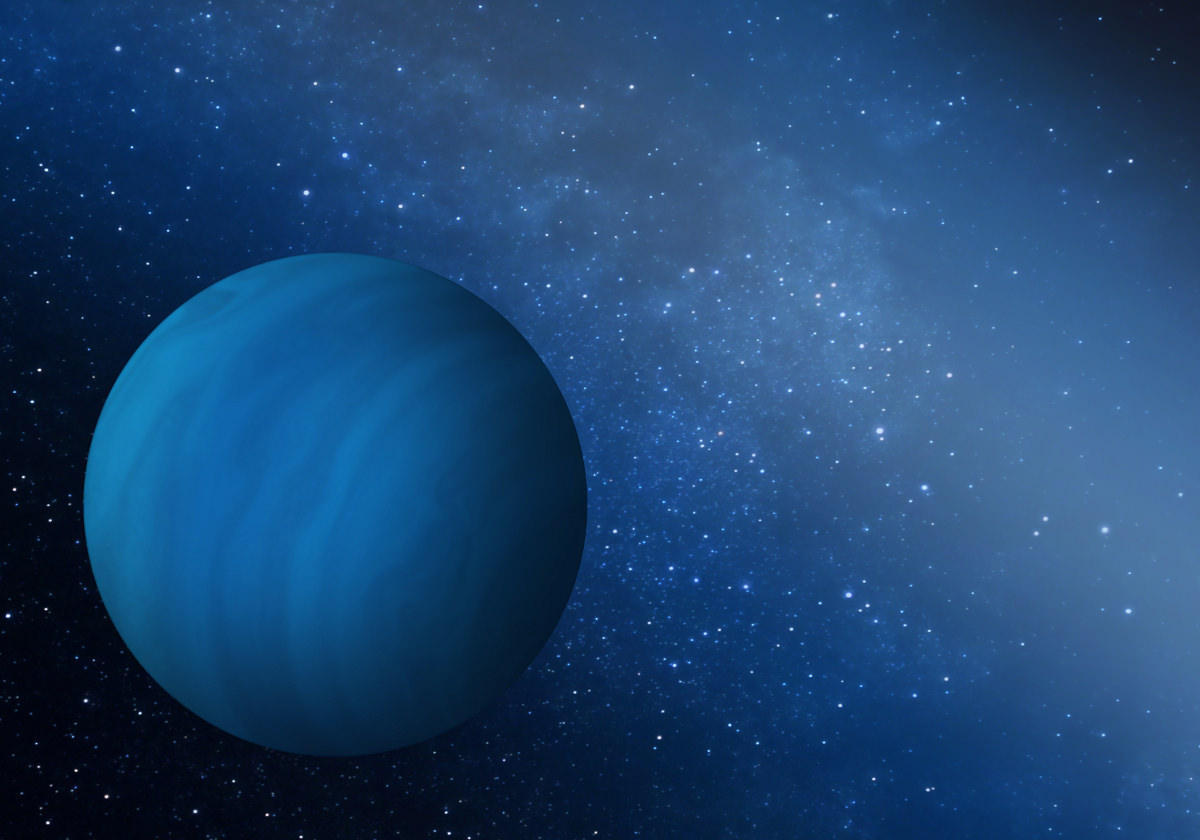
Artist’s impression of a fifth giant planet being ejected from the solar system. Image credit: Southwest Research Institute

[/caption]

Earth’s place in the “Goldilocks” zone of our solar system may be the result of the expulsion of a fifth giant planet from our solar system during its first 600 million years, according to a recent journal publication.

“We have all sorts of clues about the early evolution of the solar system,” said author Dr. David Nesvorny of the Southwest Research Institute. “They come from the analysis of the trans-Neptunian population of small bodies known as the Kuiper Belt, and from the lunar cratering record.”

Nesvorny and his team used the clues they had to build computer simulations of the early solar system and test their theories. What resulted was an early solar system model that has quite a different configuration than today, and a jumbling of planets that may have given Earth the “preferred” spot for life to evolve.


Researchers interpret the clues as evidence that the orbits of Jupiter, Saturn, Uranus and Neptune were affected by a dynamical instability when our solar system was only about half a billion years old. This instability is believed to have helped increase the distance between the giant planets, along with scattering smaller bodies. The scattering of small bodies pushed objects both inward, and outward with some objects ending up in the Kuiper Belt and others impacting the terrestrial planets and the Moon. Jupiter is believed to have scattered objects outward as it moved in towards the sun.

One problem with this interpretation is that slow changes to Jupiter’s orbit would most likely add too much momentum to the orbits of the terrestrial planets. The additional momentum would have possibly caused a collision of Earth with Venus or Mars.

“Colleagues suggested a clever way around this problem,” said Nesvorny. “They proposed that Jupiter’s orbit quickly changed when Jupiter scattered off of Uranus or Neptune during the dynamical instability in the outer solar system.”

Basically if Jupiter’s early migration “jumps,” the orbital coupling between the terrestrial planets and Jupiter is weaker, and less harmful to the inner solar system.

Animation showing the evolution of the planetary system from 20 million years before the ejection to 30 million years after. Five initial planets are shown by red circles, small bodies are in green.
After the fifth planet is ejected, the remaining four planets stabilize after a while, and looks like the outer solar system in the end, with giant planets at 5, 10, 20 and 30 astronomical units.
Click image to view animation. Image Credit: Southwest Research Institute

Nesvorny and his team performed thousands of computer simulations that attempted to model the early solar system in an effort to test the “jumping-Jupiter” theory. Nesvorny found that Jupiter did in fact jump due to gravitational interactions from Uranus or Neptune, but when Jupiter jumped, either Uranus or Neptune were expelled from the solar system. “Something was clearly wrong,” he said.

Based on his early results, Nesvorny added a fifth giant planet, similar to Uranus or Neptune to his simulations. Once he ran the reconfigured simulations, everything fell into place. The simulation showed the fifth planet ejected from the solar system by Jupiter, with four giant planets remaining, and the inner, terrestrial planets untouched.

Nesvorny concluded with, “The possibility that the solar system had more than four giant planets initially, and ejected some, appears to be conceivable in view of the recent discovery of a large number of free-floating planets in interstellar space, indicating the planet ejection process could be a common occurrence.”

If you’d like to read Nesvorny’s full paper, you can access it at: http://arxiv.org/pdf/1109.2949v1

Source: Southwest Research Institute Press Release

Borexino Collaboration Detects pep Neutrinos

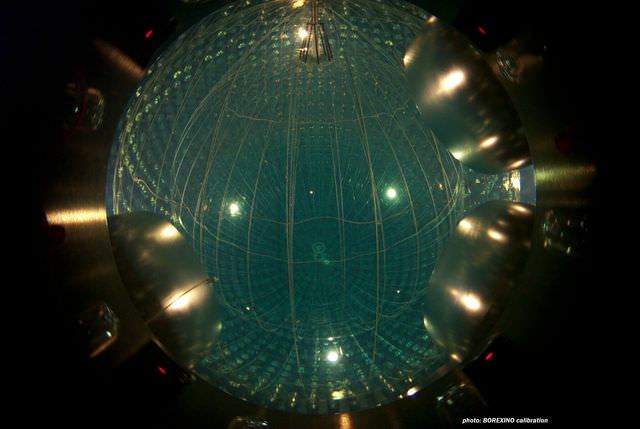
View from inside the Borexino neutrino detector. Image Credit: Borexino Collaboration

[/caption]

Solar neutrino physics has quieted down over the past decade. In the past, it had been a source of major excitement and puzzlement for scientists as they struggled to detect these elusive particles emitted from the fusion reactions in the center of the Sun. Although difficult to detect, they provide the most direct probe of the Solar core. Once astronomers learned to detect them and solved the Solar neutrino problem, they were able to confirm their understanding of the main nuclear reaction that powers the sun, the proton-proton (pp) reaction. But now, astronomers have for the first time, detected the neutrinos of another, far rarer nuclear reaction, the proton-electron-proton (pep) reaction.

At any given time, several separate fusion processes are converting the Sun’s hydrogen into helium, creating energy as a byproduct. The main reaction requires the formation of deuterium (hydrogen with an extra neutron in the nucleus) as the first step in a series of events that leads to the creation of stable helium. This typically takes place by the fusion of two protons which ejects a positron, a neutrino, and a photon. However, nuclear physicists predicted an alternative method of creating the necessary deuterium. In it, a proton and electron fuse first, forming a neutron and a neutrino, and then they join with a second proton. Based on solar models, they predicted that only 0.23% of all Deuterium would be created by this process. Given the already elusive nature of neutrinos, the diminished production rate has made these pep neutrinos even more difficult to detect.

While they may be hard to detect, pep neutrinos are readily distinguishable from ones created by the pp reaction. The key difference is the energy they carry. Neutrinos from the pp reaction have a range of energy up to a maximum of 0.42 MeV, while pep neutrinos carry a very select 1.44 MeV.

However, to pick out these neutrinos, the team had to carefully clean the data of signals from cosmic ray strikes which create muons that could then interact with carbon inside the detector to generate a neutrino with similar energy that might create a false positive. In addition, this process would also create a free neutron. To eliminate these, the team rejected all signals of neutrinos that occurred within a short amount of time from a detection of a free neutron. Overall, this indicated that the detector received 4,300 muons passing through it per day, which would generate 27 neutrons per 100tons of detector liquid, and similarly, 27 false positives.

Removing these detections, the team still found a signal of neutrinos with the appropriate energy and used this to estimate the total amount of pep neutrinos flowing through every square centimeter to be about 1.6 billion, per second, which they note is in agreement with predictions made by the standard model used to describe the interior workings of the Sun.

Aside from further confirming astronomers understanding of the processes that power the Sun, this finding also places constraints on another fusion process, the CNO Cycle. While this process is expected to be minor in the Sun (making only ~2% of all helium produced), it is expected to be more efficient in hotter, more massive stars and dominate in stars with 50% more mass than the Sun. Better understanding the limits of this process would help astronomers to clarify how those stars work as well.

Amateur Captures Coronal Mass Ejection

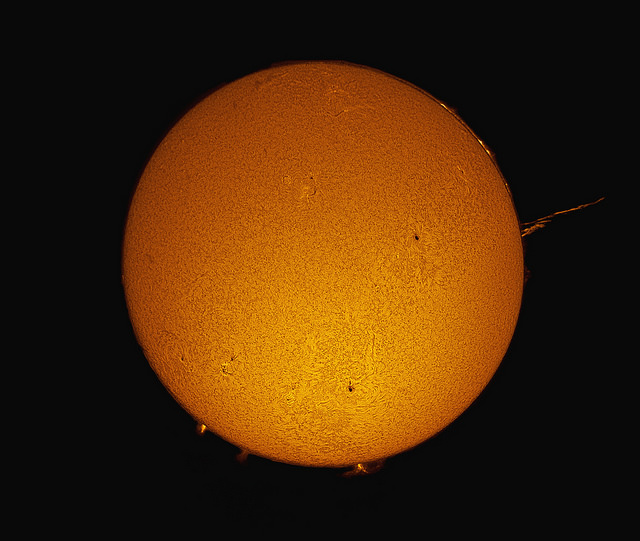
Full DisK H-Alpha Solar Image on October 13, 2011 - Credit: Joe Brimacombe

While you can’t exactly call Joe Brimacombe an amateur astrophotographer, he’s managed to capture an elusive solar event on film… a coronal mass ejection!

A huge, conical-shaped magnetic prominence had been lingering for days and calling attention to itself. On the morning of October 13, 2011 – it delivered.

According to SpaceWeather, much of the prominence fell back to the solar surface, but some of the structure did fly into space, producing a coronal mass ejection. SOHO coronagraphs of the CME show that it is propagating up and out of the plane of the solar system and chances are good that no planet will be hit by the expanding cloud.

But that’s professional instruments! Imagine the excitement between 0200 and 0345 UT at Coral Towers Observatory when Joe was using either a Takahashi Sky 90 or Astrophysics 130 telescope to capture the action! Both telescopes operate at a focal ratio of F/5 and he was using a Coronado Solar Filter and various Skynyx cameras.

Doing what space telescopes do!

Many thanks to Joe Brimacombe for sharing his work – and passion – with us!

Did a Comet Hit Cause an Explosion on the Sun?

This amazing video from the SOHO mission (Solar and Heliospheric Observatory) shows a sun-diving comet hitting the solar surface on October 1, 2011 and unexpectedly a huge explosion occurs shortly after. Are the two events related? Probably not, but solar scientists don’t know for sure. The region where the CME originated was on the opposite side of the Sun from the comet hit, so that is very great distance. Scientists say there is no known mechanism for comets to trigger a CME.

SpaceWeather.com reports that before 2011 most solar physicists would have discounted these two events as being related, but earlier this year, the Solar Dynamics Observatory (SDO) watched another sungrazer comet disintegrate in the Sun’s atmosphere, and it appeared to interact with plasma and magnetic fields in its surroundings as it fell apart. Could a puny comet cause a magnetic instability that might propagate and blossom into a impressive CME? Most likely this is just a coincidence, but this is definitely an event in which solar scientists are taking a closer look. The comet, named SOHO-2143, was just discovered on Sept. 30 by an amateur astronomer.

See below for SDO’s look at two solar flares which also occurred on October 1, showing how events on the Sun can be related.
Continue reading “Did a Comet Hit Cause an Explosion on the Sun?”

Something New On the Sun: SDO Spots a Late Phase in Solar Flares

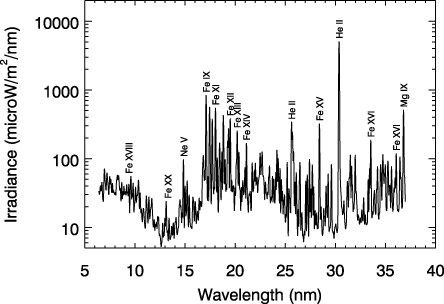
Instead of a conventional picture, the EUV variability Experiment (EVE) on board SDO produces graphs like this, called spectra, that show the total intensity of any given extreme ultraviolet (EUV) wavelength of light coming off of the sun. This image shows a single moment from May 5, 2010. Instead of a conventional picture, the EUV variability Experiment (EVE) on board SDO produces graphs like this, called spectra, that show the total intensity of any given extreme ultraviolet (EUV) wavelength of light coming off of the sun. This image shows a single moment from May 5, 2010. The height of each vertical line represents how much energy is present in that particular wavelength. Spectra like this can measure energy from the sun more comprehensively than instruments that can only “see” a single wavelength. Credit: NASA/SDO/EVE

From a NASA press release:

The Sun’s surface dances. Giant loops of magnetized solar material burst up, twist, and fall back down. Some erupt, shooting radiation flares and particles out into space. Forced to observe this dance from afar, scientists use all the tools at their disposal to look for patterns and connections to discover what causes these great explosions. Mapping these patterns could help scientists predict the onset of space weather that bursts toward Earth from the Sun, interfering with communications and Global Positioning System (GPS) signals.

Analysis of 191 solar flares since May 2010 by NASA’s Solar Dynamics Observatory (SDO) has recently shown a new piece in the pattern: some 15 percent of the flares have a distinct “late phase flare” some minutes to hours later that has never before been fully observed. This late phase of the flare pumps much more energy out into space than previously realized.

“We’re starting to see all sorts of new things,” says Phil Chamberlin, deputy project scientist for SDO at NASA’s Goddard Space Flight Center in Greenbelt, Md. “We see a large increase in emissions a half-hour to several hours later, that is sometimes even larger than the original, traditional phases of the flare. In one case on November 3, 2010, measuring only the effects of the main flare would mean underestimating the amount of energy shooting into Earth’s atmosphere by 70 percent.”

The entire space weather system, from the Sun’s surface to the outer edges of the solar system, is dependent on how energy transfers from one event to another – magnetic reconnection near the Sun transferred to movement energy barreling across space to energy deposited into Earth’s atmosphere, for example. Better understanding of this late phase flare will help scientists quantify just how much energy is produced when the sun erupts.

The team found evidence for these late phases when SDO first began collecting data in May of 2010 and the Sun decided to put on a show. In that very first week, in the midst of an otherwise fairly quiet time for the sun, there sprouted some nine flares of varying sizes. Flare sizes are divided into categories, named A, B, C, M and X, that have long been defined by the intensity of the X-rays emitted at the flare’s peak as measured by the GOES (Geostationary Operational Environmental Satellite) satellite system. GOES is a NOAA-operated network of satellites that has been in geosynchronous orbit near Earth since 1976. One of the GOES satellites measures only X-ray emissions and is a crucial source of information on space weather that the sun sends our way.

That May 2010, however, SDO observed those flares with its multi-wavelength vision. It recorded data indicating that some other wavelengths of light weren’t behaving in sync with the X-rays, but peaked at other times.

“For decades, our standard for flares has been to watch the x-rays and see when they peak,” says Tom Woods, a space scientist at the University of Colorado, Boulder, Colo. who is first author on a paper on this subject that goes online September 7 in the Astrophysical Journal. “That’s our definition for when a flare goes off. But we were seeing peaks that didn’t correspond to the X-rays.” Woods says that at first they were worried the data were an anomaly or a glitch in the instruments. But as they confirmed the data with other instruments and watched the patterns repeat over many months, they began to trust what they were seeing. “And then we got excited,” he says.

Over the course of a year, the team used the EVE (for Extreme ultraviolet Variability Experiment) instrument on SDO to record data from many more flares. EVE doesn’t snap conventional images. Woods is the principal investigator for the EVE instrument and he explains that it collects all the light from the sun at once and then precisely separates each wavelength of light and measures its intensity. This doesn’t produce pretty pictures the way other instruments on SDO do, but it provides graphs that map out how each wavelength of light gets stronger, peaks, and diminishes over time. EVE collects this data every 10 seconds, a rate guaranteed to provide brand new information about how the sun changes, given that previous instruments only measured such information every hour and a half or didn’t look at all the wavelengths simultaneously – not nearly enough information to get a complete picture of the heating and cooling of the flare.

[/caption]

Recording extreme ultraviolet light, the EVE spectra showed four phases in an average flare’s lifetime. The first three have been observed and are well established. (Though EVE was able to measure and quantify them over a wide range of light wavelengths better than has ever been done.) The first phase is the hard X-ray impulsive phase, in which highly energetic particles in the sun’s atmosphere rain down toward the sun’s surface after an explosive event in the atmosphere known as magnetic reconnection. They fall freely for some seconds to minutes until they hit the denser lower atmosphere, and then the second phase, the gradual phase, begins. Over the course of minutes to hours, the solar material, called plasma, is heated and explodes back up, tracing its way along giant magnetic loops, filling the loops with plasma. This process sends off so much light and radiation that it can be compared to millions of hydrogen bombs.

The third phase is characterized by the Sun’s atmosphere — the corona –losing brightness, and so is known as the coronal dimming phase. This is often associated with what’s known as a coronal mass ejection, in which a great cloud of plasma erupts off the surface of the Sun.

But the fourth phase, the late phase flare, spotted by EVE was new. Anywhere from one to five hours later for several of the flares, they saw a second peak of warm coronal material that didn’t correspond to another X-ray burst.

“Many observations have spotted an increased extreme ultraviolet peak just seconds to minutes after the main phase of the flare, and this behavior is considered a normal part of the flare process. But this late phase is different,” says Goddard’s Chamberlin, who is also a co-author on the paper. “These emissions happen substantially later. And it happens after the main flare exhibits that initial peak.”

To try to understand what was happening, the team looked at the images collected from SDO’s Advanced Imaging Assembly (AIA) as well. They could see the main phase flare eruption in the images and also noticed a second set of coronal loops far above the original flare site. These extra loops were longer and become brighter later than the original set (or the post-flare loops that appeared just minutes after that). These loops were also physically set apart from those earlier ones.

“The intensity we’re recording in those late phase flares is usually dimmer than the X-ray intensity,” says Woods. “But the late phase goes on much longer, sometimes for multiple hours, so it’s putting out just as much total energy as the main flare that typically only lasts for a few minutes.” Because this previously unrealized extra source of energy from the flare is equally important to impacting Earth’s atmosphere, Woods and his colleagues are now studying how the late phase flares can influence space weather.

The late phase flare is, of course, just one piece of the puzzle as we try to understand the star with which we live. But keeping track of the energy, measuring all the different wavelengths of light, using all the instruments NASA has at its disposal, such information helps us map out all the steps of the Sun’s great dance.

Sun Erupts with Spectacular Flares

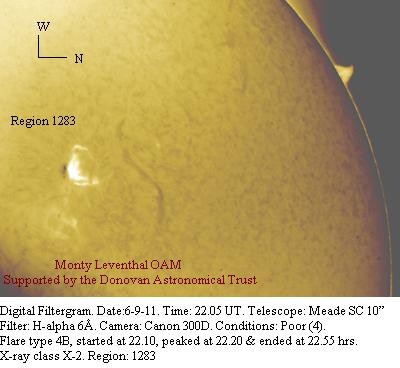
A digital filtergram shows a type 4B Flare with an X-ray class of X-2 in active region 1283 on Sept. 6, 2011. Credit: Monty Leventha

The Sun sent two flares yesterday from active region 1283. This video shows the second flare, at 6:12 p.m. EDT (2212 GMT) on Tuesday an even bigger flare than the M-class flare from early on Sept. 6, at about 0150 GMT. This was an X-class flare, major events that can trigger planet-wide radio blackouts and long-lasting radiation storms. The latest update says the CMEs could sail north of Earth, delivering a glancing blow to Earth’s magnetic field, and could arrive between September 8 -10. Spaceweather.com says high-latitude sky watchers should be alert for auroras in the nights ahead.

The image below was sent in to Universe Today by Monty Leventhal showing the type 4B Flare with an X-ray class of X-2 in active region 1283.

[/caption]

Here are the details and equipment Monty used:

Date:- 6-9-11
Time:- 22.05 U.T.
Conditions:- Poor
Camera:- Canon 300D
Filter:- H-alpha. 6Å.
Telescope:- Meade S.C. 10 inch

Scientists Detect Sunspots Before They Emerge

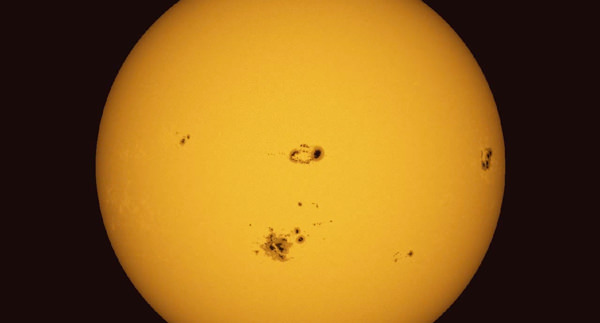
Stanford researchers have found a way to detect sunspots such as these two days before they reach the surface of the Sun. Image Credit: Thomas Hartlep

[/caption]

For solar enthusiasts, we’re all quite aware of sunspots and their implications. Able to disrupt power grids, shut down satellite communications and pose hazards to astronauts, these “cool” customers are revealing themselves ahead of their surface appearance. Thanks to the Michelson Doppler Imager aboard NASA’s Solar and Heliospheric Observatory satellite, known as SOHO, researchers were able to take 15 years of “sound” data from our nearest star… and develop a new technique for detecting sunspots before they emerge.

By combining information with NASA’s Solar Dynamics Observatory satellite, which carries the Helioseismic and Magnetic Imager, scientists have discovered a new method for detecting sunspots as deep as 65,000 kilometers below the solar surface. The areas of intense magnetic fields produce acoustic waves from the turbulence of plasma and gases. Near the surface, a convection cell echoes the information which travels back to the solar interior – only to be refracted again. By comparing their findings to seismic waves studied here on Earth, researchers measure the waves between points to predict anomalies.

Detection of Emerging Sunspot Regions – 18 August 2011: Movie showing the detected travel-time perturbations before the emergence of active region 10488 in the photosphere. The first 10 seconds of the movie show intensity observations of the Sun. The intensity later fades out and the photospheric magnetic field is shown. In the next 20 seconds, we zoom in to a region where a sunspot group would emerge. The upper layer shows magnetic field observations at the surface and the lower layer shows simultaneous travel-time perturbations, detected at a depth of about 60,000 km. After the emergence, intensity observations show the full development of this active region, until it rotates out of view on the west solar limb. (movie made by Thomas Hartlep) Courtesy of the Helioseismic and Magnetic Imager.

“We know enough about the structure of the Sun that we can predict the travel path and travel time of an acoustic wave as it propagates through the interior of the Sun,” said Junwei Zhao, a senior research scientist at Stanford’s Hansen Experimental Physics Lab. “Travel times get perturbed if there are magnetic fields located along the wave’s travel path.”

By comparing and measuring millions of pairs and points, researchers are able to pinpoint areas where sunspots are likely to happen. What they have discovered is larger spots rise to the surface faster than smaller ones… a prediction which can be made in approximately 24 hours. For less ominous appearances, lead times increase to up to two days.

“Researchers have suspected for a long time that sunspot regions are generated in the deep solar interior, but until now the emergence of these regions through the convection zone to the surface had gone undetected,” Ilonidis said. “We have now successfully detected them four times and tracked them moving upward at speeds between 1,000 and 2,000 kilometers per hour.”

The ultimate goal is to improve space weather forecasting. If events can be predicted three days prior, advance notice can be given and proper precautions taken.

Original Story Source: Stanford University News.

Enhanced Technique for Tracking Solar Storms All the Way From Sun to Earth

Heliophysicists announced today that new data processing techniques have enabled them to track solar storms from their origin in the Sun’s fiery corona all the way to impact with the Earth in unprecedented detail. “For the first time we’ve been able to image a coronal mass ejection all the way through its entire life cycle, from inside the solar corona until it reaches Earth,” said Craig DeForest, speaking at a NASA press briefing. DeForest is the lead author paper published in the Astrophysical Journal.
Continue reading “Enhanced Technique for Tracking Solar Storms All the Way From Sun to Earth”