Unprecedented Images Show Betelgeuse Has Sunspots

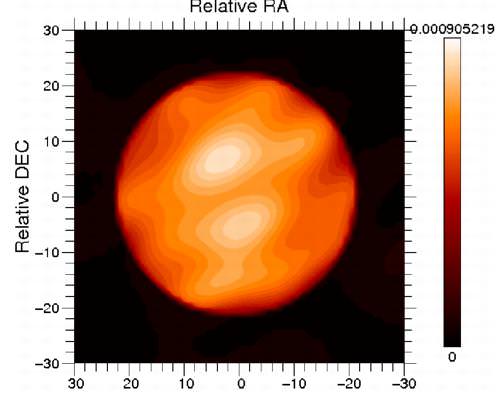
Caption:The surface of Betelgeuse in near infrared at 1.64 micron in wavelength, obtained with the IOTA interferometer (Arizona). The image has been re-constructed with two different algorithms, which yield the same details, of 9 milliarcseconds (mas). The star diameter is about 45 milliarcseconds. Credit: Copyright 2010 Haubois / Perrin (LESIA, Observatoire de Paris)

An international team of astronomers has obtained an unprecedented image of the surface of the red supergiant Betelgeuse, in the constellation Orion. The image reveals the presence of two giant bright spots, which cover a large fraction of the surface. Their size is equivalent to the Earth-Sun distance. This observation provides the first strong and direct indication of the presence of the convection phenomenon, transport of heat by moving matter, in a star other than the Sun. This result provides a better understanding of the structure and evolution of supergiants.

Betelgeuse is a red supergiant located in the constellation of Orion, and is quite different from our Sun. First, it is a huge star. If it were the center of our Solar System it would extend to the orbit of Jupiter. At 600 times larger than our Sun, it radiates approximately 100,000 times more energy. Additionally, with an age of only a few million years, the Betelgeuse star is already nearing the end of its life and is soon doomed to explode as a supernova. When it does, the supernova should be seen easily from Earth, even in broad daylight.

But we now know Betelgeuse has some similarities to the Sun, as it also has sunspots. The surface has bright and dark spots, which are actually regions that are hot and cold spots on the star. The spots appear due to convection, i.e., the transport of heat by matter currents. This phenomenon is observed every day in boiling water. On the surface of the Sun, these spots are rather well-known and visible. However, it is not at all the case for other stars and in particular supergiants. The size, physical characteristics, and lifetime of these dynamical structures remain unknown.

Betelgeuse is a good target for interferometry because its size and brightness make it easier to observe. Using simultaneously the three telescopes of the Infrared Optical Telescope Array (IOTA) interferometer on Mount Hopkins in Arizona (since removed), and the Paris Observatory (LESIA) the astronomers were able to obtain a numerous high-precision measurements. These made it possible to reconstruct an image of the star surface thanks to two algorithms and computer programs.

Two different algorithms gave the same image. One was created by Eric Thiebaut from the Astronomical Research Center of Lyon (CRAL) and the other was developed by Laurent Mugnier and Serge Meimon from ONERA. The final image reveals the star surface with unprecedented, never-before-seen details. Two bright spots clearly show up next to the center of the star.

The analysis of the brightness of the spots shows a variation of 500 degrees compared to the average temperature of the star (3,600 Kelvin). The largest of the two structures has a dimension equivalent
to the quarter of the star diameter (or one and a half the Earth-Sun distance). This marks a clear difference with the Sun where the convection cells are much finer and reach hardly 1/20th of the solar radius (a few Earth radii). These characteristics are compatible with the idea of luminous spots produced by convection. These results constitute a first strong and direct indication of the presence of convection on the surface of a star other than the Sun.

Convection could play an important role in the explanation of the mass-loss phenomenon and in the gigantic plume of gas that is expelled from Betelgeuse. The latter has been discovered by a team led by Pierre Kervella from Paris Observatory (read our article about this discovery). Convection cells are potentially at the origin of the hot gas ejections.

The astronomers say this new discovery provides new insights into supergiant stars, opening up a new field of research.

Sources: Abstract: arXiv, Paper: “Imaging the spotty surface of Betelgeuse in the H band,” 2009, A&A, 508, 923″. Paris Observatory

Measuring the Coronal Temperature with Iron

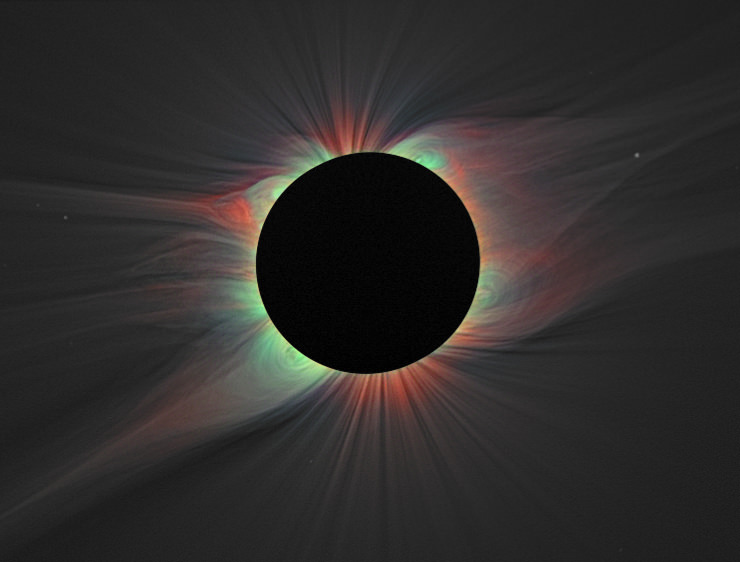
This image of the solar corona contains a color overlay of the emission from highly ionized iron lines and white light taken of the 2008 eclipse. Red indicates iron line Fe XI 789.2 nm, blue represents iron line Fe XIII 1074.7 nm, and green shows iron line Fe XIV 530.3 nm. This is the first such map of the 2-D distribution of coronal electron temperature and ion charge state. Credit: Habbal, et al.

Astronomers presenting at this week’s AAS conference have reported on new research measuring the temperature of the solar corona. The work combines observations of the Sun’s outer reaches from observations during total solar eclipses in 2006, 2008, and 2009. It utilized mapping of various abundances of ionized iron to build a two dimensional temperature map.

Although many introductory science classes paint temperature as a fixed number, in reality, it’s the average of a range of temperatures which is a way of quantifying the kinetic energy of the particles in question. Individual particles may be hotter (higher kinetic energy) while others may be cooler (lower kinetic energy). As these atoms move around, they can collide and these collisions will knock off electrons causing the atoms to become ionized. The degree of ionization will be indicative of just how energetic the collision was.

Those ionized atoms can then be identified spectroscopically or by using a filter to search for the wavelength at which those atoms will emit light as new electrons settle down into the previously vacated orbitals. By measuring the relative amounts of ionization astronomers can then reconstruct the range of kinetic energies in the gas and thus, temperature range which can, in turn, be used to determine the average temperature.

This is the method an international team of astronomers used to study the sun’s corona. Since light atoms don’t work well for this method (they become fully ionized or just can’t show a large range of ionization like atoms with more electrons), the astronomers chose to study the Sun’s corona through various states of iron ionization. In doing so they mapped several ionization states, including capturing for the first time, the elusive Fe IX lines (iron with 8 electrons knocked off) at 789.2 nm.

One interesting finding was that the region of emission extended to three solar radii (or 1.5 times the diameter). After this distance, the collision rate drops off and can no longer cause the ionization of atoms (however, radiative processes caused by photons from the sun can still ionize the atoms, but this is no longer indicative of the temperature of the atoms). This was further than originally anticipated.

Another result of their work showed that there is a strong correspondence between the amounts of various ions coming from the sun and that same ratio in interplanetary space as measured by the SWICS on the Advanced Composition Explorer. This connection will better help astronomers understand the working of our Sun as well as how its emissions may impact the Earth.

The full results of this work are to be published in the January 10 issue of the Astrophysical Journal.

Solar Activity is Picking Up

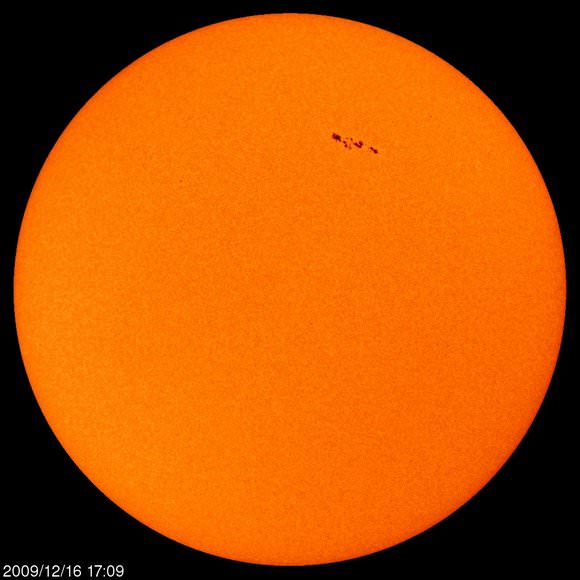
The current solar cycle (24) has been pretty boring, but a new sunspot — 1035 — is growing rapidly and now is seven times wider than Earth. Solar astronomers are predicting it could grow to be the largest sunspot of the year. There’s not been a lot of competition for the biggest sunspot, though: for 259 days (or 74%) of 2009, the sun has been spotless. But maybe the (solar) tide is turning. There’s been other action recently besides the new sunspot. A long-duration C4-class solar flare erupted this morning at 0120 UT from around the sunspot, which hurled a coronal mass ejection (CME) towards Earth. (See below for image of the CME that blasted off the sun on Dec. 14) Observers at high-latitude could see some aurora action when the CME arrives on or about Dec. 18th. Keep cheering; maybe the sun will come out of its doldrums.

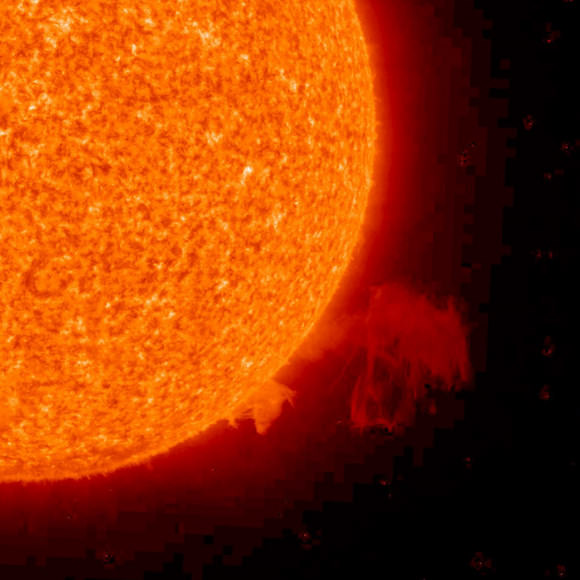
CME on Dec. 14, 2009.  Credit: NASA, SoHO
CME on Dec. 14, 2009. Credit: NASA, SoHO

Remember, don’t look at the Sun directly to try and see the sunspot. NASA has a great site that gives real-time data and updated images of the Sun from SoHO (Solar and Heliospheric Observatory.) Or check out Spaceweather.com, which also provides updates. And if you have a safe way of observing and imaging the sunspot, feel free to post images here, or send to Nancy.

Comets Posing as Asteroids (or is the the other way around?)

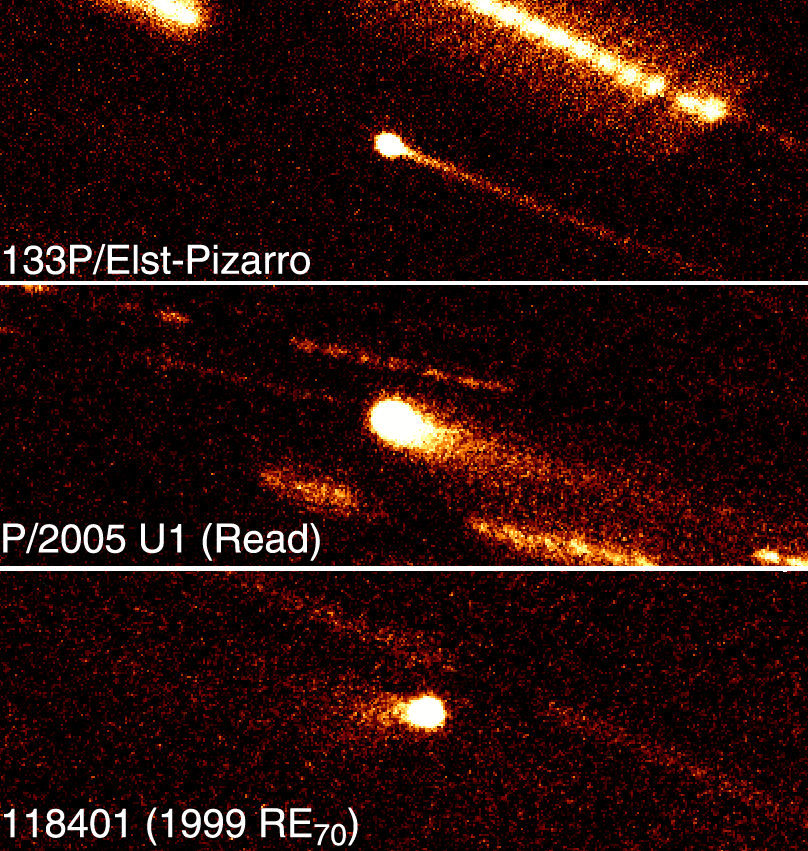
Images of known MBCs from UH 2.2-meter telescope data. Credit: Henry Hsieh

[/caption]

Asteroids are rocky bodies which belong between Mars and Jupiter. Comets are icy bodies that belong way out beyond Pluto. So what are comet-like objects doing in the asteroid belt?

On the night of August 7, 1996, astronomers Eric Elst and Guido Pizarro were observing what was previously thought to be an ordinary asteroid. To their surprise, the object revealed a faint but distinct tail similar to that of a comet. Initially, this was written off as a minor impact kicking up a debris cloud, but when the tail returned in 2002, when the supposed asteroid again returned to perihelion (the closest approach to the Sun), it once again displayed a tenuous tail. The “asteroid” was then given the designation of 133P/Elst-Pizarro. In 2005, two new asteroids were discovered to sport tails: P/2005 U1 and 118401. In 2008, yet another one of these odd objects was found (P/2008 R1). This new class of objects has been dubbed “Main Belt Comets (MBCs)”.

So where are these objects coming from?

A previous article here on Universe Today explored the possibility that these objects formed like other asteroids in the main belt. After all, each of the objects has an orbit consistent with other apparently normal asteroids. They have a similar distance at with they orbit the Sun, as well as similar eccentricities and inclinations of their orbit. So trying to explain these objects as having origins in the outer solar system that migrated just right into the asteroid belt seemed like little more than special pleading.

Furthermore, a 2008 study by Schorghofer at the University of Hawaii predicted that, if such an icy body were to form, it would be able to avoid sublimation for several billion years if only it were covered with a few meters of dust and dirt thus negating the problems of these objects suffering an early death. (Keep in mind that, much like a melting snowball, the water will evaporate but the dirt won’t, so the dirt will pile up quickly on the surface making this entirely plausible!) However, if the ice were covered by such an amount of dust, it would take a collision to remove the dust and trigger the cometary appearance.

In a recent paper, Nader Haghighipour also at the University of Hawaii explores the viability of collisions to trigger this activation as well as the stability of the orbits of these objects to assess the expectation that they were formed at the same time as other asteroids in the main belt.

For the orbital range in which three of the MBCs lie, it was predicted that “on average, one m[eter]-sized object collides … every 40,000 years.” They stress this is an upper limit since their simulation did not include other, nearby asteroids which would likely deplete the number of available impactors.

When they explored the orbital stability of these objects, the discovered at least two of them were dynamically unstable and would eventually be ejected from their orbits on a timescale of 20 million years. As such, it would be unreasonable to expect such objects to have lasted for the nearly 5 billion year history of the solar system. Thus, an in-situ formation was ruled out. However, due to a similarity in orbital characteristics to a family of asteroids known as the Themis family, suggesting they may have resulted from the same break up of a larger body that created this group. This begs the question of whether or not more of these asteroids are secretly hiding water ice reservoirs and are just waiting for an impact to expose them.

Distinctly separate from this orbital family was P/2008 R1 which exists in an especially unstable orbit near one of the resonances from Jupiter. This suggests that this MBC was likely scattered to its present location, but from where remains to be determined.

So while such Main Belt Comets may not have formed simply as they are now, they are likely to be in orbits not far removed from their original formation. Also, this work supported the earlier notion that minor impacts could reliably expected to expose ice allowing for the cometary tails. Whether or not more asteroids have tails tucked between their legs will be the target of future exploration.

Haghighipour’s Paper

Up, Up and Away! Helium Balloon Telescope Explores the Sun

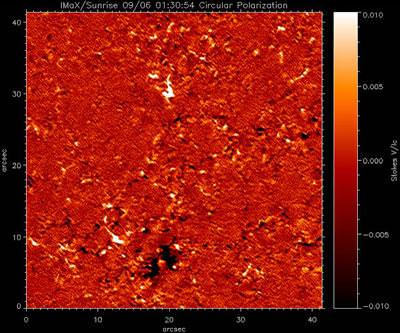
SUNRISE enables tiny magnetic fields on the surface of the Sun to be measured at a level of detail never before achieved. Credit: Image: MPS/IMAX consortium


Exploring the Sun via helium balloon almost sounds like an adventure for an animated movie, but the SUNRISE balloon-borne telescope has captured data and images that show the complex interplay on the solar surface to a level of detail never before achieved. As in the video above, SUNRISE shows our local star to be a bubbling, boiling mass where packages of gas rise and sink, lending the sun its grainy surface structure. Dark spots appear and disappear, clouds of matter dart up – and behind the whole thing are the magnetic fields, the engines of it all.

[/caption]
“Thanks to its excellent optical quality, the SUFI instrument was able to depict the very small magnetic structures with high intensity contrast, while the IMaX instrument simultaneously recorded the magnetic field and the flow velocity of the hot gas in these structures and their environment,” said Dr. Achim Gandorfer, project scientist for SUNRISE at the Max Planck Institute for Solar System Research.

Previously, the observed physical processes could only be simulated with complex computer models.
“Thanks to SUNRISE, these models can now be placed on a solid experimental basis,” said Manfred Schüssler, co-founder of the mission.

SUNRISE is the largest solar telescope ever to have left Earth. It was launched from the ESRANGE Space Centre in Kiruna, northern Sweden, on June 8, 2009. The total equipment weighed in at more than six tons on launch. Carried by a gigantic helium balloon with a capacity of a million cubic meters and a diameter of around 130 meters, SUNRISE reached a cruising altitude of 37 kilometers above the Earth’s surface.

In the stratosphere, observational conditions are similar to those in outer space. The images are no longer affected by air turbulence, and the camera can also zoom in on the Sun in ultraviolet light, which would otherwise be absorbed by the ozone layer. After making its observations, SUNRISE separated from the balloon, and parachuted safely down to Earth on June 14th, landing on Somerset Island, a large island in Canada’s Nunavut Territory.

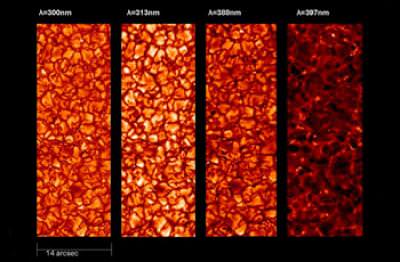
Grainy sun: the images show the so-called granulation in four different wavelengths in near ultraviolet light. The image section depicts 1/20,000 of the entire surface. The smallest recognisable structures have an angular resolution equal to that of looking at a coin from a distance of 100 kilometres. The light structures are the foundational elements of the magnetic fields. Credit: Image: MPI for Solar System Research

The work of analyzing the total of 1.8 terabytes of observation data recorded by the telescope during its five-day flight has only just begun. Yet the first findings already give a promising indication that the mission will bring our understanding of the Sun and its activity a great leap forward. What is particularly interesting is the connection between the strength of the magnetic field and the brightness of tiny magnetic structures. Since the magnetic field varies in an eleven-year cycle of activity, the increased presence of these foundational elements brings a rise in overall solar brightness – resulting in greater heat input to the Earth.

The variations in solar radiation are particularly pronounced in ultraviolet light. This light does not reach the surface of the Earth; the ozone layer absorbs and is warmed by it. During its flight through the stratosphere, SUNRISE carried out the first ever study of the bright magnetic structures on the solar surface in this important spectral range with a wavelength of between 200 and 400 nanometers (millionths of a millimeter).

SUNRISE is a collaborative project between the Max Planck Institute for Solar System Research in Katlenburg-Lindau, with partners in Germany, Spain and the USA.

Source: PhysOrg

MESSENGER Solves Solar Flare Mystery

Antenna Array
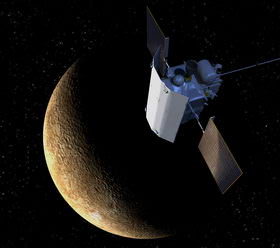
MESSENGER on the sunside of Mercury. Credit: NASA

[/caption]

In a case of being in the right place at the right time, the MESSENGER spacecraft was able to capture a average-sized solar flare, allowing astronomers to study high-energy solar neutrons at less than 1 astronomical unit (AU) from the sun for the first time. When the flare erupted on Dec. 31, 2007, MESSENGER – on course for entering orbit around Mercury — was flying at about half an AU, said William C. Feldman, a scientist at the Planetary Science Institute. Previously, only the neutron bursts from the most powerful solar flares have been recorded on neutron spectrometers on Earth or in near-Earth orbit. The MESSENGER results help solve a mystery of why some coronal mass ejections produce almost no energetic protons that reach the Earth, while others produce huge amounts.

Solar flares spew high-energy neutrons into interplanetary space. Typically, these bursts last about 50 to 60 seconds at the sun. But MESSENGER’s Neutron Spectrometer was able to record neutrons from this flare over a period of six to ten hours. “What that’s telling us is that at least some moderate-sized flares continuously produce high-energy neutrons in the solar corona.” Said Feldman. “From this fact, we inferred the continuous production of protons in the 30-to-100-MeV (million electron volt) range due to the flare.”
About 90 percent of all ions produced by a solar flare remain locked to the sun on closed magnetic lines, but another population results from the decay of the neutrons near the sun. This second population of decayed neutrons forms an extended seed population in interplanetary space that can be further accelerated by the massive shock waves produced by the flares, Feldman said.

“So the important results are that perhaps after many flare events two things may occur: continuous production of neutrons over an extended period of time and creation of seed populations of neutrons near the sun that have decayed into protons,” Feldman said. “When coronal mass ejections (nuclear explosions in the corona) send shock waves into space, these feedstock protons are accelerated into interplanetary space.”

“There has always been the question of why some coronal mass ejections produce almost no energetic protons that reach the Earth, while others produce huge amounts,” he added. “It appears that these seed populations of energetic protons near the sun could provide the answer, because it’s easier to accelerate a proton that already has an energy of 1 MeV than a proton that is at 1 keV (the solar wind).”

The seed populations are not evenly distributed, Feldman said. Sometimes they’re in the right place for the shock waves to send them toward Earth, while at other times they’re in locations where the protons are accelerated in directions that don’t take them near Earth.

The radiation produced by solar flares is of more than academic interest to NASA, Feldman added. Energetic protons from solar flares can damage Earth-orbiting satellites and endanger astronauts on the International Space Station or on missions to the Moon and Mars.

“People in the manned spaceflight program are very interested in being able to predict when a coronal mass ejection is going to be effective in generating dangerous levels of high-energy protons that produce a radiation hazard for astronauts,” he said.

To do this, scientists need to know a lot more about the mechanisms that produce flares and which flare events are likely to be dangerous. At some point they hope to be able to predict space weather — where precipitation is in the form of radiation — with the same accuracy that forecasters predict rain or snow on Earth.

MESSENGER could provide significant data toward this goal, Feldman observed. “What we saw and published is what we hope will be the first of many flares we’ll be able to follow through 2012,” he said. “The beauty of MESSENGER is that it’s going to be active from the minimum to the maximum solar activity during Solar Cycle 24, allowing us to observe the rise of a solar cycle much closer to the sun than ever before.”

MESSENGER is currently orbiting the sun between 0.3 and 0.6 AU — (an AU is the average distance between the Earth and the sun, or about 150,000 km) — on its way to orbit insertion around Mercury in March 2011. At Mercury, it will be within 0.45 AU of the sun for one Earth year.

Read the team’s paper: Evidence for Extended Acceleration of Solar Flare Ions from 1-8-MeV Solar Neutrons Detected with the MESSENGER Neutron Spectrometer.

Source: PSI

Spacecraft Detects Mysterious “Ribbon” at Edge of Solar System

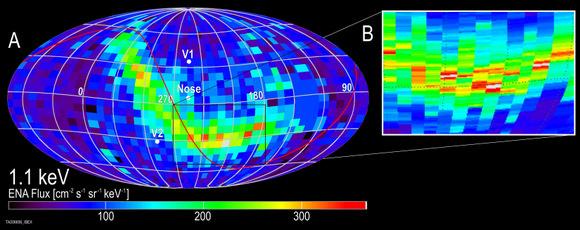
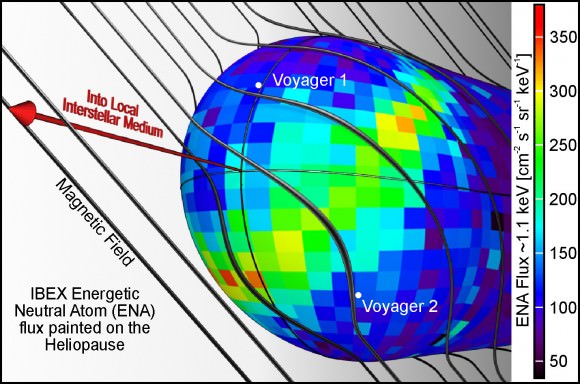
Accurate timing of the incoming ENAs allows the IBEX team to obtain a higher resolution in the latitudinal direction. The inset at right shows some of the fine detail of the ribbon. Credit: Southwest Research Institute (SwRI)

[/caption]

Since it launched a year ago, the Interstellar Boundary Explorer (IBEX) has been monitoring heliosphere and how our Sun interacts with and the local interstellar medium — the gas and dust trapped in the vacuum of space. The first results from the mission, combined with data from the Cassini mission, are showing the heliosphere to be different from what researchers have previously thought. Data show an unexpected bright band or ribbon of surprisingly high-energy emissions. “We knew there would be energetic neutral atoms coming in from the very edge of the heliosphere, and our theories said there would be small variations in their emissions,” said David McComas, IBEX Principal Investigator at a press conference on Thursday. “But instead we are seeing two-to-three hundred percent variations, and this is not entirely understood. Whatever we thought about this before is definitely not right.”

The energies IBEX has observed range from 0.2 to 6.0 kiloelectron volts, and the scientists said its flux is two to three times greater than the ENA activity throughout the rest of the heliosphere. McComas and his colleagues said that no existing model can explain all the dominant features of this “ribbon.” Instead, they suggest that these new findings will prompt a change in our understanding of the heliosphere and the processes that shape it.

This image illustrates one possible explanation for the bright ribbon of emission seen in the IBEX map. The galactic magnetic field shapes the heliosphere as it drapes over it. The ribbon appears to trace the area where the magnetic field is most parallel to the surface of the heliosphere (the heliopause).  Credit:  Southwest Research institute
This image illustrates one possible explanation for the bright ribbon of emission seen in the IBEX map. The galactic magnetic field shapes the heliosphere as it drapes over it. The ribbon appears to trace the area where the magnetic field is most parallel to the surface of the heliosphere (the heliopause). Credit: Southwest Research institute

McComas suggested that the energetic neutral atom (ENA) ribbon could be caused by interactions between the heliosphere and the local interstellar magnetic field. “The local interstellar magnetic field is oriented in such a way that it correlates with the ribbon. If you ‘paint’ the ribbon on the boundary of the heliosphere, the magnetic field is like big bungie cords that pushing in along the sides and at southern part of the heliosphere. Somehow the magnetic field seems to be playing a dominant roll in these interactions, but we don’t know it could produced these higher fluxes. We have to figure out what physics were are missing.”

The solar wind streaks away from the sun in all directions at over a millions kilometers per hour. It creates a bubble in space around our solar system.

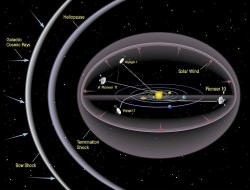
For the first ten billion kilometers of its radius, the solar wind travels at over a million kilometers per hour. It slows as it begins to collide with the interstellar medium, and the point where the solar wind slows down is the termination shock; the point where the interstellar medium and solar wind pressures balance is called the heliopause; the point where the interstellar medium, traveling in the opposite direction, slows down as it collides with the heliosphere is the bow shock.

The heliosphere. Credit: NASA

The Voyager spacecraft have explored this region, but didn’t detect the ribbon. Team member Eric Christian said the ribbon wound in between the location of Voyager 1 and 2, and they couldn’t detect it in their immediate areas. Voyager 1 spacecraft encountered the helioshock in 2004 when it reached the region where the charged particles streaming off the sun hit the neutral gas from interstellar space. Voyager 2 followed into the solar system’s edge in 2007. While these spacecraft made the first explorations of this region, IBEX is now revealing a a more complete picture, filling in where the Voyagers couldn’t. Christian compared Voyager 1 and 2 to be like weather stations while IBEX is first weather satellite to provide more complete coverage.

McComas said his first reaction when the data started coming in was that of terror because he thought something must be wrong with the spacecraft. But as more data kept coming back each week, the team realized that they were wrong, and the spacecraft was right.

“Our next steps will be to go through all the detailed observations and rack them up against the various models and go find what it is that we are missing, what we’ve been leaving out,” he said.

For more information and visuals, see this NASA webpage.

Two Equinox Sunspots

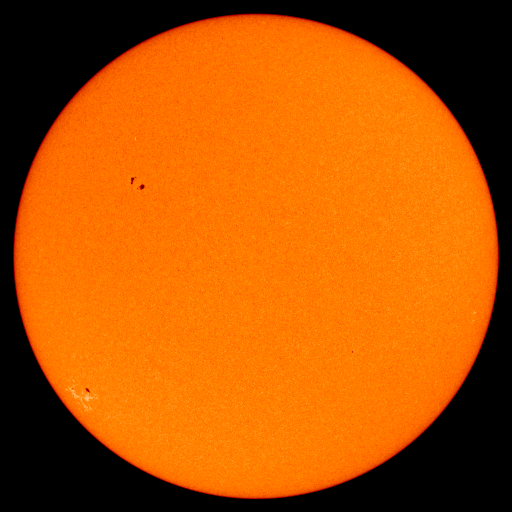
Sunspots 1026 and1027 are members of new Solar Cycle 24. Photo credit: SOHO/MDI

[/caption]

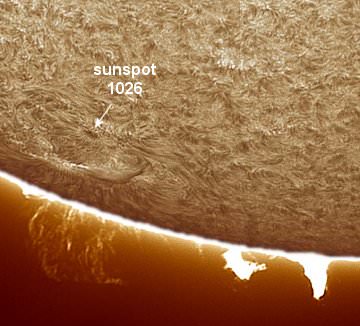
Two sunspots appeared on old Sol yesterday just as Earth’s orbit ushered in the Autumnal Equinox. Two sunspots showing up at once hasn’t happened in more than a year, and over 80% of the days in 2009 have been “sunspotless” during this deepest solar minimum in a century. Spaceweather.com had a great picture, below, of the first sunspot that appeared, #1026, taken by astrophotographer Peter Lawrence. Lawrence said there was a lot going on around the new sunspot. “The spot’s dark core is surrounded by active fibrils and a swirling magnetic filament that gives the region a nice 3D appearance.”

Sunspot 1026.  Credit: Peter Lawrence.
Sunspot 1026. Credit: Peter Lawrence.

Check out Spaceweather.com for more (and new images) of the new sunspots.

Temporary Radiation Belt Discovered at Saturn

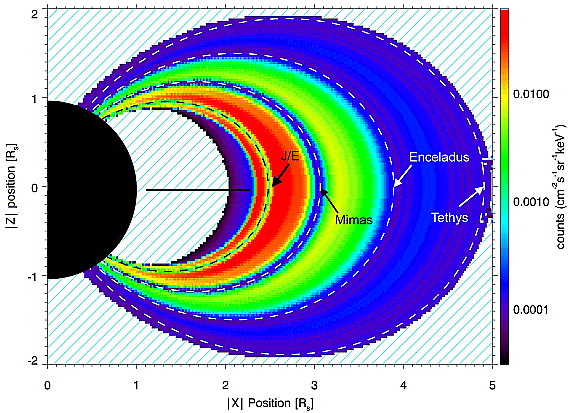
Radiation belt map of the ions with energies between 25-60 MeV, in Saturn's magnetosphere, based on several years of Cassini MIMI/LEMMS data. The structure of this radiation belt is almost perfectly stable for more than 5 years of Cassini observations, despite the intense variability of the radiation belts, outside the location of Tethys.

[/caption]
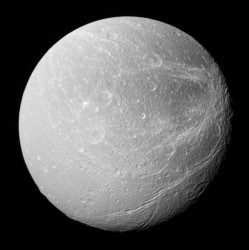
A new, temporary radiation belt has been detected at Saturn, located about 377,000 km from the center of the planet, near the orbit of the moon Dione. The temporary radiation belt was short-lived and formed three times in 2005. It was observed as sudden increases in the intensity of high energy charged particles in the inner part of Saturn’s magnetosphere, in the vicinity of the moons Dione and Tethys, and likely was caused by a change in the intensities of cosmic rays at Saturn.

“These intensifications, which could create temporary satellite atmospheres around these moons,” said Dr. Elias Roussos, “occurred three times in 2005 as a response to an equal number of solar storms that hit Saturn’s magnetosphere and formed a new, temporary component to Saturn’s radiation belts.”

The discovery was made possible by Cassini’s five-plus year mission, allowing scientists to observe and assess changes in Saturn’s radiation belts. An international team of astronomers made the discovery analyzing data from the Magnetospheric Imaging instrument (MIMI) on Cassini MIMI’s LEMMS sensor, which measures the energy and angular distribution of charged particles in the magnetic bubble that surrounds Saturn.

Saturn's moon Dione.  Credit: NASA
Saturn's moon Dione. Credit: NASA

The new belt, which has been named “the Dione belt”, was only detected by MIMI/LEMMS for a few weeks after each of its three appearances. The team believe that newly formed charged particles in the Dione belt were gradually absorbed by Dione itself and another nearby moon, named Tethys, which lies slightly closer to Saturn at an orbit of 295 000km.

Unlike the Van Allen belts around the Earth, Saturn’s radiation belts inside the orbit of Tethys are very stable, showing negligible response to solar storm occurrences and no variability over the five years that they have been monitored by Cassini.

Interestingly, it was found that the transient Dione belt was only detected outside the orbit of Tethys. It appeared to be clearly separated from the inner belts by a permanent radiation gap all along the orbit of Tethys.

“Our observations suggest that Tethys acts as a barrier against inward transport of energetic particles and is shielding the planet’s inner radiation belts from solar wind influences. That makes the inner, ionic radiation belts of Saturn the most isolated magnetospheric structure in our solar system“, said Dr Roussos.

The radiation belts within Tethys’s orbit probably arise from the interaction of the planet’s main rings and atmosphere and galactic cosmic ray particles that, unlike the solar wind, have the very high energies needed to penetrate the innermost Saturnian magnetosphere. This means that the inner radiation belts will only vary if the cosmic ray intensities at the distance of Saturn change significantly.

However, Roussos emphasized that outside the orbit of Tethys, the variability of Saturn’s radiation belt might be enhanced in the coming years as solar maximum approaches. “If solar storms occur frequently in the new solar cycle, the Dione belt might become a permanent, although highly variable, component of Saturn’s magnetosphere, which could affect significantly Saturn’s global magnetospheric dynamics,” he said.

The new findings were presented at the European Planetary Science Congress in Potsdam, Germany.

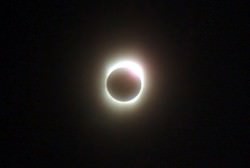
July 22, 2009 Total Solar Eclipse from China – Let’s Chase!

Eclipse from Chongqing Municipality (Xinhua/Liu Chan)

[/caption]

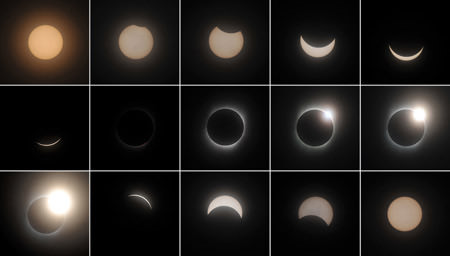
The total solar eclipse which just occurred on the 22nd of July 2009 was the longest maximum duration of the 21st century. Not since Saros 1991 have astronomers and eclipse chasers been treat to such an event! Totality lasted over six and a half minutes at maximum. duration. The event started in India along the western shore near Surat moved towards Butan and reached the southern tip of Nepal and the northern edge of Bangladesh.

U138P200T1D257531F1487DT20090722004103For other lucky astronomers like Vietnamese student Dang Anh Tuan at Hanoi National University of Education, the eclipse path also took the event over cities like Chengdu, Suining, Chonging, Wuhan, Xiaogan, Hangzhou, and Shanghai – and event which yielded five minutes of totality. Leaving Shanghai the shadow path raced across the ocean, to fall across islands such as Toshima and Akusaki south of Japan and eventually the Marshall islands. Where was the longest point? The maximum eclipse duration of 6 minutes and 43 seconds occurs far off the coast in the Pacific Ocean! Are you ready to become an eclipse chaser? Then follow me…

fish_eclipseI’ve always wanted to go on an eclipse chasing journey, but I’m afraid I’ll never quite be rich or well enough, unless it happens somewhere near me. But, my world is one that is both large and very small at the same time… And filled with wonderful friends from every corner. Bill Fish of Lubrizol Advanced Materials made my day by sending me some photos shared by their employees immediately after the eclipse had ended.

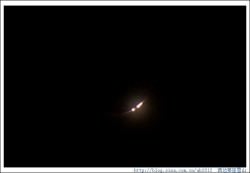
pic01599Seeing such incredible beauty, like this image of Bailey’s Beads taken in Chong Qing, and in just a few hours meeting great people like Jessica Bian, Kelly Zhou, Jun-Sheng Cao, Leo Chi, Mars Meng, Lucy Wang and Helen Tong felt so wonderful. Truly astronomy is a language we all speak! By roughly 9:00 in the morning, this is what they would have seen from their office windows or rooftops. Can you imagine what an exciting day it must have been?!

U1775P346T8D117254F4336DT20090722102131Well, needless to say, once I saw something like that, all my worries and cares for the day seemed so small. Even though I couldn’t leave my desk, the marvelous opportunity for me to become an eclipse chaser had just opened up like a fortune cookie right before my eyes. It was time for me to learn Chinese… and check out this awesome video done by Hubei Jingmen!

But he wasn’t alone… And neither was I. Millions of folks all over China were witnessing the eclipse and with each video I felt more and more like I was there, too.

“In the Zhejiang Haining, huge amounts of people were out to observe the wonderful total solar eclipse. The observation person is sea of people. But two big marvelous sight’s secret directions are the Sun, the Earth and the Moon…. “three meet”.”

U1775P346T8D117275F4336DT20090722111501Now, let’s travel to Beijing where the sky was enveloped in mist. Despite the weather, some 200 astronomy watchers queued in front of the Beijing Astronomical Observatory at 6:30 a.m. Staff at the observatory said the eclipse had sparked interest in astronomy. Yang Jing, a high-school student from Urumqi said. “I didn’t expect such a big crowd to watch the eclipse!”
Our next video comes from Chengdu… You can imagine the city stopping for just a moment to look skyward. “As soon as the totality happened, the clouds closed in so we couldn’t see the corona. That’s a pity,” said Zhen Jun, a man whose work unit had given the day off for the spectacle.

U1775P346T8D117250F4336DT20090722101124Now we move on to Hangzhou… When thousands of people thronged outdoors for the longest total solar eclipse of the 21st century, animals at the zoo in east China’s Hangzhou City also reacted, quickly and confusedly. The shadow of the moon disoriented birds whose body clock and direction depend on the sun. Red-crowned cranes and flamingos that had been wandering or drinking water suddenly fell asleep during the brief blackout of eclipse. But when the sun rays came out again several minutes later, the birds emerged from their cages and started the life of another “day.”

U1775P346T8D117269F4336DT20090722104609Even though I don’t understand a word of Chinese, I understand every word of “human”. Listen to them… Listen to the people talk and the children! How I wish I were there, too! Said Kang Hui:“The celestial phenomenon was a marvelous sight”. Are you ready to move again and follow the shadow? Then, let’s take a trip to Shanxi Linfen…

Now, I’ll race you to Hong Kong! Hundreds of people thronged into the Hong Kong Space Museum Wednesday morning for the Partial Solar Eclipse Observation activity. The public watched the eclipse using telescopes equipped with a safe filtering system and projection under guidance provided by the Space Museum.

Gosh, some of that footage feels like you could just reach right out and wrap your hand around that Moon, doesn’t it? Now let’s head to the middle of Anhui Yi County…

U1775P346T8D117247F4336DT20090722100206This one where you can see the corona dazzling is simply extraordinary. Can you imagine what it would feel like to be able to see this in real life? Come on… Let’s continue our eclipse chasing trip to Shanghai! It was raining in Shanghai when the total eclipse occurred at 9:35 a.m. The city put extra police on streets, and more than 30 police vessels patrolled the coast. Only street lamps were left on, as the city turned off all landscape lighting to allow people to watch the solar eclipse.

U1775P346T8D117244F4336DT20090722095918In Shanghai, more than 4,000 people ended up in suburban Yuehu Park of Sheshan Observatory and Yangshan Deep Water Port, two prime spots in the city, to observe the eclipse. Shanghai Science Hall also organized a public viewing session in downtown Fuxing Park and seventeen observation stations were set up in the solar eclipse path from Yunnan province to Zhejiang province.

Now we travel to the Henan Luoyang and say hello to these great kids and their equally excited parents and grandparents as we catch a partial eclipse.

“Luoyang’s light rain was intermittent, in the morning about 10:45, the Sun opened out the cloud layer to reveal the face of what was to come. The residents might see the partial solar eclipse! This kind of picture has not been seen here for a very long time. The Henan Luoyang partial solar eclipse looks just like the raging fire phoenix raising slowly.”

Shall we continue to Taiwan? Then grab us a cup of coffee and I will meet you at the Taibei Municipal Astronomy Scientific Culture Hall.

Shall we travel to Shenyang? This was also a partial solar eclipse location, but witnesses said the Moon “seemed like it was curved”.

Now, come with us to Ningbo. This one is so beautiful I wept when I saw it…

“This morning we just watched the total solar eclipse, which happens every 500 years. When the whole sun is blacken by the Moon. Everyone is highly excited. It’s pity I forgot to bring the camera by my side and the moment is passed away soon. But I am still lucky to see the sight. 500 years……how significant!”

U1775P346T8D117273F4336DT20090722110358When I was a child, I was charmed by a story about Ping the Duck, who lived on the Yangtze River. The last of the hundreds of videos I have watched today that I’d like to share with you is part of the Yangtze River collection.

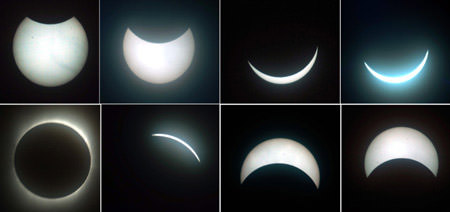
Enjoy this beautiful composite image taken by Yang Lei at a park in southwest China’s Chongqing Municipality. It has been my most wonderful pleasure over the day to spend time in the East…

U138P200T1D257701F14DT20090722185640

Chasing the Sun!

Solar eclipse occurring over Taipei of southeast China's Taiwan

My many thanks to Bill Fish for getting me started, Jessica Bian for investigating and translating and the wonderful people at Sina for sharing!