Where are the Sunspots? Are we in for a Quiet Solar Cycle?

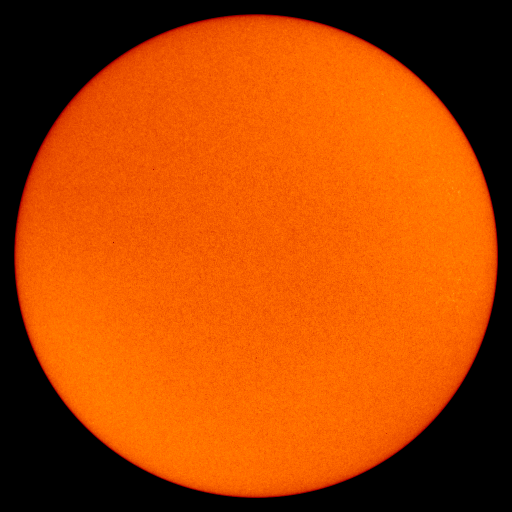
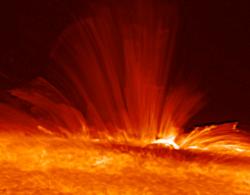
The Suns photosphere is looking particulary boring (NASA/SOHO)

So what’s up with our Sun? Is it going through a depression? It seems as if our closest star is experiencing a surprisingly uneventful couple of years. Solar minimum has supposedly passed and we should be seeing a lot more magnetic activity, and we certainly should be observing lots more sunspots. Space weather forecasts have been putting Solar Cycle 24 as a historically active cycle… but so far, nothing. So what’s the problem? Is it a ticking bomb, waiting to shock us with a huge jump in solar activity, flares and CMEs over a few months? Or could this lack of activity a prelude to a very boring few years, possibly leading the Earth toward another Ice Age?

It’s funny. Just as we begin to get worried that the next solar maximum is going to unleash all sorts of havoc on Earth (i.e. NASA’s 2006 solar storm warning), scientists begin to get concerned as to whether there is going to be a solar maximum at all. In a conference last week at Montana State University, solar physicists discussed the possibility that the Sun could be facing a long period of calm, leading to the concern that there could be another Maunder Minimum. The Maunder Minimum (named after the late 19th Century solar astronomer Edward W. Maunder, who discovered the phenomenon) was a 17th Century, 30-year period when very few sunspots were observed on the disk of the Sun. It is thought by many scientists that this period contributed to what became known as the “Little Ice Age” here on Earth. As the Sun provides Earth with all its energy, during extended periods when the solar output is lower than average, it seems possible a lack of sunspots on the Sun (i.e. low activity) may be linked with periods of cold down here.

It continues to be dead. That’s a small concern, a very small concern.” – Saku Tsuneta, National Astronomical Observatory of Japan and program manager for the Hinode solar mission.

However, solar physicists are not too worried about this possibility, after all, it’s only been two years since solar minimum. Although activity has been low for the beginning of Cycle 24, sunspots have not been non-existent. In January of this year, a newborn spot was observed, as expected, in high latitude regions. More spots were seen in April. In March, sunspots from the previous solar cycle even made an appearance, putting on an unexpected show of flares and coronal mass ejections (CMEs).

As pointed out by David Hathaway, a solar physicist at NASA’s Marshall Space Flight Center, the fact that sunspots have already been observed in this new cycle means that it is highly unlikely we face anything as extreme as another Maunder Minimum. Hathaway says there is nothing unusual about having a relatively understated solar cycle after several particularly active cycles. Solar Cycle 23 was a very active period for the Sun with a greater than average number of sunspots observed on the solar surface.

It appears there are two different predictions for the activity level of the next solar cycle. On the one hand we have scientists that think this cycle might be below average, and on the other hand we have scientists who believe the next cycle will be the biggest yet. We certainly have a long way to go before we can begin making any accurate solar forecasts…

Source: Space.com

Warm Coronal Loops May Hold the Key to Hot Solar Atmosphere

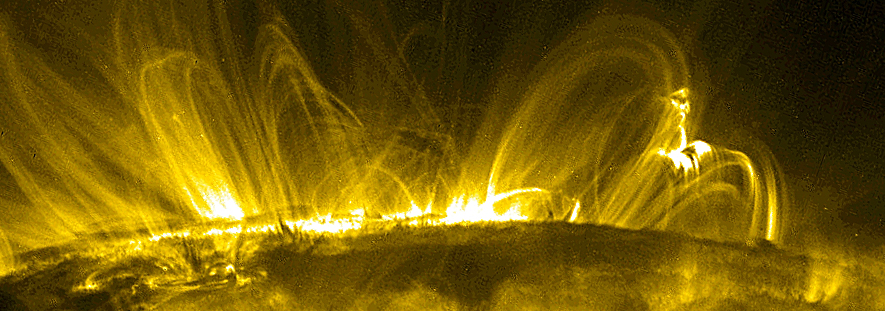
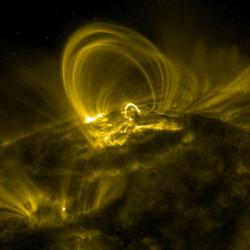
Coronal loops as imaged by TRACE at 171 Angstroms (1 million deg C) (NASA/TRACE)

Coronal loops, the elegant and bright structures threading through the solar surface and into the solar atmosphere, are key to understanding why the corona is so hot. Yes, it’s the Sun, and yes, it’s hot, but its atmosphere is too hot. The puzzle as to why the solar corona is hotter than the Sun’s photosphere has kept solar physicists busy since the mid-twentieth century, but with the help of modern observatories and advanced theoretical models, we now have a pretty good idea what is causing this. So is the problem solved? Not quite…

So why are solar physicists so interested in the solar corona anyway? To answer this, I’ll pull up an excerpt from my first ever Universe Today article:

measurements of coronal particles tell us the atmosphere of the Sun is actually hotter than the Suns surface. Traditional thinking would suggest that this is wrong; all sorts of physical laws would be violated. The air around a light bulb isn’t hotter than the bulb itself, the heat from an object will decrease the further away you measure the temperature (obvious really). If you’re cold, you don’t move away from the fire, you get closer to it! – from “Hinode Discovers Sun’s Hidden Sparkle“, Universe Today, December 21st, 2007

This isn’t only an academic curiosity. Space weather originates from the lower solar corona; understanding the mechanisms behind coronal heating has wide-ranging implications for predicting energetic (and damaging) solar flares and forecasting interplanetary conditions.

So, the coronal heating problem is an interesting issue and solar physicists are hot on the trail of the answer to why the corona is so hot. Magnetic coronal loops are central to this phenomenon; they are at the base of the solar atmosphere and experience rapid heating with a temperature gradient from tens of thousands of Kelvin (in the chromosphere) to tens of millions of Kelvin (in the corona) over a very short distance. The temperature gradient acts across a thin transition region (TR), which varies in thickness, but can be only a few hundreds of kilometers thick in places.

These bright loops of hot solar plasma may be easy to see, but there are many discrepancies between the observation of the corona and coronal theory. The mechanism(s) responsible for heating the loops have proven to be hard to pin down, particularly when trying to understand the dynamics of “intermediate temperature” (a.k.a. “warm”) coronal loops with plasma heated to around one million Kelvin. We are getting closer to solving this puzzle which will aid space weather predictions from the Sun to the Earth, but we need to work out why the theory is not the same as what we are seeing.

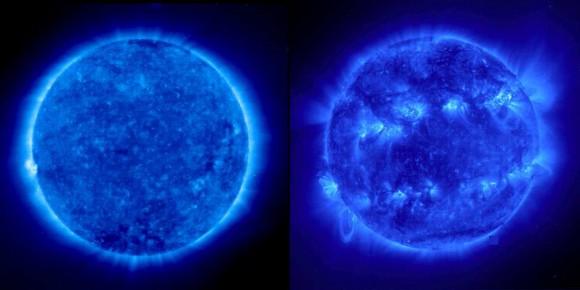
The Sun in EUV. A comparison between solar minimum (left) and maximum (right). Coronal loops are most active at solar max (SOHO/NASA)

Solar physicists have been divided on this topic for some time. Is coronal loop plasma heated by intermittent magnetic reconnection events throughout the length of a coronal loop? Or are they heated by some other steady heating very low in the corona? Or is it a bit of both?

I actually spent four years wrestling with this issue whilst working with the Solar Group at the University of Wales, Aberystwyth, but I was on the side of “steady heating”. There are several possibilities when considering the mechanisms behind steady coronal heating, my particular area of study was Alfvén wave production and wave-particle interactions (shameless self-promotion… my 2006 thesis: Quiescent Coronal Loops Heated By Turbulence, just in case you have a spare, dull weekend ahead of you).

James Klimchuk from the Goddard Space Flight Center’s Solar Physics Laboratory in Greenbelt, Md., takes a different opinion and favours the nanoflare, impulsive heating mechanism, but he is highly aware that other factors may come into play:

It has become clear in recent years that coronal heating is a highly dynamic process, but inconsistencies between observations and theoretical models have been a major source of heartburn. We have now discovered two possible solutions to this dilemma: energy is released impulsively with the right mix of particle acceleration and direct heating, or energy is released gradually very close to the solar surface.” – James Klimchuk

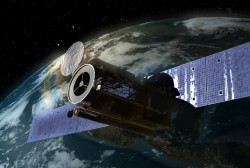
The Hinode solar observatory, measures the Sun in X-ray and EUV wavelengths (JAXA)

Nanoflares are predicted to maintain warm coronal loops at their fairly steady 1 million Kelvin. We know the loops are this temperature as they emit radiation in the extreme ultraviolet (EUV) wavelengths, and a host of observatories have been built or sent into space with instruments sensitive to this wavelength. Space-based instruments such as the EUV Imaging Telescope (EIT; onboard the NASA/ESA Solar and Heliospheric Observatory), NASA’s Transition Region and Coronal Explorer (TRACE), and the recently operational Japanese Hinode mission have all had their successes, but many coronal loop breakthroughs occurred after the launch of TRACE back in 1998. Nanoflares are very hard to observe directly as they occur over spatial scales so small, they cannot be resolved by the current instrumentation. However, we are close, and there is a trail of coronal evidence pointing to these energetic events.

Nanoflares can release their energy in different ways, including the acceleration of particles, and we now understand that the right mix of particle acceleration and direct heating is one way to explain the observations.” – Klimchuk.

Slowly but surely, theoretical models and observation are coming together, and it seems that after 60 years of trying, solar physicists are close to understanding the heating mechanisms behind the corona. By looking at how nanoflares and other heating mechanisms may influence each other, it is very likely that more than one coronal heating mechanism is at play…

Aside: Out of interest, nanoflares will occur at any altitude along the coronal loop. Although they may be called nanoflares, by Earth standards, they are huge explosions. Nanoflares release an energy of 1024-1026 erg (that is 1017-1019 Joules). This is the equivalent of approximately 1,600 to 160,000 Hiroshima-sized atomic bombs (with the explosive energy of 15 kilotonnes), so there is nothing nano about these coronal explosions! But on the comparison with the standard X-ray flares the Sun generates from time to time with a total energy of 6×1025 Joules (over 100 billion atomic bombs), you can see how nanoflares get their name…

Original source: NASA

Solar Blast Seen in Unprecedented Detail (Video)

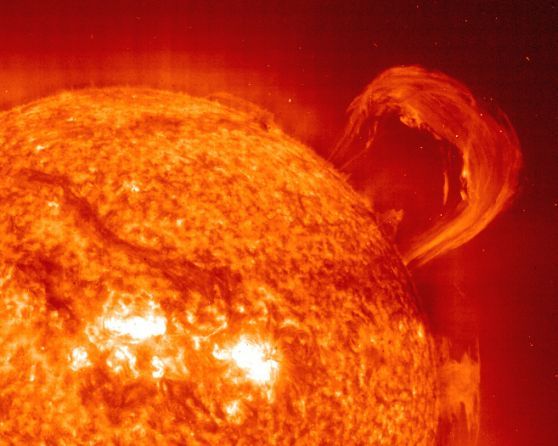
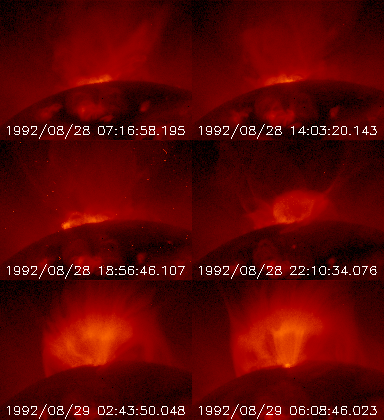
Periodically our sun blasts streams of hot, ionized gas into the solar system. These eruptions, called coronal mass ejections or CMEs pose a potential threat to astronauts or satellites if aimed at Earth. On April 9, the Sun erupted with a CME, and because the eruption was located on the edge or limb of the sun, it was observed in unprecedented detail by a fleet of spacecraft, revealing new features that are predicted by computer models but are otherwise difficult to see, even for specialized sun-watching spacecraft. From these observations, astronomers have been able to create an animation of this spectacular event.

When a CME occurs, usually spacecraft watching the event need to protect themselves from the bright X-ray solar flare associate with a CME. However, since the April 9 CME occurred on the edge or limb of the Sun as viewed from Earth, the solar flare was hidden from view, which allowed spacecraft to take longer exposures and uncover fainter structures than usual.

“Observations like this are very rare,” said Smithsonian astronomer Ed DeLuca.

Using the Smithsonian-developed X-ray Telescope (XRT) aboard the Japanese Hinode sun-watching satellite, astronomers saw a spiral (helical) magnetic structure unwind as it left the Sun during the CME. Such unwinding can release energy as the magnetic field goes from a more twisted to a less twisted configuration, thereby helping to power the eruption.

Hours later, XRT revealed an inflow of material toward a feature that appears as a bright line—actually an object known as a current sheet seen edge-on. A current sheet is a thin, electrified sheet of gas where oppositely directed magnetic field lines annihilate one another in a process known as magnetic reconnection. The extended observations from XRT show that magnetic fields flow in toward the current sheet for many hours after the eruption, progressing first toward the sheet and then down to the sun’s surface.

The astronomers were able to create an animation of the event.

They also determined that the temperature of the current sheet is between 5 and 18 million degrees Fahrenheit, which matches previous measurements higher up in the corona by the Ultraviolet Coronagraph Spectrometer on the SOHO spacecraft.

Astronomers study these explosions in hope of being able to predict them and provide “space weather” forecasts.

Original News Source: Harvard Smithsonian Center for Astrophysics

Wow! Satellite Catches Bright Solar Flare From a Another Star

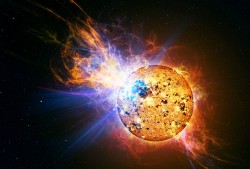
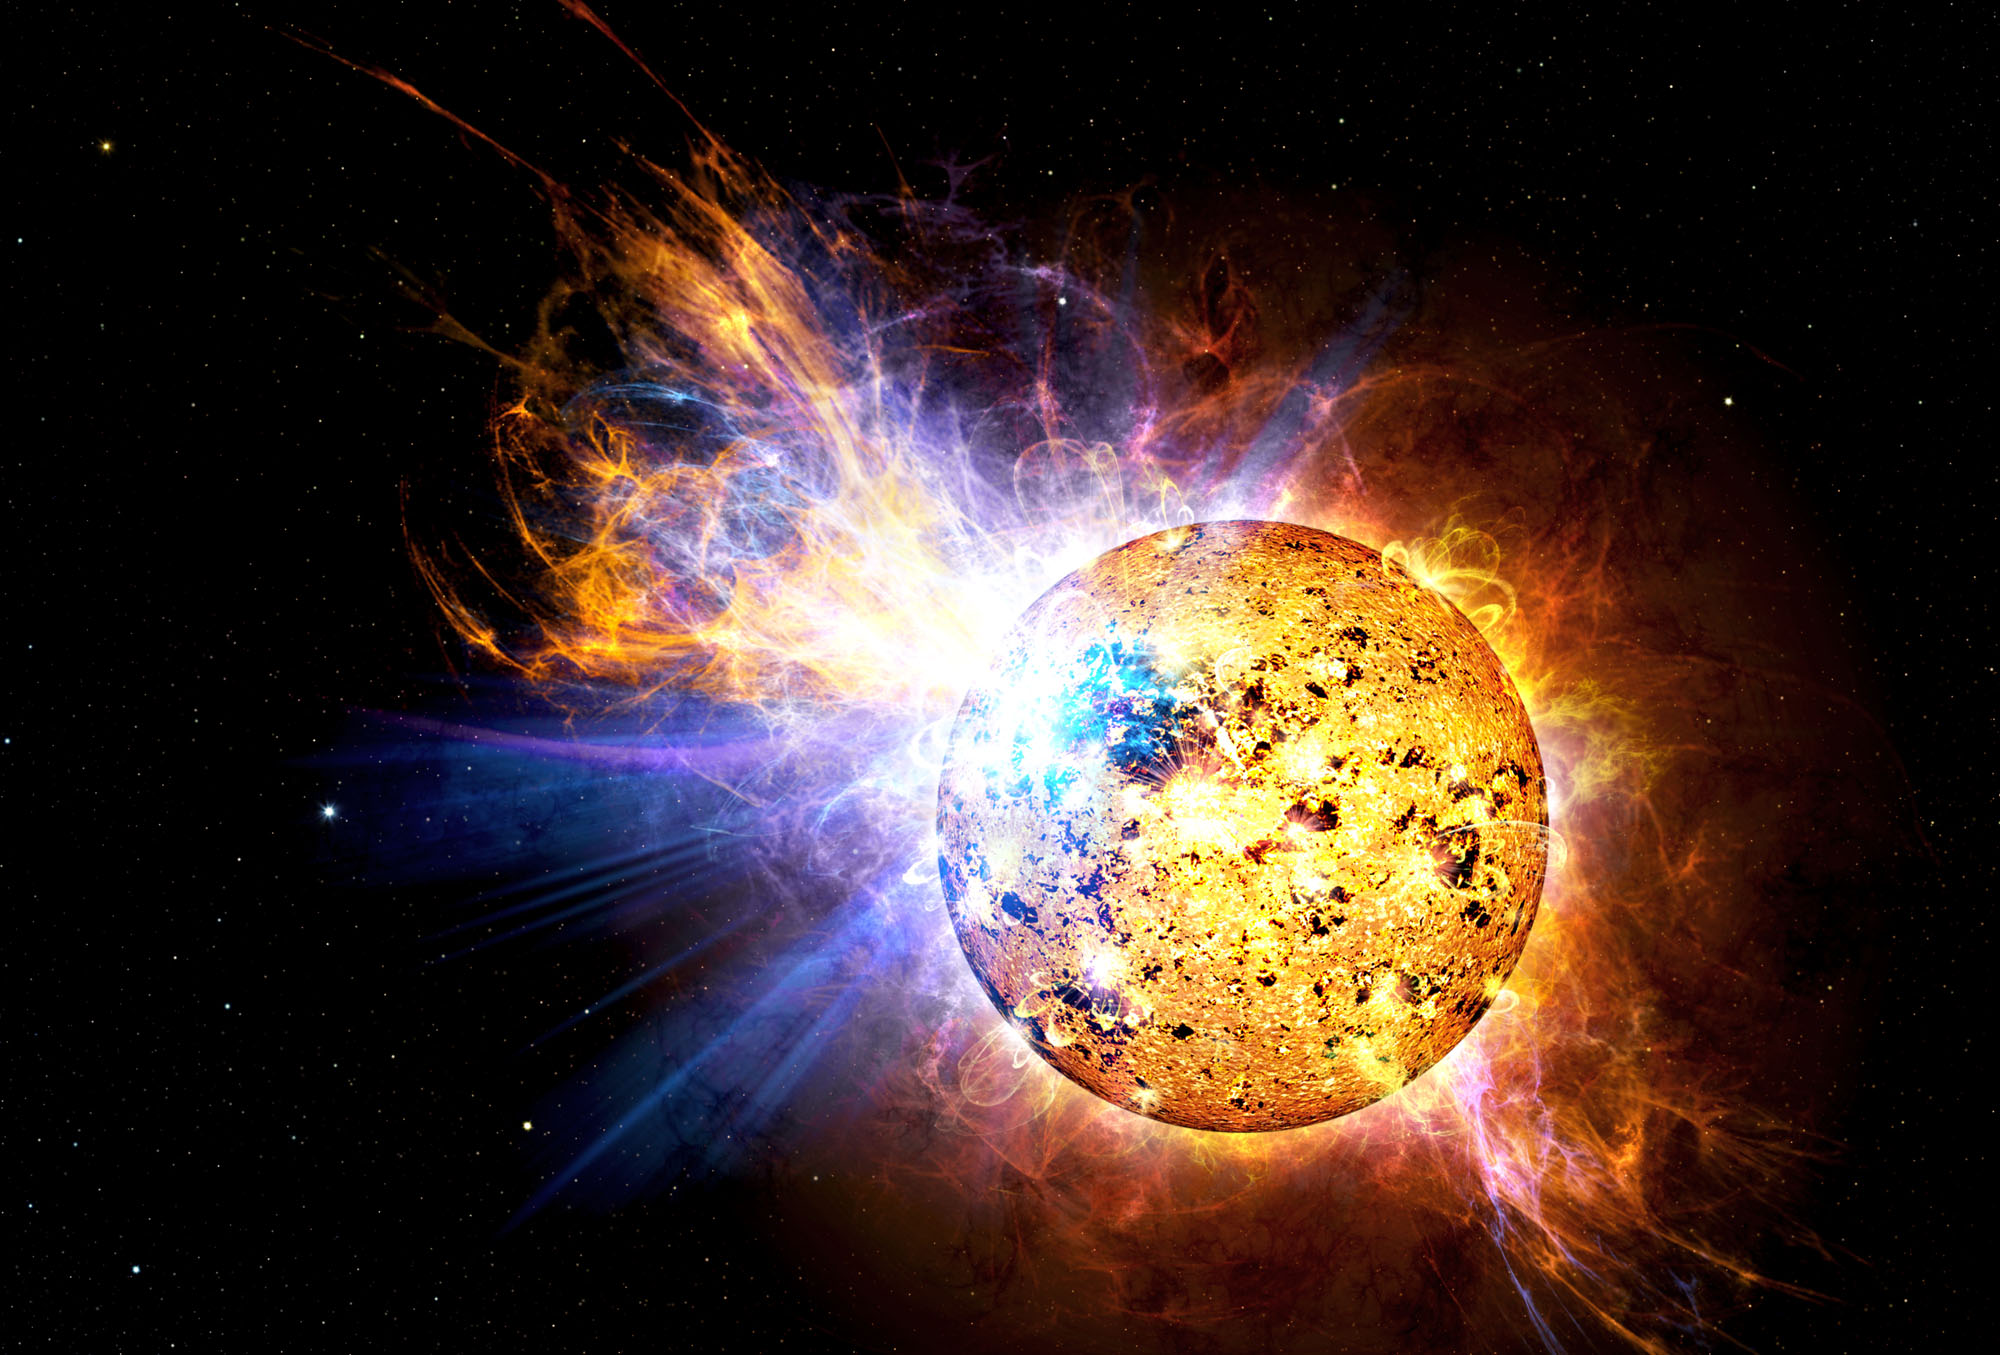
Artist's depiction of red-dwarf-flare. Image credit: Casey Reed/NASA

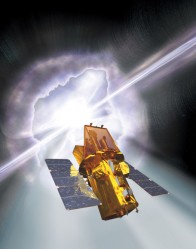
NASA’s Swift satellite picked up one of the brightest solar flares ever seen — not from our own sun, but a star 16 light-years away. This flare packed the power of thousands of solar flares combined, and a flare of this magnitude from our own sun would have stripped Earth’s atmosphere and sterilized the planet. Astronomers say the flare would have been visible to the naked eye on April 25, 2008 if the star had been easily observable in the night sky at the time. As it was, the flare’s brightness caused Swifts’ Ultraviolet/Optical Telescope to shut down for safety reasons. But Swift was able to study the flare for over 8 hours with its X-ray capabilities.

The Swift satellite normally searches for gamma ray bursts, and is surrounded with detectors that look for bursts of light. The spacecraft then “swiftly” and autonomously re-points itself to the location of the burst. However, this was no gamma ray burst, just a solar flare. But what a solar flare!

The star, EV Lacertae, is a basic red dwarf, the most common type of star in the universe. It shines with only one percent of the Sun’s light, and contains only a third of the Sun’s mass. It’s one of our closest stellar neighbors, but normally is not visible with the naked eye, as it holds a magnitude of -10.

“Here’s a small, cool star that shot off a monster flare. This star has a record of producing flares, but this one takes the cake,” says Rachel Osten, from NASA’s Goddard Space Flight Center. “Flares like this would deplete the atmospheres of life-bearing planets, sterilizing their surfaces.”

Astronomers say EV Lacertae is like an unruly child that throws frequent temper tantrums. It’s a relatively young star at a few hundred million years of age. But it’s a fast rotating star which generates a strong magnetic field, about 100 times as magnetically powerful as the Sun’s field. The energy stored in its magnetic field powers these giant flares.

The flare’s incredible brightness enabled Swift to make detailed measurements in X-ray, as the star remained bright in x-rays for about 8 hours. “This gives us a golden opportunity to study a stellar flare on a second-by-second basis to see how it evolved,” says Stephen Drake of NASA Goddard.

Flares release energy across the electromagnetic spectrum, but the extremely high gas temperatures produced by flares can only be studied with high-energy telescopes like those on Swift. Swift’s wide field and rapid repointing capabilities, designed to study gamma-ray bursts, make it ideal for studying stellar flares. Most other X-ray observatories have studied this star and others like it, but they have to be extremely lucky to catch and study powerful flares due to their much smaller fields of view.

Original News Source: NASA

Mission to the Sun

Astronomy
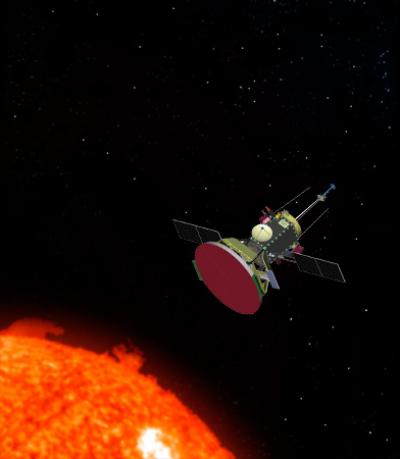
Solar Probe Spacecraft. Credit: NASA/Johns Hopkins University Applied Physics Laboratory

A mission to the sun is difficult stuff. For 30 years scientists and engineers have struggled with developing a spacecraft that could survive the harsh environment close to the sun, but always ended up running into insurmountable technology limitations or blowing the top off the budget. But now the Applied Physics Lab believes they have come up with a plan that will work, and NASA has given them the go-ahead to get a mission ready by 2015. And contrary to the old joke about a mission to the sun, the new Solar Probe won’t have an easy time of it by just heading to the sun at night!

The Solar Probe mission will come within 6.6 million kilometers (4.1 million miles) of the sun to study the streams of charged particles the sun hurls into space. The spacecraft will actually be within the sun’s corona — its outer atmosphere — where the solar wind is produced. At closest approach the Solar Probe will zip past the sun at 210 km (125 miles) per second, protected by a carbon-composite heat shield able to withstand up to 1425 degrees Celsius (2,600 degrees Fahrenheit) and survive blasts of radiation and energized dust at levels not experienced by any previous spacecraft.

The spacecraft will weigh about 1,000 pounds. Preliminary designs include a 2.7 meter (9 feet) diameter, 15 centimeter (6 inches) -thick, carbon-foam-filled solar shield atop the spacecraft body, similar to APL’s MESSENGER spacecraft.

The probe will be solar powered (no problem there!) with two sets of solar arrays that will retract or extend as the spacecraft swings toward or away from the sun during several loops around the inner solar system, making sure the panels stay at proper temperatures and power levels. At its closest passes the spacecraft must survive solar intensity more than 500 times what spacecraft experience while orbiting Earth.

“Solar Probe is a true mission of exploration,” says Dr. Robert Decker, Solar Probe project scientist at APL. “For example, the spacecraft will go close enough to the sun to watch the solar wind speed up from subsonic to supersonic, and it will fly though the birthplace of the highest energy solar particles. And, as with all missions of discovery, Solar Probe is likely to raise more questions than it answers.”

Solar Probe will use seven Venus flybys over nearly seven years to gradually shrink its orbit around the sun, coming as close as 4.1 million miles to the sun, about eight times closer than any spacecraft has come before.

The main goals of the Solar Probe are to determine the structure and dynamics of the sun’s magnetic field, trace the flow of energy that heats the corona and accelerates the solar wind, and explore dusty plasma near the sun and its influence on solar wind and energetic particle formation. This mission will also help us learn more about the sun-Earth relationship.

Original News Source: Eureka Alert

There is No Sun-Link with Global Warming

sun.thumbnail.jpg

The connection between solar activity and global warming has been a contentious issue for a long time. The idea that cosmic rays create global cloud cover just doesn’t seem to be working out; even the highest estimates of cloud cover variation caused by cosmic ray flux predict the effect to be very small. Now UK scientists have stepped into the debate, producing scientific evidence that there is no link between global warming, cosmic rays and solar activity. Sorry global warming sceptics, we might have to cut back on the emissions after all…

The connection between solar activity and global warming is thought to go like this: The Sun experiences massive changes in energy output throughout the 11-year solar cycle. At its peak (at solar maximum), the Sun’s influence over local space is at its highest. Its massive magnetic field will envelop the Earth and spiral into interplanetary space. As it does so, the immense and large-scale solar wind will deflect high energy cosmic rays. So, counter-intuitively, when the Sun is at its most active, cosmic ray collisions with the atmosphere is at its lowest. It is has been predicted by scientists such as Henrik Svensmark at the Danish National Space Center (DNSC) that these high energy cosmic rays will impact the Earth’s atmosphere, create droplets of water, thus generating cloud cover. So, following this logically, we should have a global decrease in cloud cover during periods of high solar activity (when cosmic rays are not deflected by the solar wind), causing global warming (as there will be less clouds to reflect the solar radiation). Many of the climate problems we are having at the moment can then be attributed to the Sun and not human activity.

But there’s a problem. As previously reported by the Universe Today, research groups will often publish conflicting results about the cosmic ray effect on cloud production. In one of the most definitive results to come out of this area of study has just been announced by UK scientists, and guess what? The Sun/cosmic-ray theory has no measurable effect on the climate change we are currently experiencing.

Dr. Svensmark’s idea was central to the science behind the documentary “The Great Global Warming Swindle” where the human impact on global climate change was brought into question. This theory has been under fire since its conception by highly regarded scientists such as Mike Lockwood from the UK’s Rutherford-Appleton Laboratory. Svensmark stands by his work. So with this in mind, Dr. Terry Sloan from Lancaster University set out to prove Svensmark’s hypothesis. But the results aren’t pretty.

We tried to corroborate Svensmark’s hypothesis, but we could not […] So we had better carry on trying to cut carbon emissions.” – Dr. Terry Sloan

In a separate study, Giles Harrison from Reading University, also studied the effect of cosmic ray flux on the amount of cloud cover, stating it is an important area of research, “…as it provides an upper limit on the cosmic ray-cloud effect in global satellite cloud data“. Although restricted to the atmosphere above the UK, Harrison’s study also returns the verdict that there is only a very weak cosmic ray effect on cloud production.

The Intergovernmental Panel on Climate Change (IPCC) released a report last year pointing the finger at human activity as the root cause behind global warming. There are very strong correlations between carbon emissions and global warming since the 1970s, so the IPCC has strongly recommended that the international community make radical cuts to their carbon emissions. What’s more the IPCC point out that the contribution from greenhouse gas emissions outweighs the effect of solar variability by a factor of 13 to one.

“…as far as we can see, he has no reason to challenge the IPCC – the IPCC has got it right.” – Dr. Terry Sloan

Source: BBC

Source of the Slow Solar Wind Found (Video)

hinode_solar_wind.thumbnail.jpg

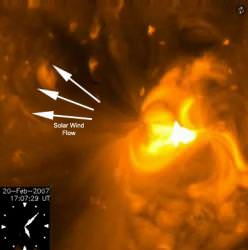
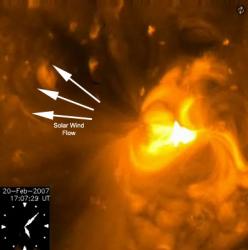
The solar wind comes in two modes: fast and slow. Solar astronomers have a good idea as to where the fast solar wind comes from: polar coronal holes of open magnetic field lines, blasting solar particles at speeds of over 3 million km/hr. But what about the slow solar wind which fires particles into space at a pedestrian 1.5 million km/hr? We know it comes from the streamer belt above equatorial regions of the Sun, but we have never been able to look lower. But now, with the help of the Hinode observatory, stunning high-resolution images and video have been captured showing solar dynamics previously overlooked. The point at which the Sun ejects slow wind particles into space can now be studied in unparalleled detail to help us understand the dynamics of space weather and solar storms.

The Sun is a complex, magnetic body. Its magnetic field is highly dynamic, varying in activity throughout the 11-year solar cycle. We have just witnessed the Sun entering “Solar Cycle 24” (although some old sunspots from the previous cycle have just been seen) and it will gradually build in energy before reaching “solar maximum” in a few years time (looks like the solar storms will be bigger than 2003’s flare excitement).

Transition Region and Coronal Explorer image of coronal loops (credit: NASA)

This time of relative calm (known as “solar minimum”) allows solar physicists to study the less explosive dynamics in the lower corona (the Sun’s atmosphere), chromosphere and photosphere. It is in this region that magnetic field lines (or magnetic flux) are pushed through the photosphere and the plasma from the solar interior is guided by the magnetic flux high into the corona. These hot and bright arcs of magnetism and superheated plasma are known as coronal loops, the scene of rapid reconnection events, sometimes sparking flares and coronal mass ejections (CMEs). But this time the Hinode science team have observed a steady release of solar plasma, venting from the solar interior around a cluster of bright coronal loop footpoints. The location of this steady release of plasma forms the origin of the slow solar wind.

It is fantastic to finally be able to pinpoint the source of the solar wind – it has been debated for many years and now we have the final piece of the jigsaw. In the future we want to be able to work out how the wind is transported through the solar system.” – Prof. Louise Harra, University College London, Mullard Space Science Laboratory.

A still from the movie showing solar wind particles venting from the Sun. Credits: JAXA (T. Sakao) / NAOJ / NASA / STFC / ESA

See the Hinode video of the region generating solar wind particles…

These dazzling images were captured by the Extreme Ultraviolet Imaging Spectrometer (EIS) on board the Japanese Hinode solar observatory. The observatory, which orbits the Earth, constantly looking at the Sun, has given us unrivaled observations of the Sun in X-ray and EUV wavelengths. Launched by Japan, the project also has collaborators in the UK and US.

These new discoveries are of vast importance to us. The solar wind carries a stream of highly energetic particles from the Sun and into space. The solar wind bathes the Earth in a radioactive stream, carrying the remnants of the solar magnetic field with it. The magnetic field can interact with the Earth’s magnetic field, allowing solar particles to rain down on our Polar Regions, creating vast light displays: the Aurora. However, these particles are also highly dangerous to any unprotected astronaut or sensitive satellite orbiting our planet. It is of paramount importance that as we venture further and further into space that we forecast the characteristics of the solar wind before it hits us. These new observations will aid our understanding of the conditions at the solar wind source and greatly improve our space weather-predicting ability.

Source: ESA

The Sun’s Magnetic Fountains

For you solar observing fans, enjoy the beauty. Over the years both the public and astronomers alike have witnessed the Sun’s volatile and ever-changing atmosphere. Before our eyes huge geysers of hot gas spew into the solar corona at tens of thousands of km per hour. Every few minutes they erupt and reach dynamic proportions. Now a team of scientists have used the Hinode spacecraft to find the origin and progenitor of these fountains – immense magnetic structures that thread through the solar atmosphere.

Today at the Royal Astronomical Society National Astronomy Meeting in Belfast (NAM 2008), team leader Dr. Michelle Murray from the Mullard Space Science Laboratory (MSSL, University College London) presented the latest results from Hinode spacecraft combined with computer emulated solar conditions. Since its launch in October 2006, scientists have been using Hinode to examine the solar atmosphere in extraordinary detail. One of it’s premier instruments is the Extreme Ultraviolet Imaging Spectrometer. The EIS generates images of the Sun and gives information on the speed of the moving gases.

At the core of the solar magnetic field, immense jets of hot gas are forced to the surface through increases in pressure. Just like an earthly geyser, when the pressure releases the gases fall back towards the Sun’s surface. But what causes the pressure? Unlike the volcanic activity that drives the terrestrial phenomena, solar fountains are caused by rearrangements of the Sun’s magnetic field, a continual process that results in looping cycles of increasing and decreasing pressure.

“EIS has observed the Sun’s fountains in unprecedented detail and it has enabled us to narrow down the fountains’ origins for the first time”, comments team member and MSSL postgraduate student Deb Baker. “We have also been able to find what drives the fountains by using computer experiments to replicate solar conditions.”

Hinode, JAXA, NASAThe sun-observing Hinode satellite is now in a sun-synchronous orbit, which allows it to observe the sun for uninterrupted periods lasting months at a time. Using a combination of optical, EUV and X-ray instrumentation Hinode will study the interaction between the Sun’s magnetic field and its corona to increase our understanding of the causes of solar variability.

“The computer experiments demonstrate that when a new section of magnetic field pushes through the solar surface it generates a continual cycle of fountains”, explains Dr. Murray, “but new magnetic fields are constantly emerging across the whole of the solar surface and so our results can explain a whole multitude of fountains that have been observed with Hinode.”

STEREO Spacecraft Captures Footage of a Solar Tsunami

A solar tsunami blasted its way through the sun’s lower atmosphere on May, 19 2007, and the action was captured by the twin STEREO spacecraft. Solar tsunamis are launched by huge explosions near the Sun’s atmosphere, called coronal mass ejections (CMEs). Although solar tsunamis share much in common with tsunamis on Earth, the solar version can travel at over a million kilometers per hour. Last year’s tsunami blasted and rolled for about 35 minutes, reaching peak speeds around 20 minutes after the initial flare. The observations were made by a team from Trinity College, Dublin.

“The energy released in these explosions is phenomenal; about two billion times the annual world energy consumption in just a fraction of a second. In half an hour, we saw the tsunami cover almost the full disc of the Sun, nearly a million kilometers away from the epicenter,” said David Long, a member of the team that made the observations.

STEREO’s Extreme Ultraviolet Imager (EUVI) instruments monitor the Sun at four wavelengths which correspond to temperatures ranging between 60,000 and 2 million degrees Celsius. At the lowest of these temperatures, scientists can see structures in the chromosphere, a thin layer of the solar atmosphere that lies just above the Sun’s visible surface. At temperatures between 1 and 2 million degrees Celsius, scientist can monitor features at varying levels in the solar corona.

The SOHO spacecraft, which was launched in 1995, also monitors the Sun at these wavelengths but only took images four times per day, giving scientists rare snapshots of these tsunamis. STEREO’s EUVI instruments take an image every few minutes to create a series, making it possible for scientists to track how the wave spreads over time.

Click here for a Quicktime animation of the event.

This is the first time that a tsunami has been observed at all four wavelengths, which enabled the team to see how the wave moved through the different layers of the solar atmosphere.

“To our surprise, the tsunami seems to move with similar speed and acceleration through all the layers. As the chromosphere is much denser than the corona, we’d expect the pulse there to drag. It’s a real puzzle,” said Dr. Peter Gallagher, another member of the team.

Artist

To complicate matters, the interval between images is not the same for all four cameras. At the time of the tsunami, the cameras monitoring radiation at 1 million degrees Celsius were set to take an image every 2.5 minutes. They recorded much higher speeds and accelerations for the wave than the other cameras, which were on 10 or 20 minute cycles. By taking a sample of one image in four, the data from these cameras matched the lower values observed in the other layers.

“We’ve thought for some time that the tsunamis might be caused by magnetic shockwaves but, in previous snapshots, the waves appeared to be travelling too slowly. However, we’ve seen from this set of observations that if the time interval between images is too long, it’s easy to underestimate the speed that the waves are moving. With a few more rapid-sequence observations of solar tsunamis, we should finally be able to identify the cause of these waves,” said Gallagher.

The discovery will be presented by David Long at the RAS National Astronomy Meeting in Belfast on Wednesday April 2, 2008.

For more information and animations, see Trinity College’s pageabout the solar tsunami.

Original News Source: RAS press release

Solar Corona Revealed by Medical X-Ray Techniques

density_distribution.thumbnail.jpg

For several decades solar scientists have been hard at work trying to unravel the mysteries of the solar corona. Thanks to a medical x-ray technique known as tomography, scientists are able resolve solar activity in greater detail. By using a new way of processing images, active regions now take on dimensions never foreseen by computer models.

Today Dr. Huw Morgan presented his results to the Royal Astronomical Society National Meeting in Belfast. Using an adapted medical X-ray technique, scientists have produced the first detailed map of the structure of the Sun’s outermost layer, the corona. The application known as tomography uses a series of images taken from many different angles to reconstruct a 3-dimensional map created from direct solar observations.

“This is a breakthrough for scientists trying to understand the corona and the solar wind. We’ve been attempting to apply tomography to the solar corona for more than 30 years but it’s proved very difficult and very inaccurate until now. The new technique that I’ve developed is only in its infancy but shows great potential for areas of research like space weather,” said Dr Morgan, of the University of Aberystwyth.

The process has not been as easy one, nor is it a new idea. Without images of the coronal far side, researchers were left with only half the data. The near side produces its own difficulties as well, since the outermost areas of the corona are more than a thousand times fainter than the regions near the Sun. This factor introduces huge potential errors to observations. Thanks to Dr. Morgan, his new way of processing coronal images, called Qualitative Solar Rotational Tomography (QSRT), eliminates the steep drop in brightness and associated errors. With the help of SOHO’s LASCO instrument, Dr. Morgan applied the technique to a series of images taken as the Sun’s rotation brings the ‘missing’ areas into view. The result? Full coronal maps that are at least 5 times more detailed than previous tomographical studies of the Sun. And the future may hold far more. Says Morgan:

“I’ve now produced maps of the corona over almost a whole cycle of solar activity, so we can now see in unprecedented detail how structures develop and evolve in three-dimensions. The maps have produced some interesting results: for instance we’ve observed large areas of dense structures when the Sun is most active that are not predicted by current computer models. We’ve also found evidence that inner regions of the corona rotate at different speeds.”

According to the RAS press release, the technique is already being used by scientists at the Institute of Maths and Physics at Aberystwyth University to interpret their radio-wave observations of the solar wind. Dr. Morgan, together with colleagues at the Institute of Astronomy at the University of Hawaii, is also using the maps to interpret ultraviolet observations of the corona. Says Dr. Morgan:

“These maps will also prove useful in the important field of space weather. Explosions at the Sun travel through space and often hit the Earth. These energetic magnetic clouds can disrupt communication, power supplies and be a major health hazard for astronauts and airline pilots. Understanding and predicting these storms is a major goal of solar science. The ability to map the whole 3D structure of the corona is a critical step towards achieving this goal.”