Solar Corona Revealed by Medical X-Ray Techniques

density_distribution.thumbnail.jpg

For several decades solar scientists have been hard at work trying to unravel the mysteries of the solar corona. Thanks to a medical x-ray technique known as tomography, scientists are able resolve solar activity in greater detail. By using a new way of processing images, active regions now take on dimensions never foreseen by computer models.

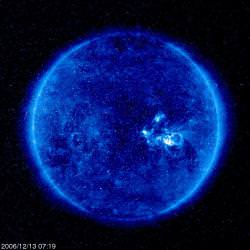
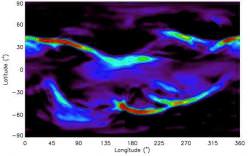
Today Dr. Huw Morgan presented his results to the Royal Astronomical Society National Meeting in Belfast. Using an adapted medical X-ray technique, scientists have produced the first detailed map of the structure of the Sun’s outermost layer, the corona. The application known as tomography uses a series of images taken from many different angles to reconstruct a 3-dimensional map created from direct solar observations.

“This is a breakthrough for scientists trying to understand the corona and the solar wind. We’ve been attempting to apply tomography to the solar corona for more than 30 years but it’s proved very difficult and very inaccurate until now. The new technique that I’ve developed is only in its infancy but shows great potential for areas of research like space weather,” said Dr Morgan, of the University of Aberystwyth.

The process has not been as easy one, nor is it a new idea. Without images of the coronal far side, researchers were left with only half the data. The near side produces its own difficulties as well, since the outermost areas of the corona are more than a thousand times fainter than the regions near the Sun. This factor introduces huge potential errors to observations. Thanks to Dr. Morgan, his new way of processing coronal images, called Qualitative Solar Rotational Tomography (QSRT), eliminates the steep drop in brightness and associated errors. With the help of SOHO’s LASCO instrument, Dr. Morgan applied the technique to a series of images taken as the Sun’s rotation brings the ‘missing’ areas into view. The result? Full coronal maps that are at least 5 times more detailed than previous tomographical studies of the Sun. And the future may hold far more. Says Morgan:

“I’ve now produced maps of the corona over almost a whole cycle of solar activity, so we can now see in unprecedented detail how structures develop and evolve in three-dimensions. The maps have produced some interesting results: for instance we’ve observed large areas of dense structures when the Sun is most active that are not predicted by current computer models. We’ve also found evidence that inner regions of the corona rotate at different speeds.”

According to the RAS press release, the technique is already being used by scientists at the Institute of Maths and Physics at Aberystwyth University to interpret their radio-wave observations of the solar wind. Dr. Morgan, together with colleagues at the Institute of Astronomy at the University of Hawaii, is also using the maps to interpret ultraviolet observations of the corona. Says Dr. Morgan:

“These maps will also prove useful in the important field of space weather. Explosions at the Sun travel through space and often hit the Earth. These energetic magnetic clouds can disrupt communication, power supplies and be a major health hazard for astronauts and airline pilots. Understanding and predicting these storms is a major goal of solar science. The ability to map the whole 3D structure of the corona is a critical step towards achieving this goal.”

The Sun Bursts to Life: Sunspots, Flares and CMEs

The new sunspots appearing as the Sun rotates (credit: Greg Piepol)

As if to remind us it is still there, the Sun has put on an explosive show of sunspots, flares and coronal mass ejections (CMEs). This is quite surprising as only last month it was declared that the Sun had just started a new solar cycle, and a period of minimum activity. Up until now, the solar disk has been void of any observable features… but like an invasion party, three sunspots have rotated into view, showing complex arcs of magnetic fieldlines (coronal loops), blasting plasma into space by the biggest flare observed this year. Observers have also recorded the radio burst from the CME, so if you want to know what a CME sounds like, read on…

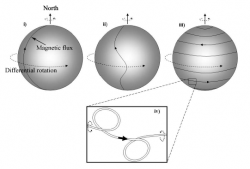
The magnetic flux of the Sun through the solar cycle (credit: Ian O'Neill)

The Sun undergoes an 11 year cycle, beginning at “solar minimum”, culminating at “solar maximum”, and then calming down toward minimum again. At solar minimum, the Sun’s magnetic field lines, reaching from pole to pole, are at their least stressed state. As the cycle progresses, the differential rotation of the Sun (i.e. the Sun rotates quicker at its equator) drags the magnetic field lines around the solar body like an elastic band. As time goes on, the magnetic field lines become so stressed and coiled that massive loops of magnetic flux breaks through the solar photosphere (the solar “surface”). As the Sun’s atmospheric layers are hotter than the Sun’s interior (a situation known at the “coronal heating problem“), as the magnetic loops of flux appear through the photosphere, the cooler interior is exposed. When this happens, sunspots appear; the cooler interior looks darker than the surrounding photosphere, therefore creating a spot, or a “sunspot”.

If there are a lot of sunspots, the magnetic field is most stressed, and the Sun is at its most active. The magnetic flux may get so stressed that it may “reconnect” with opposite polarities, releasing huge amounts of energy as flares. Coronal mass ejections may be unleashed from these flare events, sending hot solar plasma into space. If directed at the Earth, these CMEs can cause damage to satellites, astronauts, even whole power grids on the ground. Predicting space weather (i.e. observing solar dynamics) is therefore paramount to scientists.

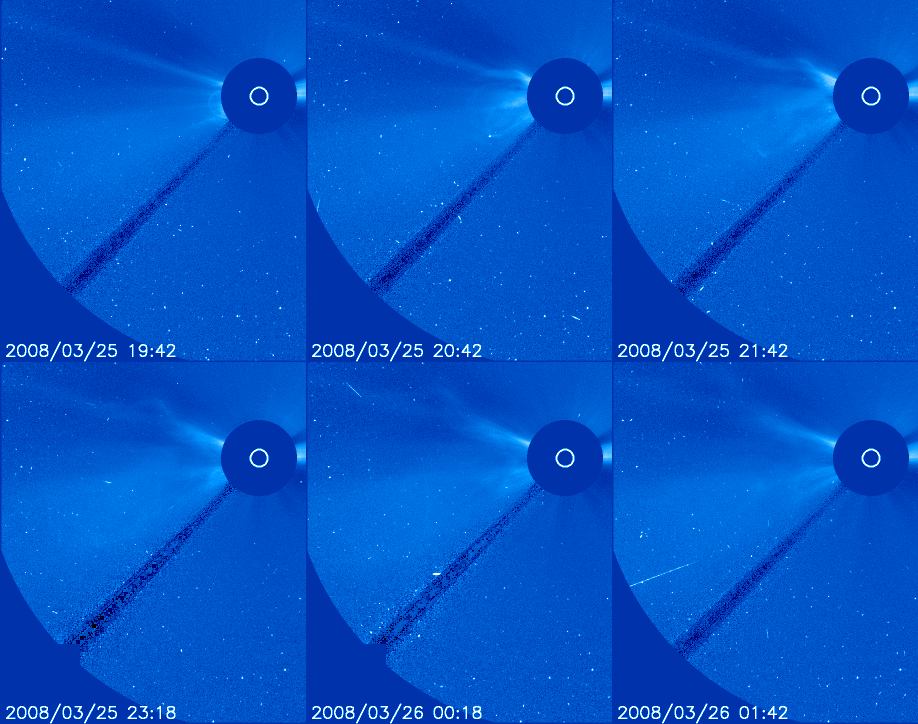
The CME caught by the Solar and Heliospheric Observatory, LASCO instrument (credit: SOHO)

Interestingly, these sunspots are not from a new cycle, they are actually “left overs” from the previous cycle. Solar astronomers know this by analysing Michelson Doppler Imager (MDI) images from the Solar and Heliospheric Observatory (SOHO) currently observing the Sun. The MDI instrument has revealed that the sunspots are of the same polarity as the spots from the previous solar cycle, and not from “Solar Cycle 24“.

Yesterday, the Sun unleashed an M2-class solar flare which in-turn created a large CME, propagating away from the solar disk. The CME was not directed toward Earth. A radio astronomer in New Mexico, Thomas Ashcraft, recorded the sound coming from his 21 MHz radio telescope during the event. He heard a strange “heaving sound” as the shock wave on the leading edge of the CME generated radio waves.

Listen to the sound of the radio wave emission from a CME as it travels from the Sun.

It was a Type II solar radio burst.” – Thomas Ashcraft, remarking on his observation of the CME.

Space weather predictions suggest there is a 50% chance of more M-class flares in the next 24 hours, so the world’s solar telescopes will be watching and waiting…

For more stunning images of the Sun by Greg Piepol (like the sunspots pictured at the top) see: http://www.sungazer.net/032508h.html

Source: spaceweather.com

Celebrate Sun-Earth Day 2008 on March 20

sun_earth_aurora.thumbnail.gif

Over the past seven years, NASA Sun-Earth Connection Education Forum has sponsored and coordinated education and public outreach events to highlight NASA Sun-Earth Connection research and discoveries. Their purpose is to interest school students and the general public to participate in programs that occur throughout the year and the kickoff is about to begin. This year’s main event will be on March 20, 2008.

Sun-Earth Day isn’t strictly limited to this single day. It’s a combination of programs and events throughout the year and celebrated this year on March 20. Middle schools are invited to participate, learn about solar science, solar energy and career choices. Following the events will prepare participants to watch a total solar eclipse on August 1, 2008 via a live web cast from China!

A wealth of website related resources provided by a collaboration of partners that include science centers and museums around the world, the Exploratorium, NASA Connect, Sun-Earth Connection missions and others, offer up awesome experiences like watching a Polar Sunrise. All you need is an Internet connection to visit the unscripted and unpredictable look into some of the latest information on Space Weather, Sun-Earth Day, Solar Week and the new ‘student based’ Space Weather Action Center at NASA Edge where they’re currently featuring programs on “The Sun-Earth Connection” and “Magnetospherence”. Visit the Solar Week website for educational classroom activities and games geared for upper elementary, middle and high school students with a focus on the Sun-Earth connection. Students learn about solar eclipses, sunspots, and solar storms through a series of activities, games, and lessons.

Get involved in Public Outreach! You don’t have to be in a classroom to share your love of astronomy and the Sun-Earth connection. Materials are available that have been specifically designed for you, the museums, planetaria, parks, youth clubs, and educators from community organizations around the globe. A wealth of Hands-On Sun-Earth Day Activities are available. Why not try enabling an idle computer at work with the Sun-Earth Viewer? Take the time to read a Sun-Earth Day Book to your children or grandchildren. It’s as easy as visiting the site and taking few moments to download.

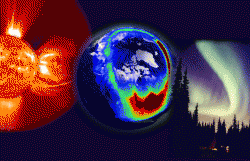
Do you want more? Learn about the aurora at Dancing in the Night Sky or how NASA engineers and researchers use data analysis and measurement to predict solar storms, anticipate how they will affect the Earth, and improve our understanding of the Sun-Earth system at Having A Solar Blast. Don’t forget other great resources like NASA TV or music at Rock Our World. Visit the download site and pick up great movies like “Introduction to the STEREO Mission – Solar Terrestrial Relations Observatory” and “Blackout: The Sun-Earth Connection”.

No matter what you choose to do, Sun-Earth Day is a great time to share with others and have fun!

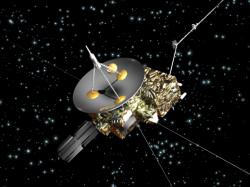
Ulysses Spacecraft Dying of Natural Causes

ulysses_hat-trick_l.thumbnail.jpg

“One equal temper of heroic heart
Made weak by time and fate, but strong in will
To strive, to seek, to find, and not to yield.”
—from the poem “Ulysses” by Alfred, Lord Tennyson

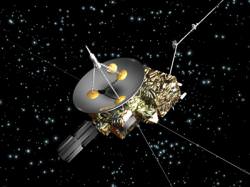
The Ulysses spacecraft has been heroically studying our sun for more than 17 years, almost four times its expected lifetime. But now, the mission might be finally succumbing to the harsh environment of space. Mission managers say the spacecraft will likely “die” in the next month or two.

“Little remains; but every hour is saved
From that eternal silence, something more,
A bringer of new things;
To Follow knowledge like a sinking star,
Beyond the utmost bound of human thought.”
(more from “Ulysses”)

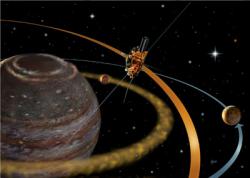
Ulysses is a joint mission between ESA and NASA that was launched in 1990 during space shuttle mission STS-41. Ulysses was the first mission to study the environment of space above and below the poles of the Sun. The spacecraft has returned a huge amount of data that has changed the way scientists view the Sun and its effect on the space surrounding it.

Ulysses.  Image credit:  ESA
Ulysses is in a six-year orbit around the Sun. Its long orbital path carries it out to Jupiter’s orbit and back again. The further it ventures from the Sun, the colder the spacecraft becomes. If it drops to 2ºC, the spacecraft’s hydrazine fuel will freeze.

This has not been a problem in the past because Ulysses carries heaters to maintain a workable on-board temperature. The spacecraft is powered by the decay of a radioactive isotope and over the 17-plus years, the power it has been supplying has been steadily dropping. Now, the spacecraft no longer has enough power to run all of its communications, heating and scientific equipment simultaneously.

“We expect certain parts of the spacecraft to reach 2ºC pretty soon,”says Richard Marsden, ESA’s Ulysses Project Scientist and Mission Manager. This will block the fuel pipes, making the spacecraft impossible to maneuver.

The ESA-NASA project team had tried to solve this problem by temporarily shutting of the main spacecraft transmitter, which would provide 60 watts of extra power that could be channeled back to the heater and science instruments. Unfortunately, the transmitter failed to turn back on.

“The decision to switch the transmitter off was not taken lightly. It was the only way to continue the science mission,”says Marsden, who is a 30-year veteran of the project, having worked on it for 12 years before the spacecraft was launched.

After many attempts, the Ulysses project team now consider it highly unlikely that the X-band transmitter will be recovered. They believe the fault can be traced to the power supply, meaning that the extra energy they hoped to gain cannot be routed to the heater and science instruments after all.

So, the spacecraft’s fuel lines are gradually freezing. This spells the end of this highly successful mission.

“Ulysses is a terrific old workhorse. It has produced great science and lasted much longer than we ever thought it would,” says Marsden. “This was going to happen in the next year or two, it has just taken place a little sooner than we hoped.”

The team plan to continue operating the spacecraft in its reduced capacity for as long as they can over the next few weeks. “We will squeeze the very last drops of science out of it,” says Marsden.

“Death closes all; but something ere the end,
Some work of noble note, may yet be done…
‘Tis not too late to seek a newer world…
To sail beyond the sunset.”
—more from “Ulysses” by Tennyson

Original News Source: ESA Press Release

Real-Time Solar Storm Warning Now Operational, Protecting Astronauts and Satellites

eitsolarstorm.thumbnail.jpg

Highly energetic solar particles are generated by solar flares and can be harmful to astronauts and sensitive satellite circuits. Solar flares are most likely to occur during periods of heightened solar activity (i.e. during solar maximum at the peak of the 11 year solar cycle), and future manned missions will need to be highly cautious not to be unprotected in space at these times. Many attempts are underway at forecasting solar activity so “solar storms” can be predicted, but a form of early warning system is required to allow time for astronauts to seek cover and satellites put in a low-power state. Now, using the Solar and Heliospheric Observatory (SOHO), scientists are testing a new method of detecting high energy solar ions, in real-time.

Using SOHO as an early warning system isn’t a new idea. Ideally positioned at the Sun-Earth First Lagrange Point (L1), SOHO orbits its little island of gravitational stability in direct line of sight to the Sun, 1.5 million km from the Earth. Anything that comes from the Sun will have to pass through the L1 point, firing through any robotic observers positioned there.

SOHO is in good company. Also positioned at the L1point is the Advanced Composition Explorer (ACE) that takes measurements of the solar wind as solar particles continue their way toward the Earth. However, the advanced instrumentation on SOHO allows it to detect very fast electrons (near-relativistic) as they are generated by the Sun. The Comprehensive Suprathermal and Energetic Particle Analyzer (COSTEP) instrument onboard SOHO has provided data about highly energetic particles since 1995, but it’s never been in real-time. Now, using a new technique, solar scientists are able to receive particle data with an hour warning of an impending storm of energetic ions.
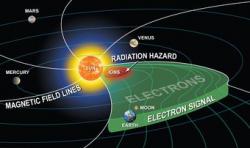
Fast electrons are received first, damaging high energy ions follow (credit: Southwest Research Institute)
When a flare explodes via magnetic interactions on the Sun, electrons and ions are accelerated and burst into space. Travelling at high speed, electrons reach SOHO much quicker than the heavier ions. What’s more, the relativistic electrons are harmless, so they provide an ideal, safe, indicator that the damaging ions are following behind.

The forecasting method was developed eight months ago by Dr Arik Posner (Southwest Research Institute, USA) and scientists from the University of Kiel (Germany), NASA’s Goddard Space Flight Center (USA) and the University of Turku (Finland). Oliver Rother from the University of Kiel has seen the potential for the new real-time system and explains, “We were so excited by Posner’s project that we immediately teamed up and developed new software that displays the data and can give a warning three minutes after taking the measurements 1.5 million km away.”

This is obviously good news for any astronaut in Earth orbit, but generally they are protected from intermediate solar storms as they are within the protective shield of the magnetosphere. This system will be most useful for the future colonists of the Moon and any long-haul manned missions to Mars. It may only be an hours warning, but that hour could make all the difference between mission success and mission failure.

Source: SpaceRef.com

The “Astronomical Unit” May Need an Upgrade as the Sun Loses Mass

sunmass.thumbnail.jpg

The Sun is constantly losing mass. Our closest star is shedding material through the solar wind, coronal mass ejections and by simply generating light. As the burning giant begins a new solar cycle, it continues to lose about 6 billion kilograms (that’s approximately 16 Empire State Building’s worth) of mass per second. This may seem like a lot, but when compared with the total mass of the Sun (of nearly 2×1030 kilograms), this rate of mass loss is miniscule. However small the mass loss, the mass of the Sun is not constant. So, when using the Astronomical Unit (AU), problems will begin to surface in astronomical calculations as this “universal constant” is based on the mass of the Sun…

The AU is commonly used to describe distances within the Solar System. For instance, one AU is approximately the mean distance from the Sun to Earth orbit (defined as 149,597,870.691 kilometres). Mars has an average orbit of 1.5AU, Mercury has an average of about 0.4AU… But how is the distance of one AU defined? Most commonly thought to be derived as the mean distance of the Sun-Earth orbit, it is actually officially defined as: the radius of an unperturbed circular orbit that a massless body would revolve about the Sun in 2Ï€/k days (that’s one year). There lies the problem. The official calculation is based on “k”, a constant based on the estimated constant mass of the Sun. But the mass of the Sun ain’t constant.

As mass is lost via the solar wind and radiation (radiation energy will carry mass from the Sun due to the energy-mass relationship defined by Einstein’s E=mc2), the value of the Astronomical Unit will increase, and by its definition, the orbit of the planets should also increase. It has been calculated that Mercury will lag behind it’s current orbital position in 200 years time by 5.5 km if we continue to use today’s AU in future calculations. Although a tiny number – astrophysicists are unlikely to lose any sleep over the discrepancy – a universal constant should be just that, constant. There are now calls to correct for this gradual increase in the value of the AU by discarding it all together.

[The current definition is] fine for first-year science courses. But for scientific and engineering usage, it is essential to get it right.” – Peter Noerdlinger, astronomer at St Mary’s University, Canada.

Correcting classical “constants” in physics is essential when high accuracy is required to calculate quantities over massive distances or long periods of time, therefore the AU (as it is currently defined) may be demoted as a general description of distance rather than a standard scientific unit.

Source: New Scientist

Ulysses Passes Over Sun’s North Pole

ulysses_spacecraft.thumbnail.jpg

Continuing on its epic journey around the Sun, Ulysses has reached the Sun’s north pole just in the nick of time. In fact, its timing couldn’t be better, just as the Sun begins “Solar Cycle 24”. The probe is in a unique orbit, passing over the solar north and south poles, out of the ecliptic plane of the solar system, giving it an unprecedented view of parts of the Sun we cannot observe on Earth. “Graveyards for sunspots” and mysterious coronal holes lurk in these regions and Ulysses will be perfectly placed, directly above.

The joint NASA and ESA Ulysses mission has been a resounding success in its 18 years of operation since launch on board Space Shuttle Discovery (STS-41) in October 1990. The intrepid spacecraft was helped on it’s way by a gravitational assist by the planet Jupiter which flung it over the poles of the Sun. Quietly travelling in a perpendicular orbit (space missions and the planets usually orbit around the Sun’s equator), Ulysses has been measuring the distribution of solar wind particles emanating from latitudinal locations for one and a half orbits.

As Ulysses passes over the north polar region, the Sun will be observed during a period of minimum activity at this location for the first time. The poles of the Sun are of particular interest to scientists as this is where the fast solar wind originates from open magnetic field lines reaching into space. The dynamics of solar material in this location provides information on how the Sun interacts with interplanetary space and how the solar wind is generated. Observing the solar wind at “solar minimum” will be of massive interest as it may provide some answers as to why the solar wind is accelerated hundreds of kilometers per hour even when activity is at its lowest.

Just as Earth’s poles are crucial to studies of terrestrial climate change, the sun’s poles may be crucial to studies of the solar cycle.” – Ed Smith, Ulysses project scientist, NASA Jet Propulsion Laboratory.

The dynamics of low altitude magnetic fields in polar regions are also a focus for interest. As 11-year solar cycles progress, sunspot population increase near the solar equator. As the magnetic field is “wound up”, sunspots (and their associated magnetic flux) drift toward the poles where they slowly disappear as the old magnetic field sinks back into the Sun, quite accurately described as sunspot graveyards. Understanding how this cycle works will help to reveal the secrets of the solar cycle and ultimately help us understand the mechanisms behind Space Weather.

Source: NASA Featured News

SoHO Celebrates its 12th Birthday

171cycle_dates.thumbnail.jpg

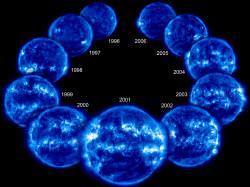
On December 2nd, 1995 a large joint ESA and NASA mission was launched to gain an insight to the dynamics of the Sun and its relationship with the space between the planets. 12 years on, the Solar and Heliospheric Observatory (SoHO) continues to witness some of the largest explosions ever seen in the solar system, observes beautiful magnetic coronal arcs reach out into space and tracks comets as they fall to a fiery death. In the line of duty, SoHO even suffered a near-fatal shutdown (in 1998). As far as astronomy goes, this is a tough assignment.

By the end of 1996, SoHO had arrived at the First Lagrange Point between the Earth and the Sun (a gravitationally stable position balanced by the masses of the Sun and Earth, about 1.5 million km away) and orbits this silent outpost to this day. It began to transmit data at “solar minimum”, a period of time at the beginning of the Solar Cycle, where sunspots are few and solar activity is low, and continues toward the upcoming solar minimum after the exciting firworks of the last “solar maximum”. This gives physicists another chance to observe the majority of a Solar Cycle with a single observatory (the previous long-lasting mission was the Japanese Yohkoh satellite from 1991-2001).

On board this ambitious observatory, 11 instruments constantly gaze at the Sun, observing everything from solar oscillations (“Sun Quakes�), coronal loops, flares, CMEs and the solar wind; just about everything the Sun does. SoHO has become an indispensable mission for helping us to understand how the Sun influences the environment around our planet and how this generates the potentially dangerous “Space Weather�.

The SoHO mission site confidently states that SoHO will remain in operation far into the next Solar Cycle. I hope this is the case as the new Hinode and STEREO probes will be good company for this historic mission.

Source: NASA News Release

Hinode Discovers the Sun’s Hidden Sparkle

hinode_xray_jet.thumbnail.jpg

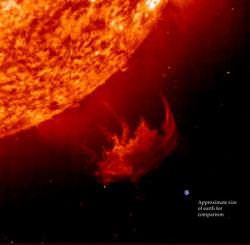
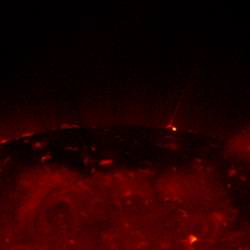
Blinking spots of intense light are being observed all over the lower atmosphere of the Sun. Not just in the active regions, but in polar regions, quiet regions, sunspots, coronal holes and loops. These small explosions fire elegant jets of hot solar matter into space, generating X-rays as they go. Although X-ray jets are known to have existed for many years, the Japanese Hinode observatory is seeing these small flares with unprecedented clarity, showing us that X-ray jets may yet hold the answers to some of the most puzzling questions about the Sun and its hot corona.

Although a comparatively small mission (weighing 875 kg and operating just three instruments), Hinode is showing the world some stunning high resolution pictures of our nearest star. In Earth orbit and kitted out with an optical telescope (the Solar Optical Telescope, SOT), Extreme ultraviolet Imaging Spectrometer (EIS) and an X-Ray Telescope (XRT), the light emitted from the Sun can be split into its component optical, ultraviolet and X-ray wavelengths. This in itself is not new, but never before has mankind been able to view the Sun in such detail.

It is widely believed that the violent, churning solar surface may be the root cause of accelerating the solar wind (blasting hot solar particles into space at a mind-blowing 1.6 million kilometers per hour) and heating the million plus degree solar atmosphere. But the small-scale processes close to the Sun driving the whole system are only just beginning to come into focus.

Up until now, small-scale turbulent processes have been impossible to observe. Generally, any feature below 1000 km in size has remained undetected. Much like trying to follow a golf ball in flight from 200 meters away, it is very difficult (try it!). Compare this with Hinode, the same golf ball can be resolved by the SOT instrument from nearly 2000 km away. That’s one powerful telescope!

The limit of observable solar features has now been lifted. The SOT can resolve the fine structure of the solar surface to 180 km, this is an obvious improvement. Also, the EIS and XRT can capture images very quickly, one per second. The SOT can produce hi-res pictures every 5 minutes. Therefore, fast, explosive events such as flares can be tracked easier.

Putting this new technology to the test, a team led by Jonathan Cirtain, a solar physicist at NASA’s Marshall Space Flight Center, Huntsville, Alabama, has unveiled new results from research with the XRT instrument. X-ray jets in the highly dynamic chromosphere and lower corona appear to occur with greater regularity than previously thought.

X-ray jets are very important to solar physicists. As magnetic field lines are forced together, snap, and form new configurations, vast quantities of heat and light are generated in the form of a “microflare”. Although these are small events on a solar scale, they still generate huge amounts of energy, heating solar plasma to over 2 million Kelvin, create spurts of X-ray emitting plasma jets and generate waves. This is all very interesting, but why are jets so important?

The solar atmosphere (or corona) is hot. In fact, very hot. Actually, it is too hot. What I’m trying to say is that measurements of coronal particles tell us the atmosphere of the Sun is actually hotter than the Suns surface. Traditional thinking would suggest that this is wrong; all sorts of physical laws would be violated. The air around a light bulb isn’t hotter than the bulb itself, the heat from an object will decrease the further away you measure the temperature (obvious really). If you’re cold, you don’t move away from the fire, you get closer to it!

The Sun is different. Through interactions near the surface of the Sun between plasma and magnetic flux (a field known as “magnetohydrodynamics” – magneto = magnetic, hydro = fluid, dynamics = motion: “magnetic-fluid-motion” in plain English, or “MHD” for short), MHD waves are able to propagate and heat up the plasma. The MHD waves under scrutiny are known as “Alfvén wavesâ€? (named after Hannes Alfvén, 1908-1995, the plasma physics supremo) which, theoretically, carry enough energy from the Sun to heat the solar corona hotter than the solar surface. The one thing that has dogged the solar community for the last half a century is: how are Alfvén waves produced? Solar flares have always been a candidate as a source, but observation suggested that there wasn’t enough flares to generate enough waves. But now, with advanced optics used by Hinode, many small-scale events appear to be common… bringing us back to our X-ray jets…

Previously, only the largest X-ray jets have been observed, putting this phenomenon at the bottom of the priority list. NASA’s Marshall Space Flight Center group has now turned this idea on its head by observing hundreds of jet events each and every day:

“We now see that jets happen all the time, as often as 240 times a day. They appear at all latitudes, within coronal holes, inside sunspot groups, out in the middle of nowhere–in short, wherever we look on the sun we find these jets. They are a major form of solar activity” – Jonathan Cirtain, Marshall Space Flight Center.

So, this little solar probe has very quickly changed our views on solar physics. Launched on September 23, 2006, by a consortium of countries including Japan, USA and Europe, Hinode has already revolutionized our thinking about how the Sun works. Not only looking deep into the chaotic processes in the solar chromosphere, it is also finding new sources where Alfvén waves may be generated. Jets are now confirmed as common events that occur all over the Sun. Could they provide the corona with enough Alfvén waves to heat the Sun’s corona more than the Sun itself? I don’t know. But what I do know is, the sight of solar jets flashing to life in these movies is awesome, especially as you see the jet launch into space from the original flash. This is also a very good time to be seeing this amazing phenomenon, as Jonathan Cirtain points out the site of solar jets reminds him of “the twinkle of Christmas lights, randomly oriented. It’s very pretty”. Even the Sun is getting festive.

Cancer Rates Rise and Fall with Cosmic Rays

Showers of high energy particles occur when energetic cosmic rays strike the top of the Earth's atmosphere. Illustration Credit: Simon Swordy (U. Chicago), NASA.

Cancer is a mysterious and complicated disease, with many different types and causes. Researchers are still trying to track down all of the environmental effects that can lead to the disease, as anything from what someone eats to where they live determines the probability of developing cancer. A paper published in 2007 in the International Journal of Astrobiology looked at data for cancer deaths from around the world for the past 140 years, and found a strong correlation between rises in cancer deaths and the variation over time in the amount of galactic cosmic rays we encounter here on Earth.

In a paper titled, Correlation of a 140-year global time signature in cancer mortality birth cohorts with galactic cosmic ray variation by Dr. David A. Juckett from the Barros Research Institute at Michigan State University, he showed that the amount of deaths due to cancer on a global scale was higher when the background cosmic rays originating from outside the Solar System were more numerous.

The study looked at available cancer death data from the United States, United Kingdom, Australia, Canada and New Zealand for the past 100-140 years. These data were compared with the amount of variations in galactic cosmic rays during the same period, taken from analysis of ice core samples from Greenland and Antarctica.

Dr. Juckett showed that as the amount of cosmic ray activity increased, the number of people who died from cancer was also higher. There are two peaks in cosmic ray activity during this point, around 1800 and 1900, and a low point around 1860. The total deaths due to cancer were highest, though, around 1830 and 1930, and lowest in the 1890’s.

There is a 28-year lag between the increased presence of cosmic rays and the increase in cancer deaths. It’s not so simple as a person being exposed to cosmic rays and then developing cancer immediately afterwards. What is called the “grandmother effect” comes into play; the cosmic rays actually damage the germ cells of one’s parent while that parent is still in the grandmother’s womb.

“The grandmother would have to be exposed to radiation – which she is all the time – while she is pregnant with the mother of the affected individual. What this is basically implying is that, during a sensitive time in pregnancy, the constant background radiation may cause a chemical change in just the right cell and DNA stretch to lead to future cancer. The background radiation is causing very low level damage all the time to random cells in the body, but anything significant happening to germ cells would lead to a whole organism eventually carrying that damage (or predisposition),” said Dr. Juckett.

So, the parent is exposed to cosmic rays while the fetus is still developing, and this damage then emerges as cancer in child, but is not passed down further.

Galactic cosmic rays consist of high-energy radiation, and are composed primarily of high-energy protons and atomic nuclei. Their origin in not fully understood, but are thought to possibly come from supernovae, active galactic nuclei, quasars and/or gamma ray bursts.

There are several factors that may contribute to the flux of cosmic rays, and they may produce showers of secondary particles that penetrate and impact the Earth’s atmosphere and sometimes reach the surface.

In the study, the researchers found the trend between cosmic ray increase and cancer death increase was a global effect, but there are places on the Earth where the magnetosphere blocks more of the cosmic rays than others. At about 10°N of the equator, fewer cosmic rays get through than elsewhere on the Earth because of the way the Earth’s magnetosphere blocks energetic particles.

People in more northern and southern latitudes are exposed to more of this radiation, thus the rates of cancer death were higher in these regions than near the equator. On average, the oscillation in cancer deaths was between 10-15% during the period of the study.

Any good scientist will tell you that correlation does not necessarily mean causation; the increase in cosmic rays matches well the increase in cancer deaths over this time period, but there could yet be other reasons for this increase.

Dr. Juckett cautions, “Of course, other explanations could be hypothesized. Standard epidemiological approaches would partition individual cases by risk factors (e.g., smoking, environment pollution, diet, age-at-menarche, family history, etc.). Only when there is no correlation to these would other hypotheses, like cosmic rays be entertained. Unfortunately, to look at the 100-yr data for long-term trends, this kind of information is generally not available. The one thing that seems certain is that the common oscillations in the US, UK, CA, NZ, and AU data suggest a global environmental signal of some kind. This does limit things a bit (e.g., solar radiation effects, cosmic ray effects, global pollution).”

The effects that cosmic rays and other types of radiation have on human beings are important to study, as we venture outside the protective magnetic field of the Earth into space. The researchers said that “this effect has profound implications for evolution, long-distance space travel and the colonization of planets with high background radiation.” Long journeys in space would expose astronauts to this same type of radiation for long periods of time, so taking precautions to protect them makes good sense.

What can one do to protect themselves from this type of radiation here on Earth?

“I cannot of think of anything one can do to protect themselves from their inherited propensities. However, cancer is a multi-step process. It still requires other random ‘mutations’ to occur during life. Healthy living is still called for. In other words, reducing exposure to toxins, radiation, and injury. Eventually, the biochemical fingerprints of possible inherited changes may be deciphered and then testing could be possible,” said Dr. Juckett.

There is no cause for alarm, though; cosmic rays are only about 20-30% of the background radiation we are exposed to every day, and are a minimal cause of cancer in comparison to other environmental effects such as smoking.

Original Source: International Journal of Astrobiology