How Common are Solar Systems Like Ours?

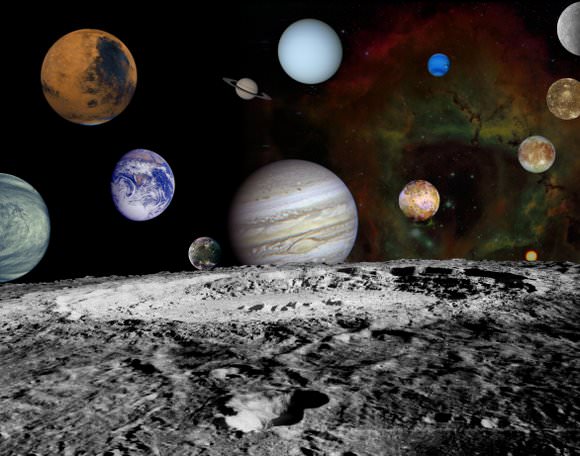
Solar system montage. Credit: NASA

On the whole, we’d like to think we’re special, but we also hope we aren’t alone in the Universe. Astronomers have been trying to figure out just how common solar systems like ours are across the cosmos, and during one moment of epiphany one scientist figured out how to make the calculations. It took a worldwide collaboration of astronomers to do the work, but they concluded that about 10 – 15 percent of stars in the universe host systems of planets like our own, with several gas giant planets in the outer part of the solar system.

“Now we know our place in the universe,” said Ohio State University astronomer Scott Gaudi. “Solar systems like our own are not rare, but we’re not in the majority, either.”

The find comes from a collaboration headquartered at Ohio State called the Microlensing Follow-Up Network (MicroFUN), which searches the sky for extrasolar planets.

MicroFUN astronomers use gravitational microlensing — which occurs when one star happens to cross in front of another as seen from Earth. The nearer star magnifies the light from the more distant star like a lens. If planets are orbiting the lens star, they boost the magnification briefly as they pass by.

During his talk at the American Astronomical Society meeting in Washington, DC today, Gaudi said, “Planetary microlensing basically is looking for planets you can’t see around stars you can’t see.”

This method is especially good at detecting giant planets in the outer reaches of solar systems — planets analogous to our own Jupiter.

This latest MicroFUN result is the culmination of 10 years’ work — and one sudden epiphany, explained Gaudi and Andrew Gould, professor of astronomy at Ohio State.

Ten years ago, Gaudi wrote his doctoral thesis on a method for calculating the likelihood that extrasolar planets exist. At the time, he concluded that less than 45 percent of stars could harbor a configuration similar to our own solar system.

Then, in December of 2009, Gould was examining a newly discovered planet with Cheongho Han of the Institute for Astrophysics at Chungbuk National University in Korea. The two were reviewing the range of properties among extrasolar planets discovered so far, when Gould saw a pattern.

“Basically, I realized that the answer was in Scott’s thesis from 10 years ago,” Gould said. “Using the last four years of MicroFUN data, we could add a few robust assumptions to his calculations, and we could now say how common planet systems are in the universe.”

The find boils down to a statistical analysis: in the last four years, the MicroFUN survey has discovered only one solar system like our own — a system with two gas giants resembling Jupiter and Saturn, which astronomers discovered in 2006 and reported in the journal Science in 2008.

“We’ve only found this one system, and we should have found about eight by now — if every star had a solar system like Earth’s,” Gaudi said.

The slow rate of discovery makes sense if only a small number of systems — around 10 percent — are like ours, they determined.

“While it is true that this initial determination is based on just one solar system and our final number could change a lot, this study shows that we can begin to make this measurement with the experiments we are doing today,” Gaudi added.

As to the possibility of life as we know it existing elsewhere in the universe, scientists will now be able to make a rough guess based on how many solar systems are like our own.

Our solar system may be a minority, but Gould said that the outcome of the study is actually positive.

“With billions of stars out there, even narrowing the odds to 10 percent leaves a few hundred million systems that might be like ours,” he said.

At the AAS conference today, Gaudi was awarded the Helen B. Warner Prize for Astronomy.

Source: AAS, EurekAlert

Mars 2016 Methane Orbiter: Searching for Signs of Life

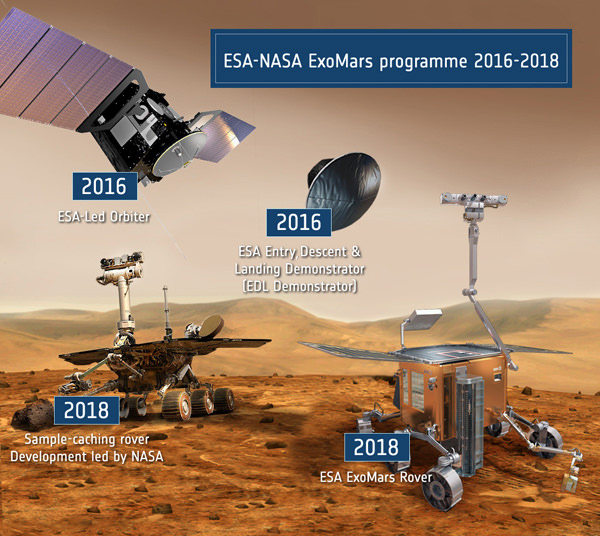
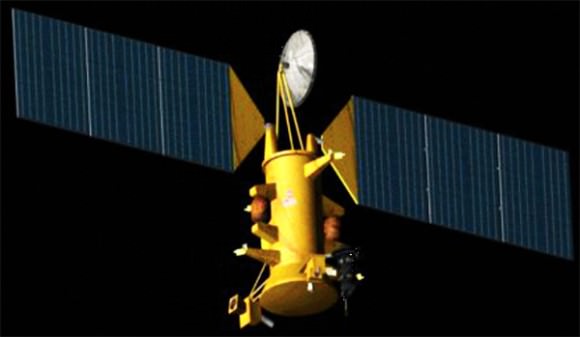
Elements of the ESA-NASA ExoMars program 2016-2018. Credit: ESA

[/caption]

The new joint Mars exploration program of NASA and ESA is quickly pushing forward to implement an agreed upon framework to construct an ambitious new generation of red planet orbiters and landers starting with the 2016 and 2018 launch windows.

The European-led ExoMars Trace Gas Mission Orbiter (TGM) has been selected as the first spacecraft of the joint initiative and is set to launch in January 2016 aboard a NASA supplied Atlas 5 rocket for a 9 month cruise to Mars. The purpose is to study trace gases in the martian atmosphere, in particular the sources and concentration of methane which has significant biological implications. Variable amounts of methane have been detected by a martian orbiter and ground based telescopes on earth. The orbiter will likely be accompanied by a small static lander provided by ESA and dubbed the Entry, Descent and Landing Demonstrator Module (EDM).

The NASA Mars Program is shifting its science strategy to coincide with the new joint venture with ESA and also to build upon recent discoveries from the current international fleet of martian orbiters and surface explorers Spirit, Opportunity and Phoenix (see my earlier mars mosaics). Doug McCuiston, NASA’s director of Mars Exploration at NASA HQ told me in an interview that, “NASA is progressing quickly from ‘Follow the Water’ through assessing habitability and on to a theme of ‘Seeking the Signs of Life’. Looking directly for life is probably a needle in the haystack, but the signatures of past or present life may be more wide spread through organics, methane sources, etc”.

NASA and ESA will issue an “Announcement of Opportunity for the orbiter in January 2010” soliciting proposals for a suite of science instruments according to McCuiston. “The science instruments will be competitively selected. They are open to participation by US scientists who can also serve as the Principal Investigators (PI’s)”. Proposals are due in 3 months and will be jointly evaluated by NASA and ESA. Instrument selections are targeted for announcement in July 2010 and the entire cost of the NASA funded instruments is cost capped at $100 million.

Mars Trace Gas Mission orbiter slated for 2016 launch is the first spacecraft in the new ESA & NASA Mars Exploration Joint Initiative. Credit: NASA ESA

“The 2016 mission must still be formally approved by NASA after a Preliminary Design Review, which will occur either in late 2010 or early 2011. Funding until then is covered in the Mars Program’s Next Decade wedge, where all new-start missions reside until approved, or not, by the Agency”, McCuiston told me. ESA’s Council of Ministers just gave the “green light” and formally approved an initial budget of 850 million euros ($1.2 Billion) to start implementing their ExoMars program for the 2016 and 2018 missions on 17 December at ESA Headquarters in Paris, France. Another 150 million euros will be requested within two years to complete the funding requirement for both missions.

ESA has had to repeatedly delay its own ExoMars spacecraft program since it was announced several years ago due to growing complexity, insufficient budgets and technical challenges resulting in a de-scoping of the science objectives and a reduction in weight of the landed science payload. The ExoMars rover was originally scheduled to launch in 2009 and is now set for 2018 as part of the new architecture.

The Trace Gas orbiter combines elements of ESA’s earlier proposed ExoMars orbiter and NASA’s proposed Mars Science Orbiter. As currently envisioned the spacecraft will have a mass of about 1100 kg and carry a roughly 115 kg science payload, the minimum deemed necessary to accomplish its goals. The instruments must be highly sensitive in order to be capable of detecting the identity and extremely low concentration of atmospheric trace gases, characterizing the spatial and temporal variation of methane and other important species, locating the source origin of the trace gases and determining if they are caused by biologic or geologic processes. Current photochemical models cannot explain the presence of methane in the martain atmosphere nor its rapid appearance and destruction in space, time or quantity.

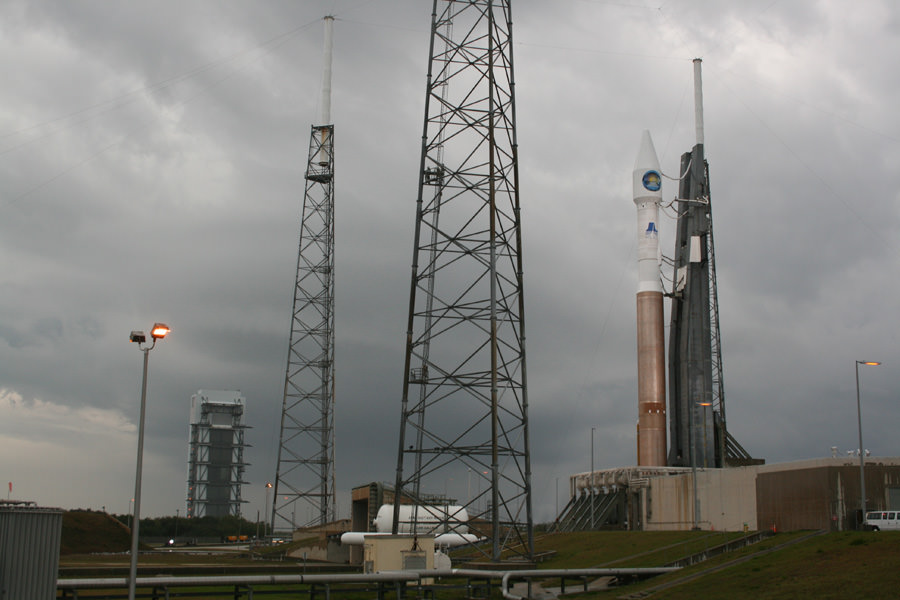
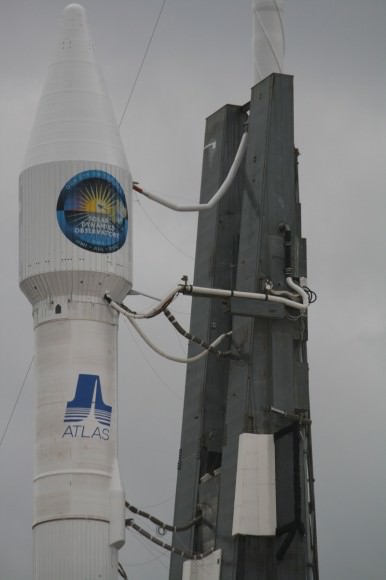
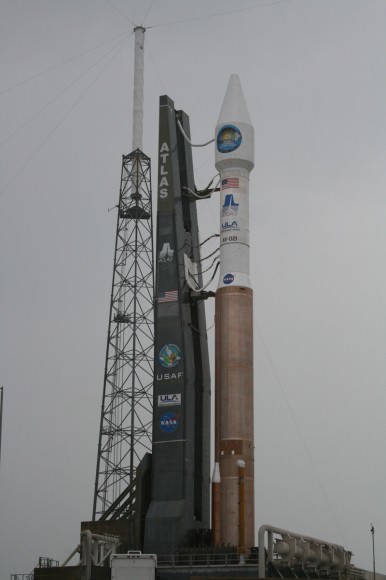
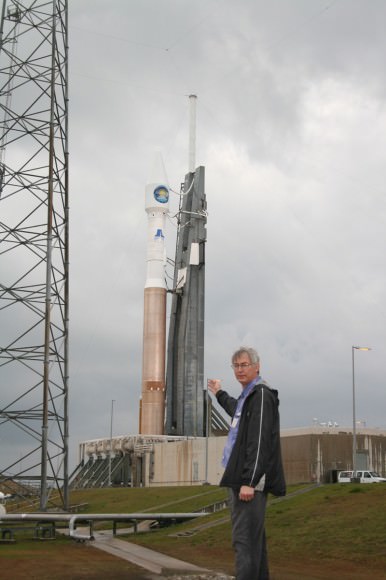
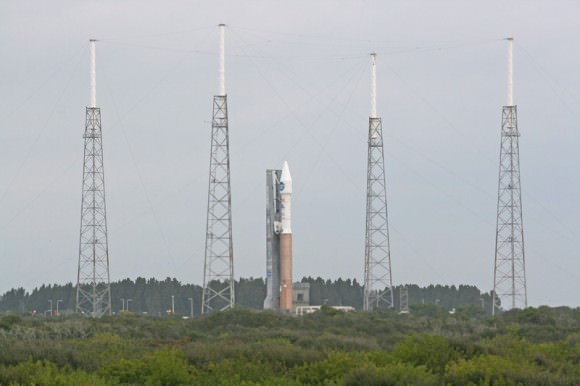
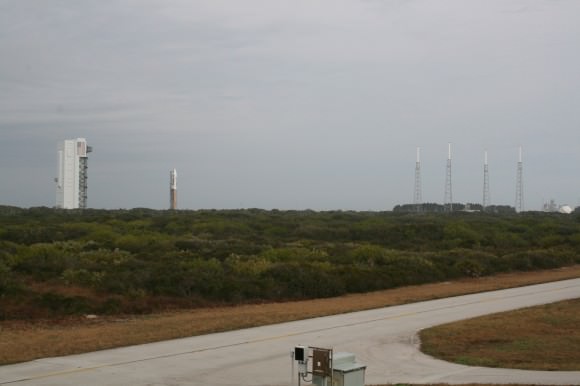
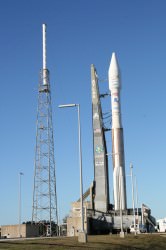
An Atlas rocket similar to this vehicle I observed at Cape Canaveral Pad 41 is projected to launch the 2016 Mars orbiter. Credit: Ken Kremer

Among the instruments planned are a trace gas detector and mapper, a thermal infrared imager and both a wide angle camera and a high resolution stereo color camera (1 – 2 meter resolution). “All the data will be jointly shared and will comply with NASA’s policies on fully open access and posting into the Planetary Data System”, said McCuiston.
Another key objective of the orbiter will be to establish a data relay capability for all surface missions up to 2022, starting with 2016 lander and two rovers slotted for 2018. This timeframe could potentially coincide with Mars Sample Return missions, a long sought goal of many scientists.

If the budget allows, ESA plans to piggyback a small companion lander (EDM) which would test critical technologies for future missions. McCuiston informed me that, “The objective of this ESA Technology Demonstrator is validating the ability to land moderate payloads, so the landing site selection will not be science-driven. So expect something like Meridiani or Gusev—large, flat and safe. NASA will assist ESA engineering as requested, and within ITAR constraints.” EDM will use parachutes, radar and clusters of pulsing liquid propulsion thrusters to land.

“ESA plans a competitive call for instruments on their 3-4 kg payload”, McCuiston explained. “The Announcement of Opportunity will be open to US proposers as well so there may be some US PI’s. ESA wants a camera to ‘prove’ they got to the ground. Otherwise there is no significant role planned for NASA in the EDM”.

The lander would likely function as a weather station and be relatively short lived, perhaps 8 Sols or martian days, depending on the capacity of the batteries. ESA is not including a long term power source, such as from solar arrays, so the surface science will thus be limited in duration.

The orbiter and lander would separate upon arrival at Mars. The orbiter will use a series of aerobraking maneuvers to eventually settle into a 400 km high circular science orbit inclined at about 74 degrees.

The joint Mars architecture was formally agreed upon last summer at a bilateral meeting between Ed Weiler (NASA) and David Southwood (ESA) in Plymouth, UK. Weiler is NASA’s Associate Administrator for the Science Mission Directorate and Southwood is ESA’s Director of Science and Robotic Exploration. They signed an agreement creating the Mars Exploration Joint Initiative (MEJI) which essentially weds the Mars programs of NASA and ESA and delineates their respective program responsibilities and goals.

“The key to moving forward on Mars exploration is international collaboration with Europe”, Weiler said to me in an interview. “We don’t have enough money to do these missions separately. The easy things have been done and the new ones are more complex and expensive. Cost overruns on Mars Science Lab (MSL) have created budgetary problems for future mars missions”. To pay for the MSL overrun, funds have to be taken from future mars budget allocations from fiscal years 2010 to 2014.

“2016 is a logical starting point to work together. NASA can have a 2016 mission if we work with Europe but not if we work alone. We can do so much more by working together since we both have the same objectives scientifically and want to carry out the same types of mission”. Weiler and Southwood instructed their respective science teams to meet and lay out a realistic and scientifically justifiable approach. Weiler explained to me that his goal and hope was to reinstate an exciting Mars architecture with new spacecraft launching at every opportunity which occurs every 26 months and which advance the state of the art for science. “It’s very important to demonstrate a critical new technology on each succeeding mission”.

More on the 2018 mission plan and beyond in a follow up report.

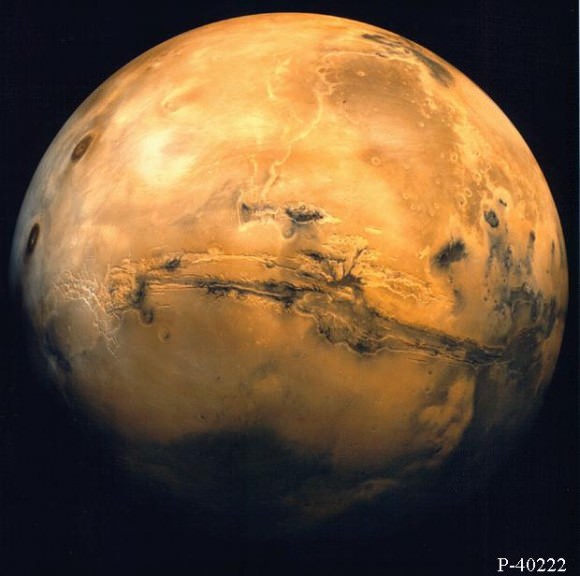
Mars from orbit.  Valles Marineris and Volcanic region
Mars from orbit. Valles Marineris and Volcanic region

Jupiter – Our Silent Guardian?

Jupiter photo. Image credit: NASA/SSI

[/caption]

We live in a cosmic shooting gallery. In Phil Plait’s Death From the Skies, he lays out the dangers of a massive impact: destructive shockwaves, tsunamis, flash fires, atmospheric darkening…. The scenario isn’t pretty should a big one come our way. Fortunately, we may have a silent guardian: Jupiter.


Although many astronomers have assumed that Jupiter would likely sweep out dangerous interlopers (an important feat if we want life to gain a toehold), little work has been done to actually test the idea. To explore the hypothesis, a recent series of papers by J. Horner and B. W. Jones explores the effects of Jupiter’s gravitational pull on three different types of objects: main belt asteroids (which orbit between Mars and Jupiter), short period comets, and in their newest publication, submitted to the International Journal of Astrobiology, the Oort cloud comets (long period comets with the most distant part of their orbits far out in the solar system). In each paper, they simulated the primitive solar systems with the bodies in question with an Earth like planet, and gas giants of varying masses to determine the effect on the impact rate.

Somewhat surprisingly, for main belt asteroids, they determined, “that the notion that any ‘Jupiter’ would provide more shielding than no ‘Jupiter’ at all is incorrect.” Even without the simulation, the astronomers say that this should be expected and explain it by noting that, although Jupiter may shepherd some asteroids, it is also the main gravitational force perturbing their orbits and causing them to move into the inner solar system, where they may collide with Earth.

Contrary to the popular wisdom (which expected that the more massive the planet, the better it would shield us), there were notably fewer asteroids pushed into our line of sight for lower masses of the test Jupiter. Also surprisingly, they found that the most dangerous scenario was an instance in which the test Jupiter had 20% in which the planet “is massive enough to efficiently inject objects to Earth-crossing orbits.” However, they note that this 20% mass is dependent on how they chose to model the primordial asteroid belt and would likely change had they chosen a different model.

When the simulation was redone for for short period comets, they again found that, although Jupiter (and the other gas giants) may be effective at removing these dangerous objects, quite often they did so by sending them our way. As such, they again concluded that, as with asteroids, Jupiter’s gravitational jiggling was more dangerous than it was helpful.

Their most recent treatise explored Oort cloud objects. These objects are generally considered the largest potential threat since they normally reside so far out in the solar system’s gravitational well and thus, will have a greater distance to fall in and pick up momentum. From this situation, the researchers determined that the more massive the planet in Jupiter’s orbit, the better it does protect us from Oort cloud comets. The attribute this to the fact that these objects are initially so far from the Sun, that they are scarcely bound to the solar system. Even a little bit of extra momentum gained if they swing by Jupiter will likely be sufficient to eject them from the solar system all together, preventing them from settling into a closed orbit that would endanger the Earth every time it passed.

So whether or not Jupiter truly defends us or surreptitiously nudges danger our way depends on the type of object. For asteroids and short period comets, Jupiter’s gravitational agitation shoves more our direction, but for the ones that would potentially hurt is the most, the long period comets, Jupiter does provide some relief.

Cold as Hell with a Chance of Dust Storms: Weather Movies from Mars

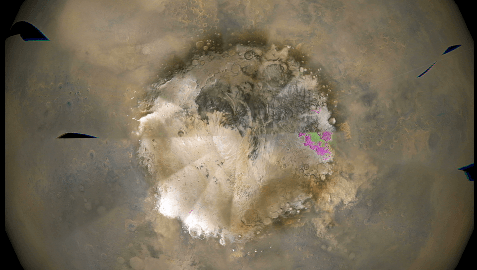
Caption: One frame from an animation of weather patterns around the south pole of Mars. Credit: NASA/JPL-Caltech/MSSS

If you think about it, those hypnotizing patterns of swirling clouds you see in TV weather reports are pretty amazing: satellites let us see what’s happening in the skies all over the world. But these days, that kind of global vision even goes beyond the Earth. The Mars Reconnaissance Orbiter makes daily weather observations of the Red Planet, and mission scientists regularly compile the pictures into movies that are available online. The result is that anyone can follow along as fierce dust storms rage across the plains of Mars, clouds cling to the peaks of towering volcanoes and polar ice advances and retreats.

On board the MRO is a wide-angle camera called the Mars Color Imager (MARCI) that scans the face of Mars in both visible and ultraviolet light. MARCI views Mars from pole to pole, snapping dozens of images every day that are combined into a global map with resolution comparable to weather satellites at home.

This daily weather report helps Mars explorers understand day-to-day events, as well as seasonal and annual changes on the Red Planet. Sometimes the weather watch also gives rover drivers a crucial warning when a storm might be headed in the direction of Spirit or Opportunity.

The weather images can be striking and intriguing. This animation shows the south pole of Mars during a period of about a month earlier this year, when storms raged along the retreating edge of frost in the polar cap. You can see giant, swirling clouds of dust, as well as the changing shape of the cap as it shrinks with the approach of Summer.

Malin Space Science Systems is the firm that built and operates MARCI for NASA’s Jet Propulsion Laboratory. They post weekly movies that show a spinning, global view of the most recent Martian weather. You never know what you’ll see each week, but a careful look often turns up water ice clouds, wind storms or the giant canyon Valles Marineris filled to the brim with dust.

The descriptions that Malin scientists write to accompany each movie are fascinating. They sound both as exotic as a science fiction novel–and as routine as your local weatherman’s report on the evening news. One sample:

“A large dust storm moved south down the Acidalia/Chryse/Xanthe corridor, partially spilling into eastern Valles Marineris at the beginning of the week. From there the storm moved over Thaumasia and Argyre, picking up intensity as it moved into the subtropics of Aonia and Icaria/Daedalia… Dust storms and water-ice clouds also formed in the northern mid-latitudes, with more notable activity occurring over Deuteronilus and Utopia. The increased amount of dust activity on the planet has created a haze that lingers in the atmosphere and has caused skies over both Opportunity and Spirit to be hazy during the past week.”

That’s why Mars fascinates. It’s an alien world that in some ways is tantalizing similar to home.

MARCI will be turned back on in early December after a hiatus of a few months. Previous weather movies are still online.

Cassini/IBEX Data Changes View of Heliosphere Shape

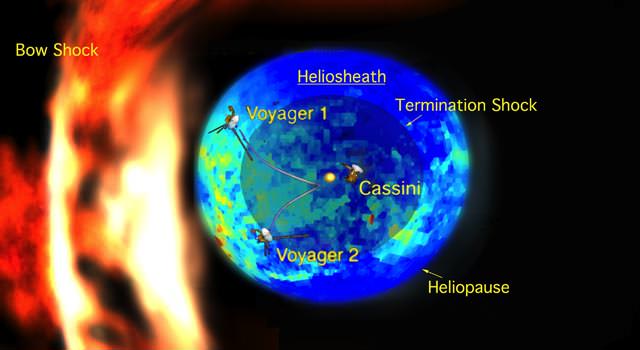
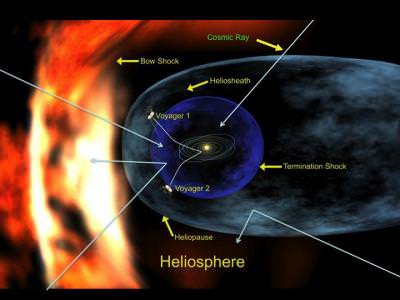
Though the Cassini mission has focused intently on scientific exploration of Saturn and its moons, data taken by the spacecraft has significantly changed the way astronomers think about the shape of our Solar System. As the Sun and planets travel through space, the bubble in which they reside has been thought to resemble a comet, with a long tail and blunt nose. Recent data from Cassini combined with that of other instruments, shows that the local intertstellar magnetic field shapes the heliosphere differently.

The Solar System resides in a bubble in the interstellar medium – called the “heliosphere” – which is created by the solar wind. The shape carved out of the interstellar dust by the solar wind has been thought for the past 50 years to resemble a comet, with a long tail and blunted nose shape, caused by the motion of the Solar System through the dust.

Data taken by Cassini’s Magnetospheric Imaging Instrument (MIMI) and the Interstellar Boundary Explorer (IBEX) shows that there is more to the forces that cause the shape than previously thought, and that the shape of the heliosphere more closely resembles a bubble.

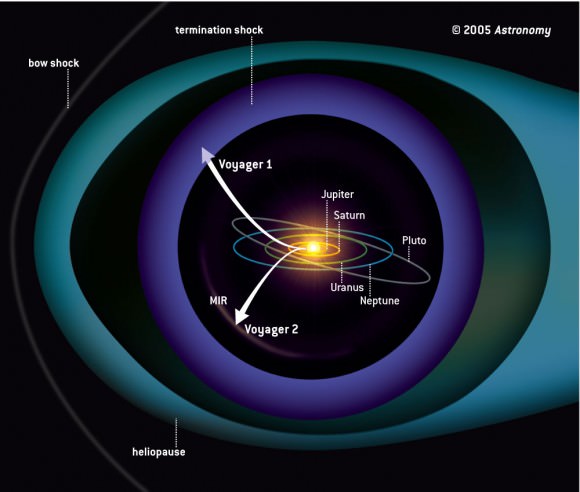
The shape of the heliosphere was previously thought to have been carved out solely by the interaction of the solar wind particles with the interstellar medium, the resulting “drag” creating a wispy tail. The new data suggests, however, that the interstellar magnetic field slips around the heliosphere and the outer shell, called the heliosheath, leaving the spherical shape of the heliosphere intact. Below is an image representing what the heliosphere was thought to look like before the new data.What the heliosphere was thought to be shaped like before the new measurements from Cassini and IBEX. Image Credit:JPL/NASA

The new data also provide a much clearer indication of how thick the heliosheath is, between 40 and 50 astronomical units. This means that NASA’s Voyager spacecraft, Voyager 1 and Voyager 2, which are both traveling through the heliosheath now, will cross into interstellar space before the year 2020. Previous estimates had put that date as far back as 2030.

MIMI was originally designed to take measurements of Saturn’s magnetosphere and surrounding energetic charged particle environment. Since Cassini is far away from the Sun, though, it also places the spacecraft in a unique position to measure the energetic neutral atoms coming from the boundaries of the heliosphere. Energetic neutral atoms form when cold, neutral gas comes into contact with electrically-charged particles in a plasma cloud. The positively-charged ions in plasma can’t reclaim their own electrons, so they steal those of the cold gas atoms. The resulting particles are then neutrally charged, and able to escape the pull of magnetic fields and travel into space.

Energetic neutral atoms form in the magnetic fields around planets, but are also emitted by the interaction between the solar wind and the interstellar medium. Tom Krimigis, principal investigator of the Magnetospheric Imaging Instrument (MIMI) at Johns Hopkins University’s Applied Physics Laboratory in Laurel, Md and his team weren’t sure if the instruments on Cassini would originally be able to detect sources of energetic neutral atoms from as far out as the heliosphere, but after their four-year study of Saturn, they looked into the data from the instrument to see if any particles had strayed in from sources outside the gas planet. To their surprise, there was enough data to complete a map of the intensity of the atoms, and discovered a belt of hot, high pressure particles where the interstellar wind flows by our heliosheath bubble.

The data from Cassini complements that taken by IBEX and the two Voyager spacecraft. The combined information from IBEX, Cassini and the Voyager missions enabled scientists to complete the picture of our little corner of space. To see a short animation of the heliosphere as mapped by Cassini, go here. The results of the combined imaging were published in Science on November 13th, 2009.

Source: JPL

Where Could Humans Survive in our Solar System?

Habitability in our solar system. Credit: UPR Arecibo, NASA PhotoJournal

[/caption]
If humans were forced to vacate Earth, where is the next best place in our solar system for us to live? A study by the University of Puerto Rico at Arecibo has provided a quantitative evaluation of habitability to identify the potential habitats in our solar system. Professor Abel Mendez, who produced the study also looked at how the habitability of Earth has changed in the past, finding that some periods were even better than today.

Mendez developed a Quantitative Habitability Theory to assess the current state of terrestrial habitability and to establish a baseline for relevant comparisons with past or future climate scenarios and other planetary bodies including extrasolar planets.

“It is surprising that there is no agreement on a quantitative definition of habitability,” said Mendez, a biophysicist. “There are well-established measures of habitability in ecology since the 1970s, but only a few recent studies have proposed better alternatives for the astrobiology field, which is more oriented to microbial life. However, none of the existing alternatives from the fields of ecology to astrobiology has demonstrated a practical approach at planetary scales.”

His theory is based on two biophysical parameters: the habitability (H), as a relative measure of the potential for life of an environment, or habitat quality, and the habitation (M), as a relative measure of biodensity, or occupancy. Within the parameters are physiological and environmental variables which can be used to make predictions about the distribution, and abundance of potential food (both plant and microbial life), environment and weather.

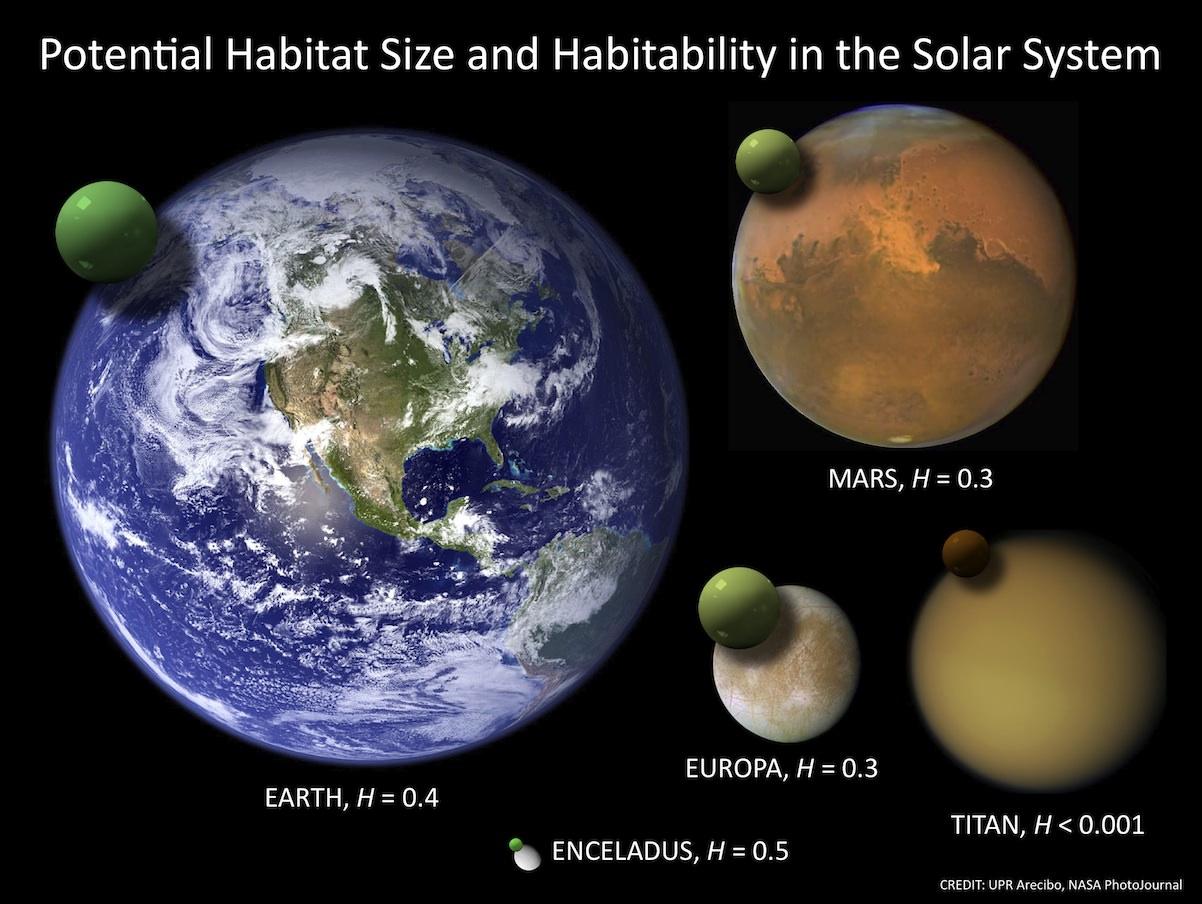
The image above shows a comparison of the potential habitable space available on Earth, Mars, Europa, Titan, and Enceladus. The green spheres represent the global volume with the right physical environment for most terrestrial microorganisms. On Earth, the biosphere includes parts of the atmosphere, oceans, and subsurface (here’s a biosphere definition). The potential global habitats of the other planetary bodies are deep below their surface.

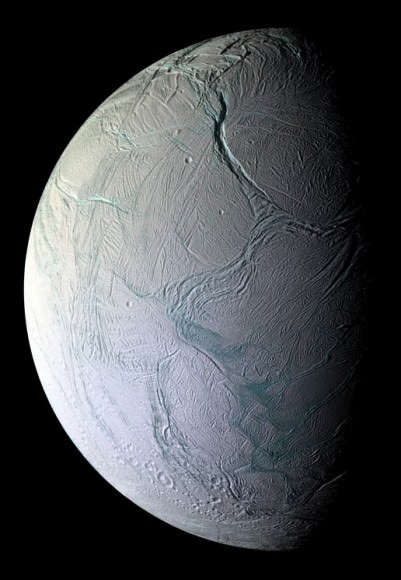
Enceladus has the smallest volume but the highest habitat-planet size ratio followed by Europa. Surprisingly, Enceladus also has the highest mean habitability in the Solar System, even though it is farther from the sun, and Earth, making it harder to get to. Mendez said Mars and Europa would be the best compromise between potential for life and accessibility.

n Oct. 5, 2008.  Image credit: NASA/JPL/Space Science Institute  Cassini came within 25 kilometers (15.6 miles) of the surface of Enceladus o
n Oct. 5, 2008. Image credit: NASA/JPL/Space Science Institute Cassini came within 25 kilometers (15.6 miles) of the surface of Enceladus o

“Various planetary models were used to calculate and compare the habitability of Mars, Venus, Europa, Titan, and Enceladus,” Mendez said. “Interestingly, Enceladus resulted as the object with the highest subsurface habitability in the solar system, but too deep for direct exploration. Mars and Europa resulted as the best compromise between habitability and accessibility. In addition, it is also possible to evaluate the global habitability of any detected terrestrial-sized extrasolar planet in the future. Further studies will expand the habitability definition to include other environmental variables such as light, carbon dioxide, oxygen, and nutrients concentrations. This will help expand the models, especially at local scales, and thus improve its application in assessing habitable zones on Earth and beyond.”

Studies about the effects of climate change on life are interesting when applied to Earth itself. “The biophysical quantity Standard Primary Habitability (SPH) was defined as a base for comparison of the global surface habitability for primary producers,” Mendez said. “The SPH is always an upper limit for the habitability of a planet but other factors can contribute to lower its value. The current SPH of our planet is close to 0.7, but it has been up to 0.9 during various paleoclimates, such as during the late Cretaceous period when the dinosaurs went extinct. I’m now working on how the SPH could change under global warming.”

The search for habitable environments in the universe is one of the priorities of the NASA Astrobiology Institute and other international organizations. Mendez’s studies also focus on the search for life in the solar system, as well as extrasolar planets.

“This work is important because it provides a quantitative measure for comparing habitability,” said NASA planetary scientists Chris McKay. “It provides an objective way to compare different climate and planetary systems.”

“I was pleased to see Enceladus come out the winner,” McKay said. “I’ve thought for some time that it was the most interesting world for astrobiology in the solar system.”

Mendez presented his results at the Division for Planetary Sciences of the American Astronomical Society meeting earlier this month.

Source: AAS DPS

Cosmic-Ray Intensity Hits 50-Year High

[/caption]

Planning a trip to Mars? Take plenty of shielding. According to sensors on NASA’s ACE (Advanced Composition Explorer) spacecraft, galactic cosmic rays have just hit a space-age high.

“In 2009, cosmic ray intensities have increased 19% beyond anything we’ve seen in the past 50 years,” says Richard Mewaldt of Caltech. “The increase is significant, and it could mean we need to re-think how much radiation shielding astronauts take with them on deep-space missions.”

The cause of the surge is solar minimum, a deep lull in solar activity that began around 2007 and continues today. Researchers have long known that cosmic rays go up when solar activity goes down. Right now solar activity is as weak as it has been in modern times, setting the stage for what Mewaldt calls “a perfect storm of cosmic rays.”

“We’re experiencing the deepest solar minimum in nearly a century,” says Dean Pesnell of the Goddard Space Flight Center, “so it is no surprise that cosmic rays are at record levels for the Space Age.”

Galactic cosmic rays come from outside the solar system. They are subatomic particles–mainly protons but also some heavy nuclei–accelerated to almost light speed by distant supernova explosions. Cosmic rays cause “air showers” of secondary particles when they hit Earth’s atmosphere.  They pose a health hazard to astronauts.  And a single cosmic ray can disable a satellite if it hits an unlucky integrated circuit.

The sun’s magnetic field is our first line of defense against these highly-charged, energetic particles. The entire solar system from Mercury to Pluto and beyond is surrounded by a bubble of solar magnetism called “the heliosphere.” It springs from the sun’s inner magnetic dynamo and is inflated to gargantuan proportions by the solar wind. When a cosmic ray tries to enter the solar system, it must fight through the heliosphere’s outer layers; and if it makes it inside, there is a thicket of magnetic fields waiting to scatter and deflect the intruder.

“At times of low solar activity, this natural shielding is weakened, and more cosmic rays are able to reach the inner solar system,” explains Pesnell.

Mewaldt lists three aspects of the current solar minimum that are combining to create the perfect storm:

(1) The sun’s magnetic field is weak. “There has been a sharp decline in the sun’s interplanetary magnetic field (IMF) down to only 4 nanoTesla (nT) from typical values of 6 to 8 nT,” he says. “This record-low IMF undoubtedly contributes to the record-high cosmic ray fluxes.”

(2) The solar wind is flagging. “Measurements by the Ulysses spacecraft show that solar wind pressure is at a 50-year low,” he continues, “so the magnetic bubble that protects the solar system is not being inflated as much as usual.” A smaller bubble gives cosmic rays a shorter-shot into the solar system. Once a cosmic ray enters the solar system, it must “swim upstream” against the solar wind. Solar wind speeds have dropped to very low levels in 2008 and 2009, making it easier than usual for a cosmic ray to proceed.

(3) The current sheet is flattening. Imagine the sun wearing a ballerina’s skirt as wide as the entire solar system with an electrical current flowing along the wavy folds. That is the “heliospheric current sheet,” a vast transition zone where the polarity of the sun’s magnetic field changes from plus (north) to minus (south). The current sheet is important because cosmic rays tend to be guided by its folds. Lately, the current sheet has been flattening itself out, allowing cosmic rays more direct access to the inner solar system.

“If the flattening continues as it has in previous solar minima, we could see cosmic ray fluxes jump all the way to 30% above previous Space Age highs,” predicts Mewaldt.

Earth is in no great peril from the extra cosmic rays. The planet’s atmosphere and magnetic field combine to form a formidable shield against space radiation, protecting humans on the surface. Indeed, we’ve weathered storms much worse than this. Hundreds of years ago, cosmic ray fluxes were at least 200% higher than they are now. Researchers know this because when cosmic rays hit the atmosphere, they produce the isotope beryllium-10, which is preserved in polar ice. By examining ice cores, it is possible to estimate cosmic ray fluxes more than a thousand years into the past. Even with the recent surge, cosmic rays today are much weaker than they have been at times in the past millennium.

“The space era has so far experienced a time of relatively low cosmic ray activity,” says Mewaldt. “We may now be returning to levels typical of past centuries.”

NASA spacecraft will continue to monitor the situation as solar minimum unfolds. Stay tuned for updates.

Titan Shaping Up to Look a Lot Like Pre-Life Earth

An artist's imagination of hydrocarbon pools, icy and rocky terrain on the surface of Saturn's largest moon Titan. Image credit: Steven Hobbs (Brisbane, Queensland, Australia)

[/caption]

It’s more than a billion kilometers (759 million miles) away, but the more astronomers learn about Titan, the more it looks like Earth.

That’s the theme of two talks happening this week at the International Astronomical Union meeting in Rio de Janeiro, Brazil. Two NASA researchers, Rosaly Lopes and Robert M. Nelson of the Jet Propulsion Laboratory in Pasadena, California, are reporting that weather and geology have very similar actions on Earth and Titan — even though Saturn’s moon is, on average, 100 degrees C (212 degrees F) colder than Antarctica (and certainly much more frigid than either California or Brazil; lucky astronomers).

The researchers are also reporting a tantalizing clue in the search for life: Titan hosts chemistry much like pre-biotic conditions on Earth.

Wind, rain, volcanoes, tectonics and other Earth-like processes all sculpt features on Titan’s complex and varied surface — except, according to additional research being presented at the meeting,  scientists think the “cryovolcanoes” on Titan eject cold slurries of water-ice and ammonia instead of scorching hot magma.

“It is really surprising how closely Titan’s surface resembles Earth’s,” Lopes said. “In fact, Titan looks more like the Earth than any other body in the Solar System, despite the huge differences in temperature and other environmental conditions.”

The joint NASA/ESA/ASI Cassini-Huygens mission has revealed details of Titan’s geologically young surface, showing few impact craters, and featuring mountain chains, dunes and even “lakes.” The RADAR instrument on the Cassini orbiter has now allowed scientists to image a third of Titan’s surface using radar beams that pierce the giant moon’s thick, smoggy atmosphere. There is still much terrain to cover, as the aptly named Titan is one of the biggest moons in the Solar System, larger than the planet Mercury and approaching Mars in size.

New Cassini mosaic showing a dried-out lake at Titan's south pole.

Titan has long fascinated astronomers as the only moon known to possess a thick atmosphere, and as the only celestial body other than Earth to have stable pools of liquid on its surface. The many lakes that pepper the northern polar latitudes, with a scattering appearing in the south as well, are thought to be filled with liquid hydrocarbons, such as methane and ethane.

On Titan, methane takes water’s place in the hydrological cycle of evaporation and precipitation (rain or snow) and can appear as a gas, a liquid and a solid. Methane rain cuts channels and forms lakes on the surface and causes erosion, helping to erase the meteorite impact craters that pockmark most other rocky worlds, such as our own Moon and the planet Mercury.

Another Cassini instrument called the Visual and Infrared Mapping Spectrometer (VIMS) had previously detected an area, called Hotei Regio, with a varying infrared signature, suggesting the temporary presence of ammonia frosts that subsequently dissipated or were covered over. Although the ammonia does not stay exposed for long, models show that it exists in Titan’s interior, indicating that a process is at work delivering ammonia to the surface. RADAR imaging has indeed found structures that resemble terrestrial volcanoes near the site of suspected ammonia deposition.

Nelson said new infrared images of the region, also presented at the IAU, “provide further evidence suggesting that cryovolcanism  has deposited ammonia onto Titan’s surface. It has not escaped our attention that ammonia, in association with methane and nitrogen, the principal species of Titan’s atmosphere, closely replicates the environment at the time that life first emerged on Earth. One exciting question is whether Titan’s chemical processes today support a prebiotic chemistry similar to that under which life evolved on Earth?”

Many Titan researchers hope to observe Titan with Cassini for long enough to follow a change in seasons. Lopes thinks that the hydrocarbons there likely evaporated because this hemisphere is experiencing summer. When the seasons change in several years and summer returns to the northern latitudes, the lakes so common there may evaporate and end up pooling in the south.

Lead image caption: Artist’s impression of hydrocarbon pools, icy and rocky terrain on the surface of Saturn’s largest moon Titan. Image credit: Steven Hobbs (Brisbane, Queensland, Australia)

Source: International Astronomical Union (IAU)

Heat-Shocked Diamonds Provide New Clue of Horse-Killing Impact

California's Channel Islands, where heat-shocked soot and diamonds are suggesting a killing comsic impact. Courtesy NOAA and UC Santa Barbara

[/caption]

Archeologists have been divided about whether an extraterrestiral impact blasted North America about 12,900 years ago, wreaking havoc on Earth’s surface and sending scores of species — including a pygmy mammoth and the horse — into oblivion.

New clues from California’s Channel Islands should put any doubt to rest, says an international team of researchers.

This transmission electron microscopy close-up shows a single lonsdaleite crystal, left, and associated diffraction pattern. Credit: University of Oregon

The 17-member team, led by University of Oregon archaeologist Douglas J. Kennett, has found what may be the smoking gun.

The team has found shock-synthesized hexagonal diamonds in 12,900-year-old sediments on the Northern Channel Islands off the southern California coast.

The tiny diamonds and diamond clusters were buried deeply below four meters (13 feet) of sediment. They date to the end of Clovis — a Paleoindian culture long thought to be North America’s first human inhabitants. The nano-sized diamonds were pulled from Arlington Canyon on the island of Santa Rosa, which had once been joined with three other Northern Channel Islands in a landmass known as Santarosae.

The diamonds were found in association with soot that forms in extremely hot fires, and they suggest associated regional wildfires, based on nearby environmental records.

Such soot and diamonds are rare in the geological record. They were found in sediment dating to massive asteroid impacts 65 million years ago in a layer widely known as the K-T Boundary. The thin layer of iridium-and-quartz-rich sediment dates to the transition of the Cretaceous and Tertiary periods, which mark the end of the Mesozoic Era and the beginning of the Cenozoic Era.

“The type of diamond we have found — Lonsdaleite — is a shock-synthesized mineral defined by its hexagonal crystalline structure. It forms under very high temperatures and pressures consistent with a cosmic impact,” Kennett said. “These diamonds have only been found thus far in meteorites and impact craters on Earth and appear to be the strongest indicator yet of a significant cosmic impact [during Clovis].”

The age of this event also matches the extinction of the pygmy mammoth on the Northern Channel Islands, as well as numerous other North American mammals, including the horse, which Europeans later reintroduced. In all, an estimated 35 mammal and 19 bird genera became extinct near the end of the Pleistocene with some of them occurring very close in time to the proposed cosmic impact, first reported in October 2007 in PNAS.

Source: University of Oregon, via Eurekalert. The results appear in a paper online ahead of print in the Proceedings of the National Academy of Sciences.

Solar Cycle Triggers La Nina, El Nino-like Climate Shifts

[/caption]

Researchers have discovered a link between the 11-year solar cycle and tropical Pacific weather patterns that resemble La Niña and El Niño events.

When it comes to influencing Earth’s climate, the Sun’s variability pales in recent decades compared to greehouse gases — but the new research shows it still plays a distinguishable part.

The total energy reaching Earth from the sun varies by only 0.1 percent across the solar cycle. Scientists have sought for decades to link these ups and downs to natural weather and climate variations and distinguish their subtle effects from the larger pattern of human-caused global warming.

Co-authors Gerald Meehl and Julie Arblaster, both affiliated with the National Center for Atmospheric Research in Boulder, Colorado, analyzed computer models of global climate and more than a century of ocean temperature records. Arblaster is also affiliated with the Australian Bureau of Meteorology.

In the new paper and a previous one with additional colleagues, the researchers have been able to show that, as the sun’s output reaches a peak, the small amount of extra sunshine over several years causes a slight increase in local atmospheric heating, especially across parts of the tropical and subtropical Pacific where Sun-blocking clouds are normally scarce.

That small amount of extra heat leads to more evaporation, producing extra water vapor. In turn, the moisture is carried by trade winds to the normally rainy areas of the western tropical Pacific, fueling heavier rains.

As this climatic loop intensifies, the trade winds strengthen. That keeps the eastern Pacific even cooler and drier than usual, producing La Niña-like conditions.

“We have fleshed out the effects of a new mechanism to understand what happens in the tropical Pacific when there is a maximum of solar activity,” Meehl said. “When the sun’s output peaks, it has far-ranging and often subtle impacts on tropical precipitation and on weather systems around much of the world.”

The result of this chain of events is similar to a La Niña event, although the cooling of about 1-2 degrees Fahrenheit is focused further east and is only about half as strong as for a typical La Niña.

True La Niña and El Nino events are associated with changes in the temperatures of surface waters of the eastern Pacific Ocean. They can affect weather patterns worldwide.

Although the Pacific pattern in the new paper is produced by the solar maximum, the authors found that its switch to an El Niño-like state is likely triggered by the same kind of processes that normally lead from La Niña to El Niño.

The transition starts when the changes of the strength of the trade winds produce slow-moving off-equatorial pulses known as Rossby waves in the upper ocean, which take about a year to travel back west across the Pacific.

The energy then reflects from the western boundary of the tropical Pacific and ricochets eastward along the equator, deepening the upper layer of water and warming the ocean surface.

As a result, the Pacific experiences an El Niño-like event about two years after solar maximum — also about half as strong as a true El Niño. The event settles down after about a year, and the system returns to a neutral state.

“El Niño and La Niña seem to have their own separate mechanisms,” Meehl said, “but the solar maximum can come along and tilt the probabilities toward a weak La Niña. If the system was heading toward a La Niña anyway,” he adds, “it would presumably be a larger one.”

The study authors say the new research may pave the way toward predictions of temperature and precipitation patterns at certain times during the approximately 11-year solar cycle.

In an email, Meehl noted that previous work by his team and other research groups has shown that “most of the warming trend in the first half of the 20th Century was due to an increasing trend of solar output, while most of the warming trend in the last half of the 20th Century and ever since has been due to ever-increasing GHG (greenhouse gas) concentrations in the atmosphere from the burning of fossil fuels.”

The new paper appears this month in the Journal of Climate, a publication of the American Meteorological Society. (Sorry, it’s not yet available online.)

Source: Eurekalert