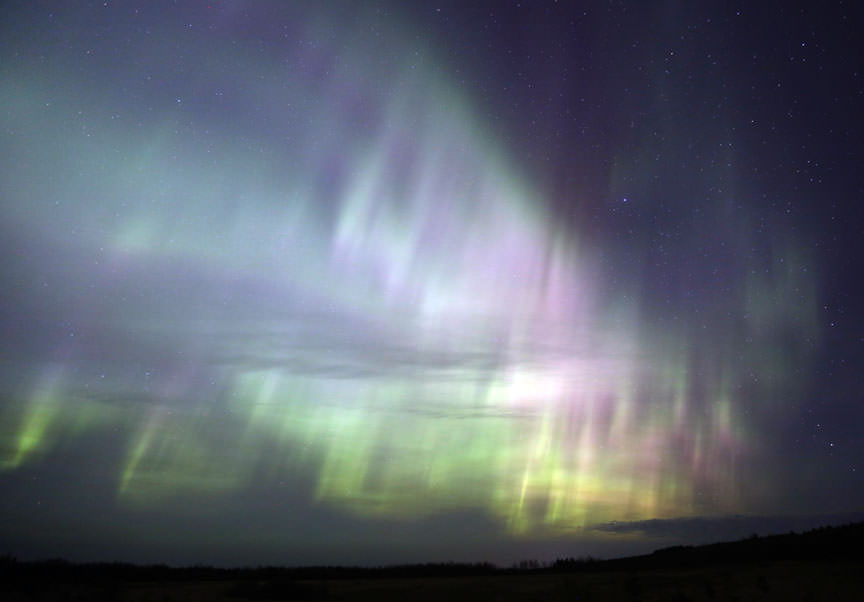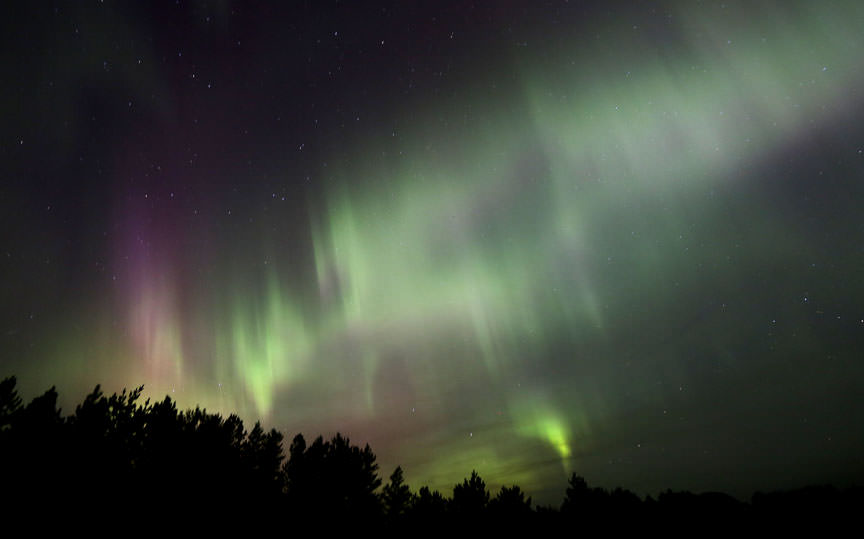
Carl Sagan’s Theory Of Early Mars Warming Gets New Attention

Credit and copyright: ESA/DLR/FU Berlin (G. Neukum)
Ah, the good old days. ESA’s Mars Express imaged Reull Vallis, a river-like structure believed to have formed when running water flowed in the distant Martian past, cuts a steep-sided channel on its way towards the floor of the Hellas basin. A thicker atmosphere that included methane and hydrogen in addition to carbon dioxide may have allowed liquid water to flow on Mars at different times in the past according to a new study. Credit and copyright: ESA/DLR/FU Berlin (G. Neukum)

Water. It’s always about the water when it comes to sizing up a planet’s potential to support life. Mars may possess some liquid water in the form of occasional salty flows down crater walls,  but most appears to be locked up in polar ice or hidden deep underground. Set a cup of the stuff out on a sunny Martian day today and depending on conditions, it could quickly freeze or simply bubble away to vapor in the planet’s ultra-thin atmosphere.

These rounded pebbles got their shapes after polished in a long-ago river in Gale Crater. They were discovered by Curiosity rover at the Hottah site. Credit: NASA/JPL-Caltech

Evidence of abundant liquid water in former flooded plains and sinuous river beds can be found nearly everywhere on Mars. NASA’s Curiosity rover has found mineral deposits that only form in liquid water and pebbles rounded by an ancient stream that once burbled across the floor of Gale Crater. And therein lies the paradox.  Water appears to have gushed willy-nilly across the Red Planet 3 to 4 billion years ago, so what’s up today?

Blame Mars’ wimpy atmosphere. Thicker, juicier air and the increase in atmospheric pressure that comes with it would keep the water in that cup stable. A thicker atmosphere would also seal in the heat, helping to keep the planet warm enough for liquid water to pool and flow.

Different ideas have been proposed to explain the putative thinning of the air including the loss of the planet’s magnetic field, which serves as a defense against the solar wind.

This figure shows a cross-section of the planet Mars revealing an inner, high density core buried deep within the interior. Magnetic field lines are drawn in blue, showing the global scale magnetic field associated with a dynamic core. Mars must have had such a field long ago, but today it’s not evident. Perhaps the energy source that powered the early dynamo shut down. Credit: NASA/JPL/GSFC

Convection currents within its molten nickel-iron core likely generated Mars’ original magnetic defenses. But sometime early in the planet’s history the currents stopped either because the core cooled or was disrupted by asteroid impacts. Without a churning core, the magnetic field withered, allowing the solar wind to strip away the atmosphere, molecule by molecule.


Solar wind eats away the Martian atmosphere

Measurements from NASA’s current MAVEN mission indicate that the solar wind strips away gas at a rate of about 100 grams (equivalent to roughly 1/4 pound) every second. “Like the theft of a few coins from a cash register every day, the loss becomes significant over time,” said Bruce Jakosky, MAVEN principal investigator.
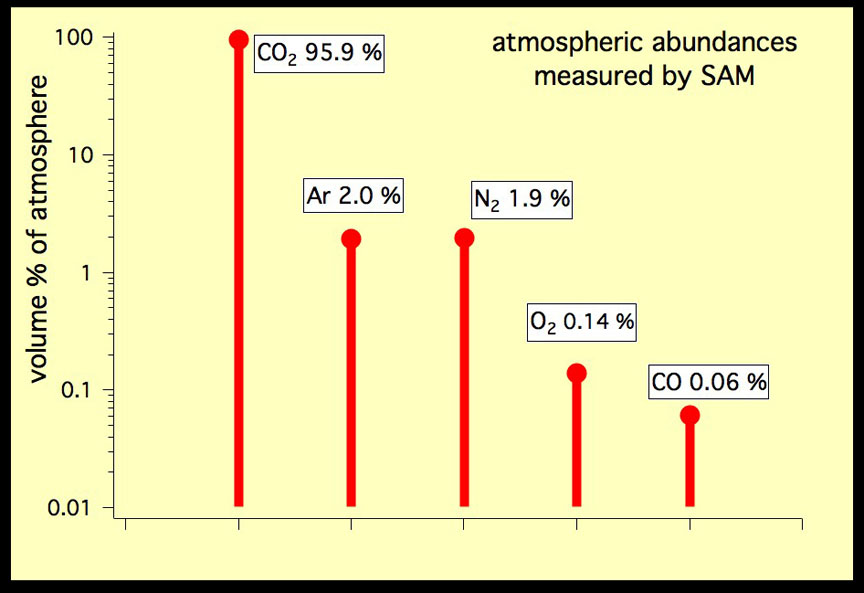
This graph shows the percent amount of the five most abundant gases in the atmosphere of Mars, as measured by the  Sample Analysis at Mars (SAM) instrument suite on the Curiosity rover in October 2012. The season was early spring in Mars’ southern hemisphere. Credit: NASA/JPL-Caltech, SAM/GSFC

Researchers from the Harvard John A. Paulson School of Engineering and Applied Sciences (SEAS) suggest a different, less cut-and-dried scenario. Based on their studies, early Mars may have been warmed now and again by a powerful greenhouse effect. In a paper published in Geophysical Research Letters, researchers found that interactions between methane, carbon dioxide and hydrogen in the early Martian atmosphere may have created warm periods when the planet could support liquid water on its surface.

The team first considered the effects of CO2, an obvious choice since it comprises 95% of Mars’ present day atmosphere and famously traps heat. But when you take into account that the Sun shone 30% fainter 4 billion years ago compared to today, CO2  alone couldn’t cut it.

“You can do climate calculations where you add CO2 and build up to hundreds of times the present day atmospheric pressure on Mars, and you still never get to temperatures that are even close to the melting point,” said Robin Wordsworth, assistant professor of environmental science and engineering at SEAS, and first author of the paper.

NASA’s Cassini spacecraft looks toward the night side of Saturn’s largest moon and sees sunlight scattering through the periphery of Titan’s atmosphere and forming a ring of color. The breakdown of methane at Titan into hydrogen and oxygen may also have occurred on Mars. The addition of hydrogen in the company of methane and carbon dioxide would have created a powerful greenhouse gas mixture, significantly warming the planet. Credit: NASA/JPL-Caltech/Space Science Institute

Carbon dioxide isn’t the only gas capable of preventing heat from escaping into space. Methane or CH4 will do the job, too. Billions of years ago, when the planet was more geologically active, volcanoes could have tapped into deep sources of methane and released bursts of the gas into the Martian atmosphere. Similar to what happens on Saturn’s moon Titan, solar ultraviolet light would snap the molecule in two, liberating hydrogen gas in the process.

When Wordsworth and his team looked at what happens when methane, hydrogen and carbon dioxide collide and then interact with sunlight, they discovered that the combination strongly absorbed heat.

Carl Sagan, American astronomer and astronomy popularizer, first speculated that hydrogen warming could have been important on early Mars back in 1977, but this is the first time scientists have been able to calculate its greenhouse effect accurately. It is also the first time that methane has been shown to be an effective greenhouse gas on early Mars.

This awesome image of the Tharsis region of Mars taken by Mars Express shows several prominent shield volcanoes including the massive Olympus Mons (at left). Volcanoes, when they were active, could have released significant amounts of methane into Mars’ atmosphere. Click for a larger version. Credit: ESA

When you take methane into consideration, Mars may have had episodes of warmth based on geological activity associated with earthquakes and volcanoes. There have been at least three volcanic epochs during the planet’s history — 3.5 billion years ago (evidenced by lunar mare-like plains), 3 billion years ago (smaller shield volcanoes) and 1 to 2 billion years ago, when giant shield volcanoes such as Olympus Mons were active. So we have three potential methane bursts that could rejigger the atmosphere to allow for a mellower Mars.

The sheer size of Olympus Mons practically shouts massive eruptions over a long period of time. During the in-between times, hydrogen, a lightweight gas, would have continued to escape into space until replenished by the next geological upheaval.

“This research shows that the warming effects of both methane and hydrogen have been underestimated by a significant amount,” said Wordsworth. “We discovered that methane and hydrogen, and their interaction with carbon dioxide, were much better at warming early Mars than had previously been believed.”

I’m tickled that Carl Sagan walked this road 40 years ago. He always held out hope for life on Mars. Several months before he died in 1996, he recorded this:

” … maybe we’re on Mars because of the magnificent science that can be done there — the gates of the wonder world are opening in our time. Maybe we’re on Mars because we have to be, because there’s a deep nomadic impulse built into us by the evolutionary process, we come after all, from hunter gatherers, and for 99.9% of our tenure on Earth we’ve been wanderers. And, the next place to wander to, is Mars. But whatever the reason you’re on Mars is, I’m glad you’re there. And I wish I was with you.”


What are the Parts of the Sun?

The interior structure of the Sun. Credit: Wikipedia Commons/kelvinsong

From here on Earth, the Sun like a smooth ball of light. And prior to Galileo’s discovery of sunposts, astronomers even thought it was a perfect orb with no imperfections. However, thanks to improved instruments and many centuries of study, we know that the Sun is much like the planets of our Solar System.

In addition to imperfections on its surface, the Sun is also made up of several layers, each of which serves its own purpose. It’s this structure of the Sun that powers this massive engine that provides the planets with all the light and heat they receive. And here on Earth, it is what provides all life forms with the energy they need to thrive and survive.

Composition:

If you could take the Sun apart, and stack up its various elements, you would find that the Sun is made of hydrogen (74%) and helium (about 24%). Astronomers consider anything heavier than helium to be a metal. The remaining amount of the Sun is made of iron, nickel, oxygen, silicon, sulfur, magnesium, carbon, neon, calcium and chromium. In fact, the Sun is 1% oxygen; and everything else comes out of that last 1%.

Where did these elements come from? The hydrogen and helium came from the Big Bang. In the early moments of the Universe, the first element, hydrogen, formed from the soup of elementary particles. The pressure and temperatures were still so intense that the entire Universe had the same conditions as the core of a star.

Hydrogen was fused into helium until the Universe cooled down enough that this reaction couldn’t happen any more. The ratios of hydrogen and helium that we see in the Universe today were created in those first few moments after the Big Bang. The other elements were created in other stars. Stars are constantly fusing hydrogen into helium in their cores.

Once the hydrogen in the core runs out, they switch to fusing heavier and heavier elements, like helium, lithium, oxygen. Most of the heavier metals we see in the Sun were formed in other stars at the end of their lives. The heaviest elements, like gold and uranium, were formed when stars many times more massive that our Sun detonated in supernova explosions.

In a fraction of a second, as a black hole was forming, elements were crushed together in the intense heat and pressure to form the heaviest elements. The explosion scattered these elements across the region, where they could contribute to the formation of new stars.

Our Sun is made up of elements left over from the Big Bang, elements formed from dying stars, and elements created in supernovae. That’s pretty amazing.

Structure:

Although the Sun is mostly just a ball of hydrogen and helium, it’s actually broken up into distinct layers. The layers of the Sun are created because the temperatures and pressures increase as you move towards the center of the Sun. The hydrogen and helium behave differently under the changing conditions.

The Core: Let’s start at the innermost layer of the Sun, the core of the Sun. This is the very center of the Sun, where temperatures and pressures are so high that fusion can happen. The Sun is combining hydrogen into helium atoms, and this reaction gives off the light and heat that we see here on Earth. The density of the core is 150 times the density of water, and the temperatures are thought to be 13,600,000 degrees Kelvin.

Astronomers believe that the core of the Sun extends from the center out to about 0.2 solar radius. And within this region, temperatures and pressures are so high that hydrogen atoms are torn apart to form separate protons, neutrons and electrons. With all of these free floating particles, the Sun is able to reform them into atoms of helium.

This reaction is exothermic. That means that the reaction gives off a tremendous amount of heat – 3.89 x 1033 ergs of energy every second. The light pressure of all this energy streaming from the core of the Sun is what stops it from collapsing inward on itself.

Radiative Zone: The radiative zone of the Sun starts at the edge of the core of the Sun (0.2 solar radii), and extends up to about 0.7 radii. Within the radiative zone, the solar material is hot and dense enough that thermal radiation transfers the heat of the core outward through the Sun.

The core of the Sun is where nuclear fusion reactions are happening – protons are merged together to create atoms of helium. This reaction produces a tremendous amount of gamma radiation. These photons of energy are emitted, absorbed, and then emitted again by various particles in the radiative zone.

The path that photons take is called the “random walk”. Instead of going in a straight beam of light, they travel in a zigzag direction, eventually reaching the surface of the Sun. In fact, it can take a single photon upwards of 200,000 years to make the journey through the radiative zone of the Sun.

As they transfer from particle to particle, the photons lose energy. That’s a good thing, since we wouldn’t want only gamma radiation streaming from the Sun. Once these photons reach space, they take a mere 8 minutes to get to Earth.

Most stars will have radiative zones, but their size depends on the star’s size. Small stars will have much smaller radiative zones, and the convective zone will take up a larger portion of the star’s interior. The smallest stars might not have a radiative zone at all, with the convective zone reaching all the way down to the core. The largest stars would have the opposite situation, where the radiative zone reaches all the way up to the surface.

Convective Zone: Outside the radiative zone is another layer, called the convective zone, where heat from inside the Sun is carried up by columns of hot gas. Most stars have a convective zone. In the case of the Sun, it starts at around 70% of the Sun’s radius and goes to the outer surface (the photosphere).

Gas deeper inside the star is heated up so that it rises, like globs of wax in a lava lamp. As it gets to the surface, the gas loses some of its heat, cools down, and sinks back towards the center to pick up more heat. Another example would be a pot of boiling water on the stove.

The surface of the Sun looks granulated. These granules are the columns of hot gas that carry heat to the surface. They can be more than 1,000 km across, and typically last about 8 to 20 minutes before dissipating. Astronomers think that low mass stars, like red dwarfs, have a convective zone that goes all the way down to the core. Unlike the Sun, they don’t have a radiative zone at all.

Photosphere: The layer of the Sun that we can see from Earth is called the photosphere. Below the photosphere, the Sun becomes opaque to visible light, and astronomers have to use other methods to probe its interior. The temperature of the photosphere is about 6,000 Kelvin, and gives off the yellow-white light that we see.

Above the photosphere is the atmosphere of the Sun. Perhaps the most dramatic of these is the corona, which is visible during a total solar eclipse.

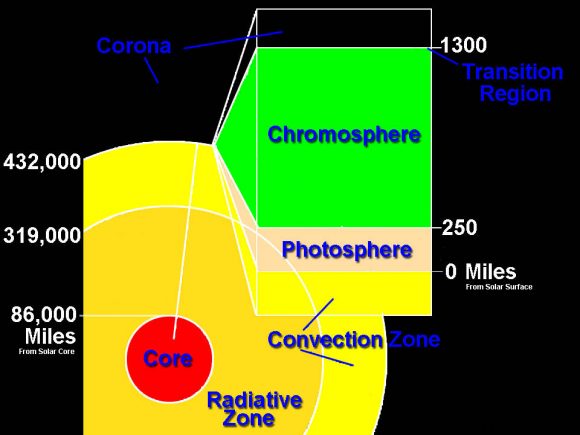
This graphic shows a model of the layers of the Sun, with approximate mileage ranges for each layer: for the inner layers, the mileage is from the sun's core; for the outer layers, the mileage is from the sun's surface. The inner layers are the Core, Radiative Zone and Convection Zone. The outer layers are the Photosphere, the Chromosphere, the Transition Region and the Corona. Credit: NASA
Graphic showing a model of the layers of the Sun, with approximate mileage ranges for each layer. Credit: NASA

Diagram:

Below is a diagram of the Sun, originally developed by NASA for educational purposes.

  • Visible, IR and UV radiation – The light that we see coming from the Sun is visible, but if you close your eyes and just feel the warmth, that’s IR, or infrared radiation. And the light that gives you a sunburn is ultraviolet (UV) radiation. The Sun produces all of these wavelengths at the same time.
  • Photosphere 6000 K – The photosphere is the surface of the Sun. This is the region where light from the interior finally reaches space. The temperature is 6000 K, which is the same as 5,700 degrees C.
  • Photosphere 6000 K – The photosphere is the surface of the Sun. This is the region where light from the interior finally reaches space. The temperature is 6000 K, which is the same as 5,700 degrees C.
  • Radio emissions – In addition to visible, IR and UV, the Sun also gives off radio emissions, which can be detected by a radio telescope. These emissions rise and fall depending on the number of sunspots on the surface of the Sun.
  • Coronal Hole – These are regions on the Sun where the corona is cooler, darker and has less dense plasma.
  • 2100000 – This is the temperature of the Sun’s radiative zone.
  • Convective zone/Turbulent convection – This is the region of the Sun where heat from the core is transferred through convection. Warm columns of plasma rise to the surface in columns, release their heat and then fall back down to heat up again.
  • Coronal loops – These are loops of plasma in the Sun’s atmosphere that follows magnetic flux lines. They look like big arches, stretching up from the surface of the Sun for hundreds of thousands of kilometers.
  • Core – The is the heart of the Sun, where the temperatures and pressures are so high that nuclear fusion reactions can happen. All of the energy coming from the Sun originates from the core.
  • 14500000 K – The temperature of the core of the Sun.
  • Radiative Zone – The region of the Sun where energy can only be transferred through radiation. It can take a single photon 200,000 years to get from the core, through the radiative zone, out to the surface and into space.
  • Neutrinos – Neutrinos are nearly mass-less particles blasted out from the Sun as part of the fusion reactions. There are millions of neutrinos passing through your body every second, but they don’t interact, so you can’t feel them.
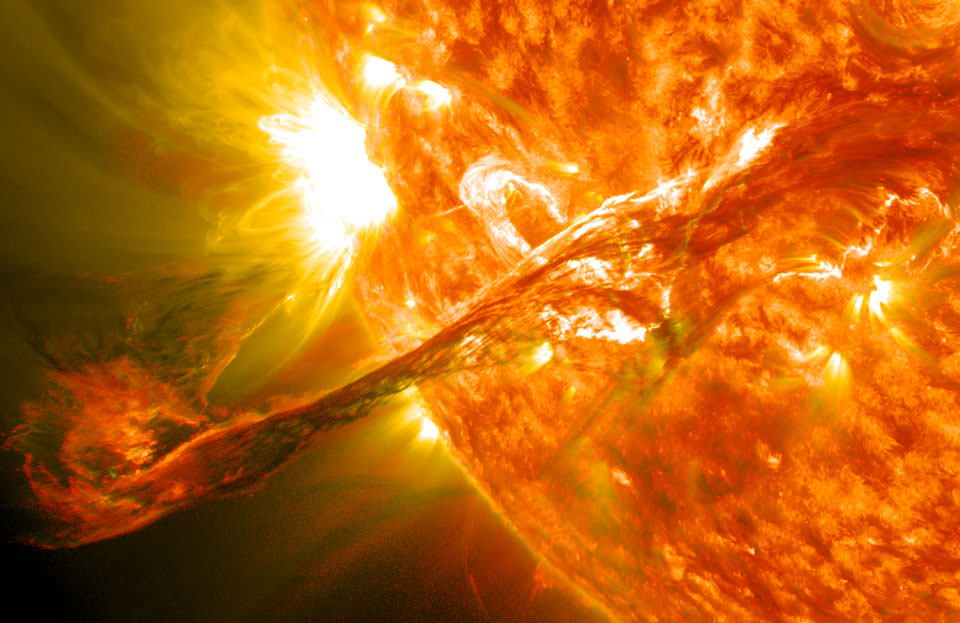
  • Chromospheric Flare – The Sun’s magnetic field can get twisted up and then snap into a different configuration. When this happens, there can be powerful X-ray flares emanating from the surface of the Sun.
  • Magnetic Field Loop – The Sun’s magnetic field extends out above its surface, and can be seen because hot plasma in the atmosphere follows the field lines.
  • Spot – A sunspot. These are areas on the Sun’s surface where the magnetic field lines pierce the surface of the Sun, and they’re relatively cooler than the surrounding areas.
  • Prominence – A bright feature that extends above the surface of the Sun, often in the shape of a loop.
  • Energetic particles – There can be energetic particles blasting off the surface of the Sun to create the solar wind. In solar storms, energetic protons can be accelerated to nearly the speed of light.
  • X-rays – In addition to the wavelengths we can see, there are invisible X-rays coming from the Sun, especially during flares. The Earth’s atmosphere protects us from this radiation.
  • Bright spots and short-lived magnetic regions – The surface of the Sun has many brighter and dimmer spots caused by changing temperature. The temperature changes from the constantly shifting magnetic field.

Yes, the Sun is like an onion. Peel back one layer and you’ll find many more. But in this case, each layers is responsible for a different function. And what they add to is a giant furnace and light source that keeps us living beings here on Earth warm and illuminated!

And be sure to enjoy this video from the NASA Goddard Center, titled “Snapshots from the Edge of the Sun”:

We have written many interesting articles about the Sun here at Universe Today. Here’s Ten Interesting Facts About the Sun, What Color is the Sun?, What is the Life Cycle of the Sun?, What Kind of Star is the Sun?, How Far is the Earth from the Sun?, and Could We Terraform the Sun?

For more information, check out NASA’s page on the Sun, and Sun Facts at Eight Planets.

Astronomy Cast also has an episode on the subject: Episode 320: The Layers of the Sun

Sources:

The Photon Sieve Could Revolutionize Optics

Scientists at NASA"s Goddard Space Flight Center are developing small, inexpensive optics to study the Sun's corona. Credit: NASA's GSFC, SDO AIA Team

Ever since astronomers first began using telescopes to get a better look at the heavens, they have struggled with a basic conundrum. In addition to magnification, telescopes also need to be able to resolve the small details of an object in order to help us get a better understanding of them. Doing this requires building larger and larger light-collecting mirrors, which requires instruments of greater size, cost and complexity.

However, scientists working at NASA Goddard’s Space Flight Center are working on an inexpensive alternative. Instead of relying on big and impractical large-aperture telescopes, they have proposed a device that could resolve tiny details while being a fraction of the size. It’s known as the photon sieve, and it is being specifically developed to study the Sun’s corona in the ultraviolet.

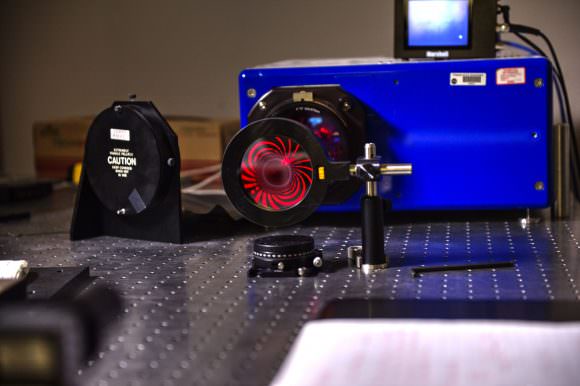
Basically, the photon sieve is a variation on the Fresnel zone plate, a form of optics that consist of tightly spaced sets of rings that alternate between the transparent and the opaque. Unlike telescopes which focus light through refraction or reflection, these plates cause light to diffract through transparent openings. On the other side, the light overlaps and is then focused onto a specific point – creating an image that can be recorded.

This image shows how the photon sieve brings red laser light to a pinpoint focus on its optical axis, but produces exotic diffraction patterns when viewed from the side. Credits: NASA/W. Hrybyk
Image showing the photon sieve bringing red laser light to a pinpoint focus on its optical axis, and producing exotic diffraction patterns. Credits: NASA/W. Hrybyk

The photon sieve operates on the same basic principles, but with a slightly more sophisticated twist. Instead of thin openings (i.e. Fresnel zones), the sieve consists of a circular silicon lens that is dotted with millions of tiny holes. Although such a device would be potentially useful at all wavelengths, the Goddard team is specifically developing the photon sieve to answer a 50-year-old question about the Sun.

Essentially, they hope to study the Sun’s corona to see what mechanism is heating it. For some time, scientists have known that the corona and other layers of the Sun’s atmosphere (the chromosphere, the transition region, and the heliosphere) are significantly hotter than its surface. Why this is has remained a mystery. But perhaps, not for much longer.

As Doug Rabin, the leader of the Goddard team, said in a NASA press release:

“This is already a success… For more than 50 years, the central unanswered question in solar coronal science has been to understand how energy transported from below is able to heat the corona. Current instruments have spatial resolutions about 100 times larger than the features that must be observed to understand this process.”

With support from Goddard’s Research and Development program, the team has already fabricated three sieves, all of which measure 7.62 cm (3 inches) in diameter. Each device contains a silicon wafer with 16 million holes, the sizes and locations of which were determined using a fabrication technique called photolithography – where light is used to transfer a geometric pattern from a photomask to a surface.

Doug Rabin, Adrian Daw, John O’Neill, Anne-Marie Novo-Gradac, and Kevin Denis are developing an unconventional optic that could give scientists the resolution they need to see finer details of the physics powering the sun’s corona. Other team members include Joe Davila, Tom Widmyer, and Greg Woytko, who are not pictured. Credits: NASA/W. Hrybyk
The Goddard team led by Doug Rabin (left) is working on a new optic device that will drastically reduce the size of telescopes. Credits: NASA/W. Hrybyk

However, in the long-run, they hope to create a sieve that will measure 1 meter (3 feet) in diameter. With an instrument of this size, they believe they will be able to achieve up to 100 times better angular resolution in the ultraviolet than NASA’s high-resolution space telescope – the Solar Dynamics Observatory. This would be just enough to start getting some answers from the Sun’s corona.

In the meantime, the team plans to begin testing to see if the sieve can operate in space, a process which should take less than a year. This will include whether or not it can survive the intense g-forces of a space launch, as well as the extreme environment of space. Other plans include marrying the technology to a series of CubeSats so a two-spacecraft formation-flying mission could be mounted to study the Sun’s corona.

In addition to shedding light on the mysteries of the Sun, a successful photon sieve could revolution optics as we know it. Rather than being forced to send massive and expensive apparatus’ into space (like the Hubble Space Telescope or the James Webb Telescope), astronomers could get all the high-resolution images they need from devices small enough to stick aboard a satellite measuring no more than a few square meters.

This would open up new venues for space research, allowing private companies and research institutions the ability to take detailed photos of distant stars, planets, and other celestial objects. It would also constitute another crucial step towards making space exploration affordable and accessible.

Further Reading: NASA

A Dark Region Is Growing Eerily On The Sun’s Surface

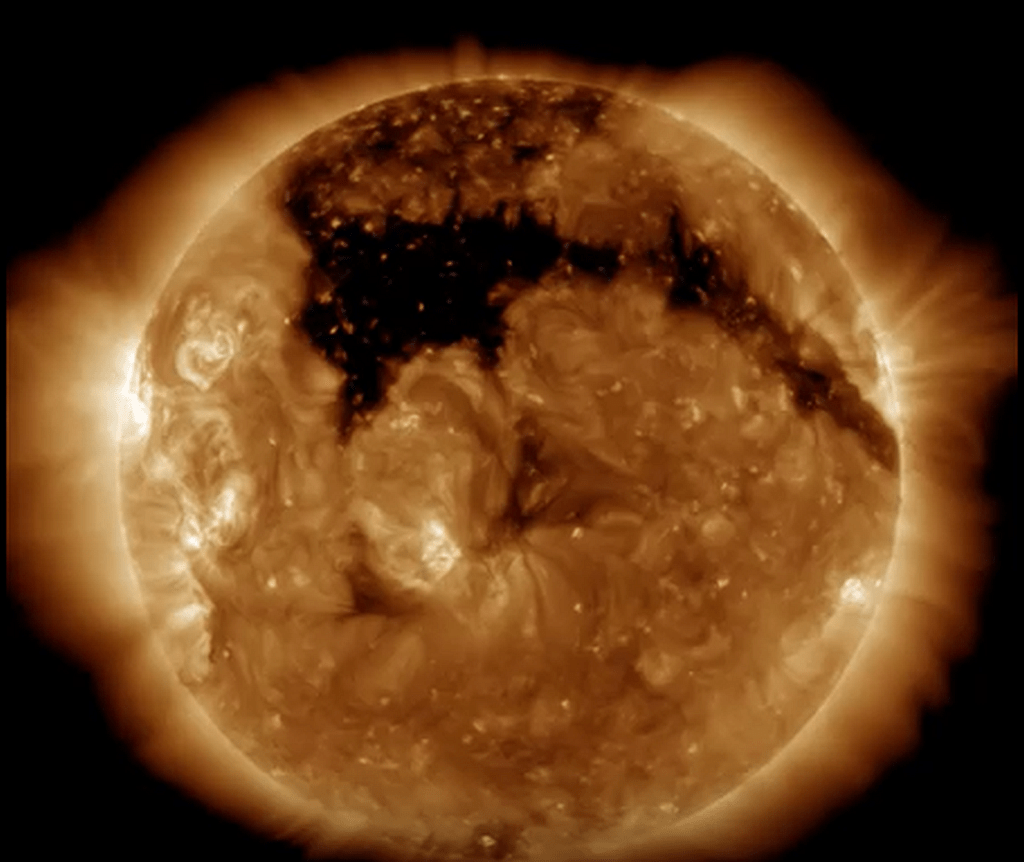
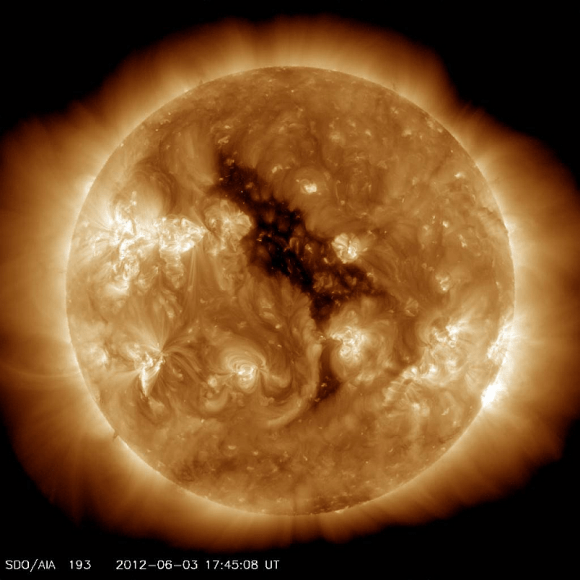
NASA's Solar Dynamics Observatory has captured images of a growing dark region on the surface of the Sun. Called a coronal hole, it produces high-speed solar winds that can disrupt satellite communications. Image: Solar Dynamics Observatory / NASA

NASA has spotted an enormous black blotch growing on the surface of the Sun. It looks eerie, but this dark region is nothing to fear, though it does signal potential disruption to satellite communications.

The dark region is called a coronal hole, an area on the surface of the Sun that is cooler and less dense than the surrounding areas. The magnetic fields in these holes are open to space, which allows high density plasma to flow out into space. The lack of plasma in these holes is what makes them appear dark. Coronal holes are the origin of high-speed solar winds, which can cause problems for satellite communications.

The images were captured by the Solar Dynamics Observatory (SDO) on July 11th. Tom Yulsman at Discover’s ImaGeo blog created a gif from several of NASA’s images.

High-speed solar winds are made up of solar particles which are travelling up to three times faster than the solar wind normally does. Though satellites are protected from the solar wind, extremes like this can still cause problems.

Coronal holes may look like a doomsday warning; an enormous black hole on the surface of our otherwise placid looking Sun is strange looking. But these holes are a part of the natural life of the Sun. And anyway, they only appear in extreme ultraviolet and x-ray wavelengths.

The holes tend to appear at the poles, due to the structure of the Sun’s magnetosphere. But when they appear in more equatorial regions of the Sun, they can cause intermittent problems, as the high-speed solar wind they generate is pointed at the Earth as the Sun rotates.

In June 2012, a coronal hole appeared that looked Big Bird from Sesame Street.

The "Big Bird" coronal hole appeared on the Sun in June 2012. It caused a powerful storm that was considered a near miss for Earth. Image: NASA/AIA
The “Big Bird” coronal hole appeared on the Sun in June 2012. It was the precursor to a powerful storm that was considered a near miss for Earth. Image: NASA/AIA

The Big Bird hole was the precursor to an extremely powerful solar storm, the most powerful one in 150 years. Daniel Baker, of the University of Colorado’s Laboratory of Atmospheric and Space Physics, said of that storm, “If it had hit, we would still be picking up the pieces.” We were fortunate that it missed us, as these enormous storms have the potential to damage power grids on the surface of the Earth.

It seems unlikely that any solar wind that reaches Earth as a result of this current coronal hole will cause any disruption to us here on Earth. But it’s not out of the question. In 1989 a solar storm struck Earth and knocked out power in the province of Quebec in Canada.

It may be that the only result of this coronal hole, and any geomagnetic storms it creates, are more vivid auroras.

Those are something everyone can appreciate and marvel at. And you don’t need an x-ray satellite to see them.

Why Does the Sun Rise in the East (and Set in the West)?

A sunrise from the edge of space. Credit: Project Soar

You may have heard the saying at some point in your life: “The Sun will still rise in the east and set in the west tomorrow.” You get the point, it means it’s not the end of the world. But have you ever wondered why the Sun behaves this way? Why does – and always has, for that matter – the Sun rise in the east and set in the west? What mechanics are behind this?

Naturally, ancient people took the passage of the Sun through the sky as a sign that it was revolving around us. With the birth of modern astronomy, we have come to learn that its actually the other way around. The Sun only appears to be revolving around us because our planet not only orbits it, but also rotates on its axis as it is doing so. From this, we get the familiar passage of the Sun through the sky, and the basis for our measurement of time.

Earth’s Rotation:

As already noted, the Earth rotates on its axis as it circles the Sun. If viewed from above the celestial north, the Earth would appear to be rotating counter-clockwise. Because of this, to those standing on the Earth’s surface, the Sun appears to be moving around us in a westerly direction at a rate of 15° an hour (or 15′ a minute). This is true of all celestial objects observed in the sky, with an “apparent motion” that takes them from east to west.


Earth's axial tilt (or obliquity) and its relation to the rotation axis and plane of orbit. Credit: Wikipedia Commons
Earth’s axial tilt (or obliquity) and its relation to the rotation axis and plane of orbit. Credit: Wikipedia Commons

This is also true of the majority of the planets in the Solar System. Venus is one exception, which rotates backwards compared to its orbit around the Sun (a phenomena known as retrograde motion). Uranus is another, which not only rotates westward, but is inclined so much that it appears to be sitting on its side relative to the Sun.

Pluto also has a retrograde motion, so for those standing on its surface, the Sun would rise in the west and set in the east. In all cases, a large impact is believed to be the cause. In essence, Pluto and Venus were sent spinning in the other direction by a large impact, while another struck Uranus and knocked it over on its side!

With a rotational velocity of 1,674.4 km/h (1,040.4 mph), the Earth takes 23 hours, 56 minutes and 4.1 seconds to rotate once on its axis. This means, in essence, that a sidereal day is less than 24 hours. But combined with its orbital period (see below), a solar day – that is, the time it takes for the Sun to return to the same place in the sky – works out to 24 hours exactly.

Earth’s Orbit Around the Sun:

With an average orbital velocity of 107,200 km/h (66,600 mph), the Earth takes approximately 365.256 days – aka. a sidereal year – to complete a single orbit of the Sun. This means that every four years (in what is known as a Leap Year), the Earth calendar must include an extra day.

Viewed from the celestial north, the motion of the Earth appears to orbit the Sun in a counterclockwise direction. Combined with its axial tilt – i.e. the Earth’s axis is tilted 23.439° towards the ecliptic – this results in seasonal changes. In addition to producing variations in terms of temperature, this also results in variations in the amount of sunlight a hemisphere receives during the course of a year.

Basically, when the North Pole is pointing towards the Sun, the northern hemisphere experiences summer and the southern hemisphere experiences winter.  During the summer, the climate warms up and the sun appears earlier in the morning sky and sets at a later hour in the evening. In the winter, the climate becomes generally cooler and the days are shorter, with sunrise coming later and sunset happening sooner.

Above the Arctic Circle, an extreme case is reached where there is no daylight at all for part of the year – up to six months at the North Pole itself, which is known as a “polar night”. In the southern hemisphere, the situation is exactly reversed, with the South Pole experiencing a “midnight sun” – i.e. a day of 24 hours.

And last, but not least, seasonal changes also result in changes in the Sun’s apparent motion across the sky. During summer in the northern hemisphere, the Sun appears to move from east to west directly overhead, while moving closer to the southern horizon during winter. During summer in the southern hemisphere, the Sun appears to move overhead; while in the winter, it appears to be closer to the northern horizon.

In short, the Sun rises in the east and sets in the west because of our planet’s rotation. During the course of the year, the amount of daylight we experience is mitigated by our planet’s tilted axis. If, like Venus, Uranus and Pluto, a large enough asteroid or celestial object were to strike us just right, the situation might be changed. We too could experience what it is like to watch the Sun rise in the west, and set in the east.

We have written many interesting articles about planet Earth here at Universe Today. Here’s Why Does the Earth Spin?, The Rotation of the Earth, How Fast Does the Earth Rotate?, and Why Are There Seasons?

Here’s an article from Cornell’s Ask an Astronomer about this very question. And here’s an article from How Stuff Works that explains the whole Solar System.

Astronomy Cast also has episodes on the subject, like Episode 30: The Sun, Spots and All, and Episode 181: Rotation.

Huge Plasma Tsunamis Hitting Earth Explains Third Van Allen Belt

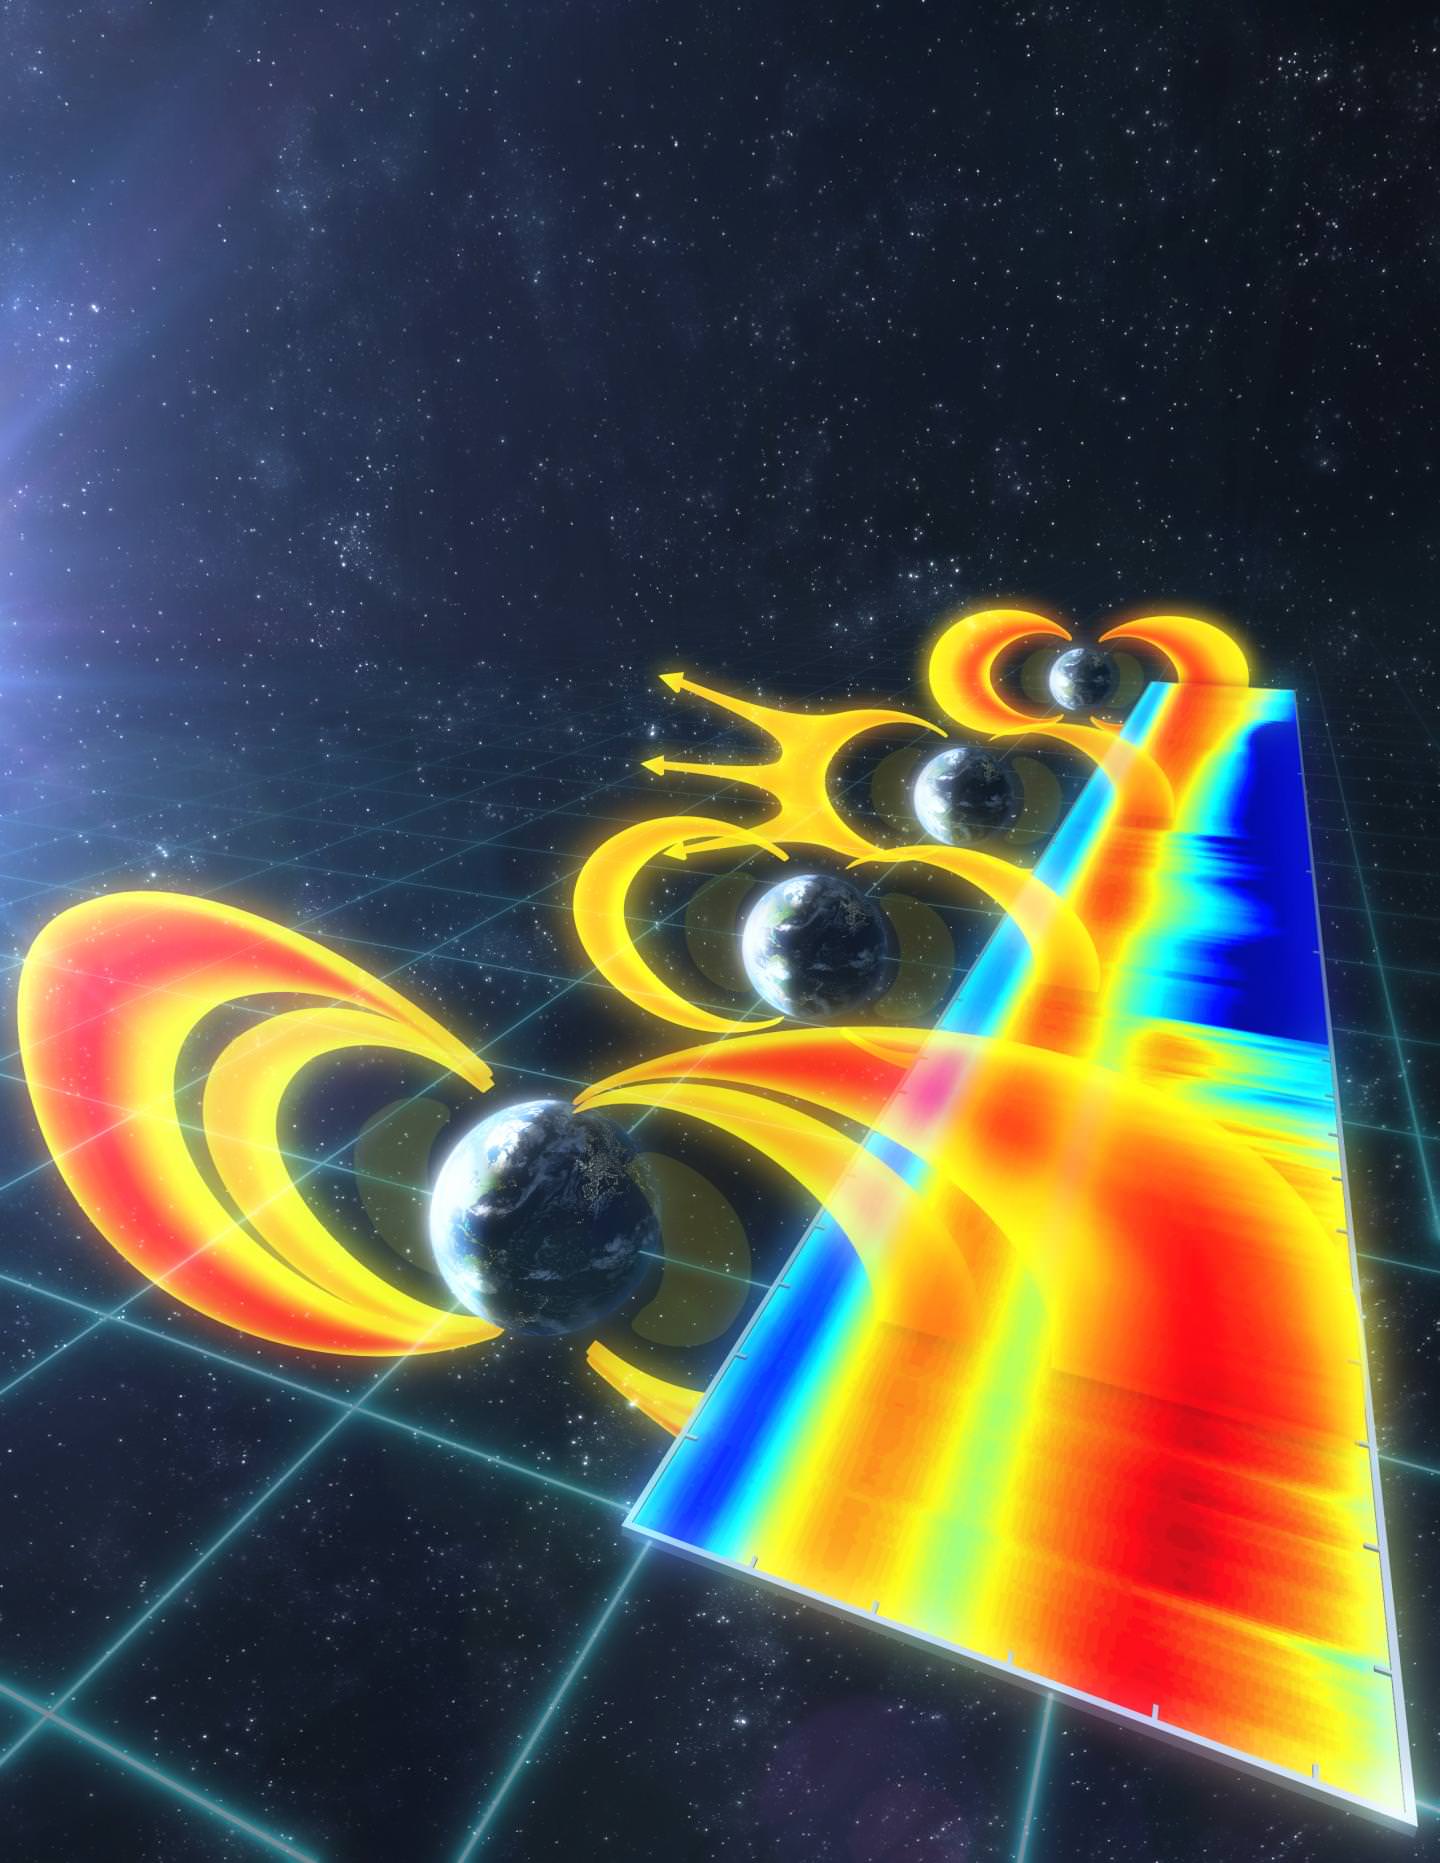
This is an illustration to explain the dynamics of the ultra-relativistic third Van Allen radiation belt. Credit: Andy Kale

The dynamic relationship between Earth and the Sun two sides. The warmth from the Sun makes life on Earth possible, but the rest of the Sun’s intense energy pummels the Earth, and could destroy all life, given the chance. But thanks to our magnetosphere, we are safe.

The magnetosphere is our protective shield. It’s created by the rotation of the molten outer core of the Earth, composed largely of iron and nickel. It absorbs and deflects plasma from the solar wind. The interactions between the magnetosphere and the solar wind are what create the beautiful auroras at Earth’s poles.

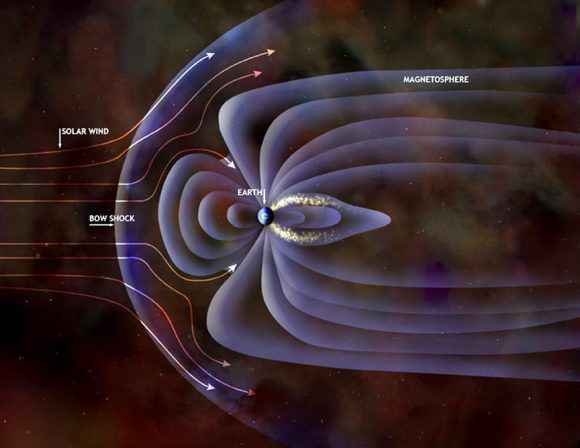
Visualization of the solar wind encountering Earth's magnetic "defenses" known as the magnetosphere. Clouds of southward-pointing plasma are able to peel back layers of the Sun-facing bubble and stack them into layers on the planet's nightside (center, right). The layers can be squeezed tightly enough to reconnect and deliver solar electrons (yellow sparkles) directly into the upper atmosphere to create the aurora. Credit: JPL
Visualization of the solar wind encountering Earth’s magnetic “defenses” known as the magnetosphere. Clouds of southward-pointing plasma are able to peel back layers of the Sun-facing bubble and stack them into layers on the planet’s nightside (center, right). The layers can be squeezed tightly enough to reconnect and deliver solar electrons (yellow sparkles) directly into the upper atmosphere to create the aurora. Credit: JPL

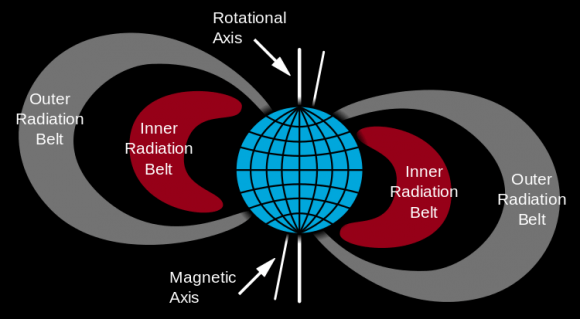
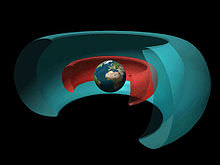
In the inner regions of Earth’s magnetosphere are the Van Allen belts, named after their discoverer James Van Allen. They consist of charged particles, mostly from the Sun, and are held in place by the magnetosphere. Usually, there are two such belts.

The Van Allen radiation belts surrounding Earth. Image: NASA

But the output from the Sun is not stable. There are periods of intense energy output from the Sun, and when that happens, a third, transient belt can be created. Up until now, the nature of this third belt has been a puzzle. New research from the University of Alberta has shown how this phenomena can happen.

Researchers have shown how a so-called “space tsunami” can create this third belt. Intense ultra-low frequency plasma waves can transport the outer part of the radiation belt into interplanetary space, and create the third, transient belt.

The lead author for this study is physics professor Ian Mann from the University of Alberta, and former Canada Research Chair in Space Physics. “Remarkably, we observed huge plasma waves,” said Mann. “Rather like a space tsunami, they slosh the radiation belts around and very rapidly wash away the outer part of the belt, explaining the structure of the enigmatic third radiation belt.”

This new research also sheds light on how these “tsunamis” help reduce the threat of radiation to satellites during other space storms. “Space radiation poses a threat to the operation of the satellite infrastructure upon which our twenty-first century technological society relies,” adds Mann. “Understanding how such radiation is energized and lost is one of the biggest challenges for space research.”

It’s not just satellites that are at risk of radiation though. When solar wind is most active, it can create extremely energetic space storms. They in turn create intense radiation in the Van Allen belts, which drive electrical currents that could damage our power grids here on Earth. These types of storms have the potential to cause trillions of dollars worth of damage.

A better understanding of this space radiation, and an ability to forecast it, are turning out to be very important to our satellite operations, and to our exploration of space.

The Van Allen belts were discovered in 1958, and classified into an inner and an outer belt.

The Van Allen Belts around Earth. The inner red belt is mostly protons, and the outer blue belt is mostly electrons. Image Credit: NASA

In 2013, probes reported a third belt which had never before been seen. It lasted a few weeks, then vanished, and its cause was not known. Thanks to Mann and his team, we now know what was behind that third belt.

“We have discovered a very elegant explanation for the dynamics of the third belt,” says Mann. “Our results show a remarkable simplicity in belt response once the dominant processes are accurately specified.”

An understanding of the radiation in and around Earth and the Van Allen belts is of growing importance to us, as we expand our presence in space. Our technological society relies increasingly on satellite communications, and on GPS satellites. Radiation in the form of high-energy electrons can wreak havoc on satellites. In fact, this type of radiation is sometimes referred to as a satellite killer. Satellites require robust design to be protected from them.

Organizations like the United Nations Committee on the Peaceful Uses of Outer Space (COPUOS) and the International Living with a Star (ILWS) Program are attempts to address the threat that radiation poses to our system of satellites.

Space Weather Causing Martian Atmospherics

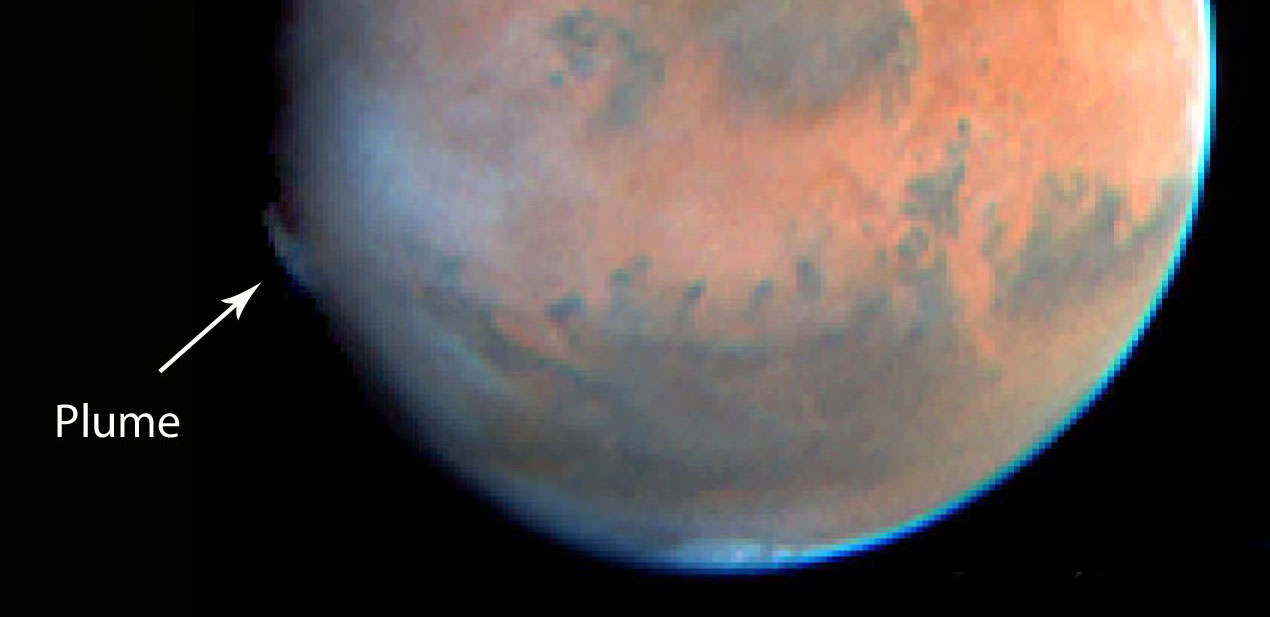
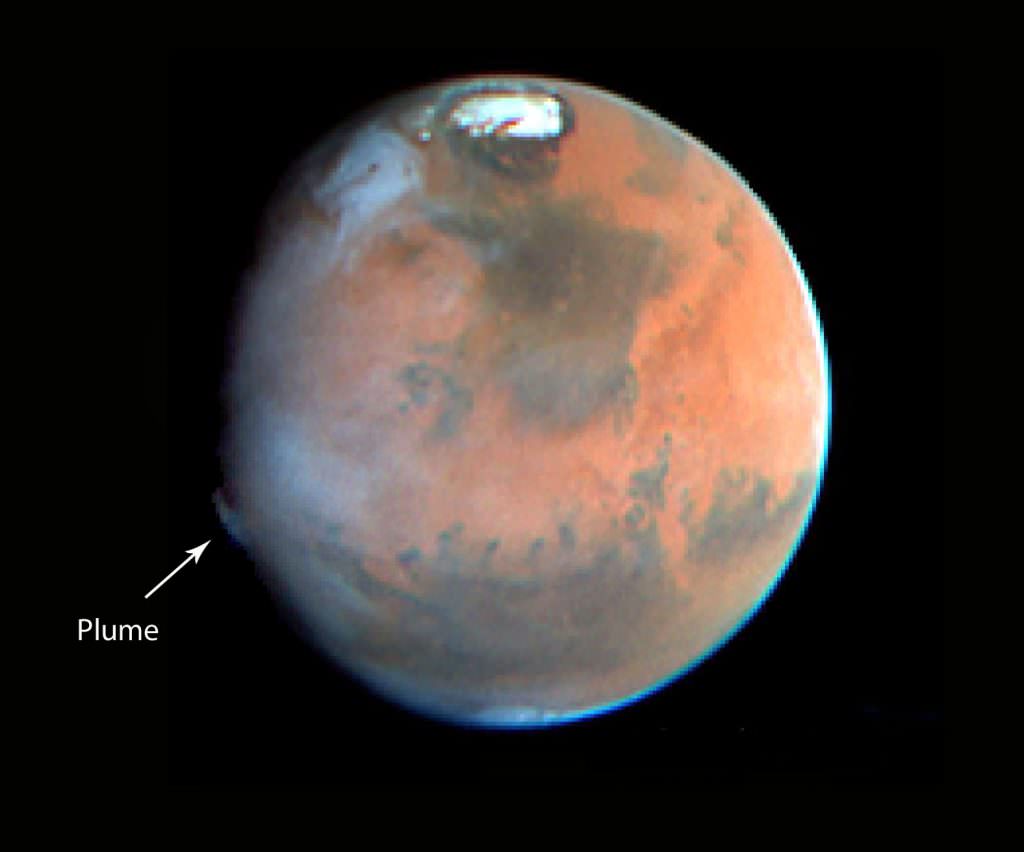
Hubble Space Telescope view of a plume high in the martian atmosphere seen in May 1997. Credit: NASA/ESA
A curious plume-like feature was observed on Mars on 17 May 1997 by the Hubble Space Telescope. It is similar to the features detected by amateur astronomers in 2012, although appeared in a different location. Credit: JPL/NASA/STScI
A curious plume-like feature was observed on Mars on May 17, 1997 by the Hubble Space Telescope. It is similar to the features detected by amateur astronomers in 2012, although appeared in a different location. Credit: JPL/NASA/STScI

Strange plumes in Mars’ atmosphere first recorded by amateur astronomers four year ago have planetary scientists still scratching their heads. But new data from European Space Agency’s orbiting Mars Express points to coronal mass ejections from the Sun as the culprit.

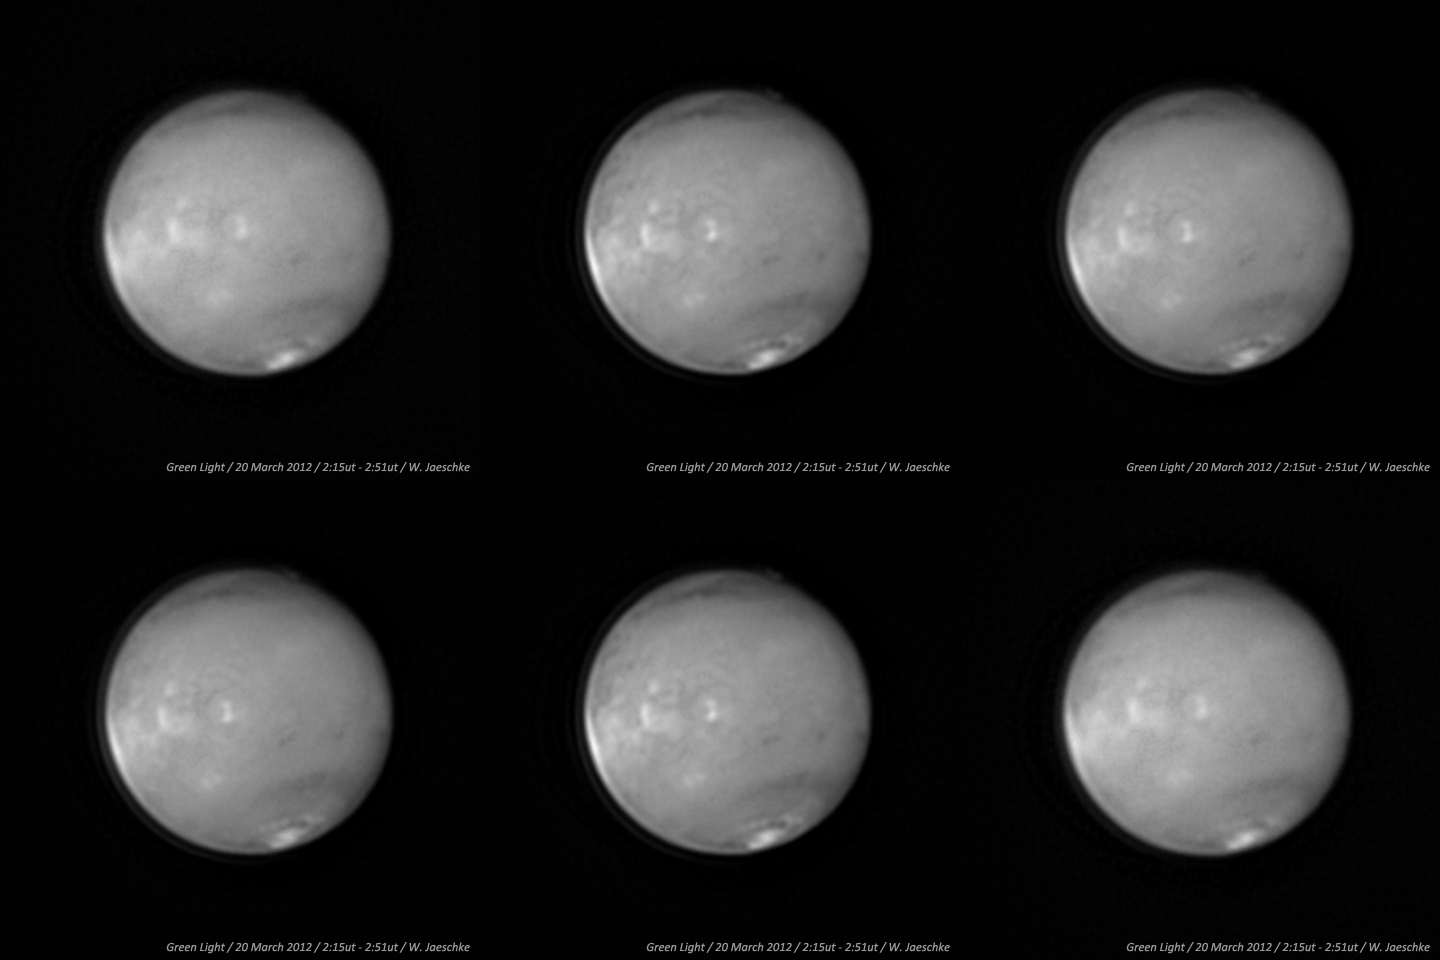
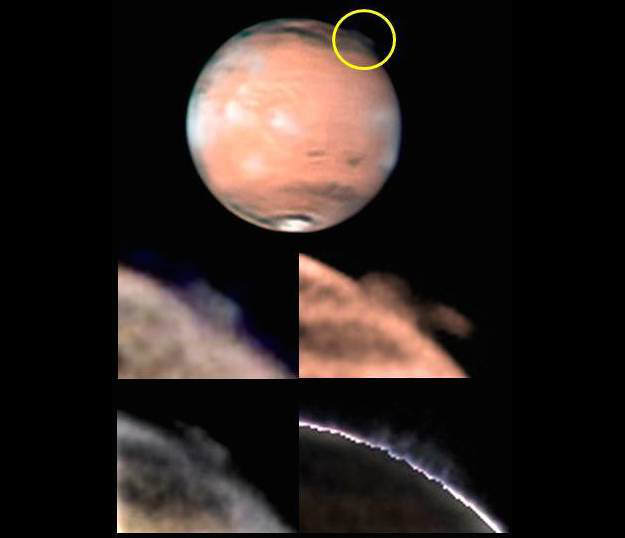
Mystery plume in Mars’ southern hemisphere photographed by amateur astronomer Wayne Jaeschke on March 20, 2012. The feature extended between 310-620 miles and lasted for about 10 days.
Mystery plume in Mars’ southern hemisphere photographed and animated by amateur astronomer Wayne Jaeschke on March 20, 2012. The feature lasted for about 10 days. Credit: Wayne Jaeschke

On two occasions in 2012 amateurs photographed cloud-like features rising to altitudes of over 155 miles (250 km) above the same region of Mars. By comparison, similar features seen in the past haven’t exceeded 62 miles (100 km). On March 20th of that year, the cloud developed in less than 10 hours, covered an area of up to 620 x 310 miles (1000 x 500 kilometers), and remained visible for around 10 days.

Back then astronomers hypothesized that ice crystals or even dust whirled high into the Martian atmosphere by seasonal winds might be the cause. However, the extreme altitude is far higher than where typical clouds of frozen carbon dioxide and water are thought to be able to form.

Indeed at those altitudes, we’ve entered Mars’ ionosphere, a rarified region where what air there is has been ionized by solar radiation. At Earth, charged particles from the Sun follow the planet’s global magnetic lines of force into the upper atmosphere to spark the aurora borealis. Might the strange features observed be Martian auroras linked to regions on the surface with stronger-than-usual magnetic fields?

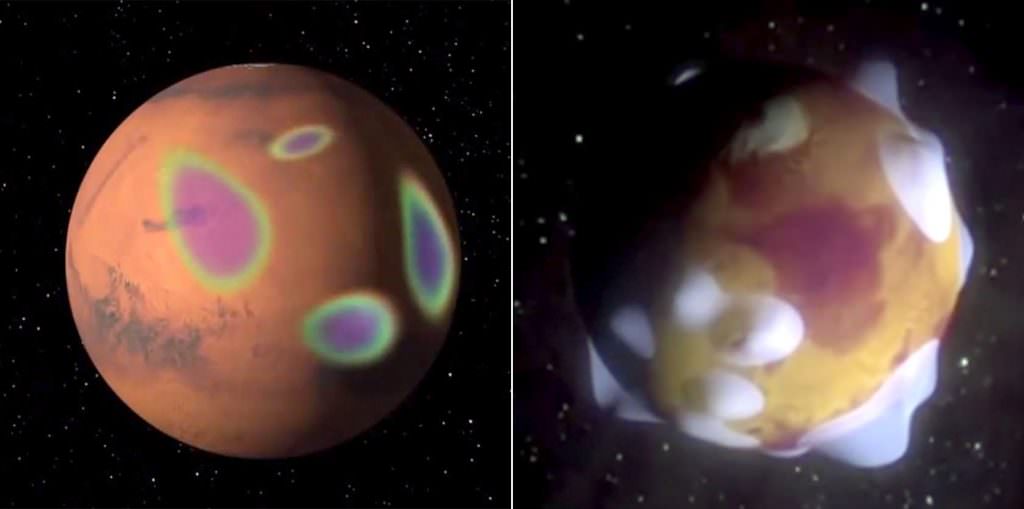
Mars has magnetized rocks in its crust that create localized, patchy magnetic fields (left). In the illustration at right, we see how those fields extend into space above the rocks. At their tops, auroras can form. Credit: NASA

Once upon a very long time ago, Mars may have had a global magnetic field generated by electrical currents in a liquid iron-nickel core much like the Earth’s does today. In the current era, the Red Planet has only residual fields centered over regions of magnetic rocks in its crust.

Copyright: W. Jaeschke and D. Parker The top image shows the location of the mysterious plume on Mars, identified within the yellow circle (top image, south is up), along with different views of the changing plume morphology taken by W. Jaeschke and D. Parker on 21 March 21 2012.
The top image shows the location of the mysterious plume on Mars, identified within the yellow circle (top image, south is up), along with different views of the changing plume morphology on March 21, 2012. Copyright: W. Jaeschke and D. Parker

Instead of a single, planet-wide field that funnels particles from the Sun into the atmosphere to generate auroras, Mars is peppered with pockets of magnetism, each potentially capable of connecting with the wind of particles from the Sun to spark a modest display of the “northern lights.” Auroras were first discovered on Mars in 2004 by the Mars Express orbiter, but they’re faint compared to the plumes, which were too bright to be considered auroras.

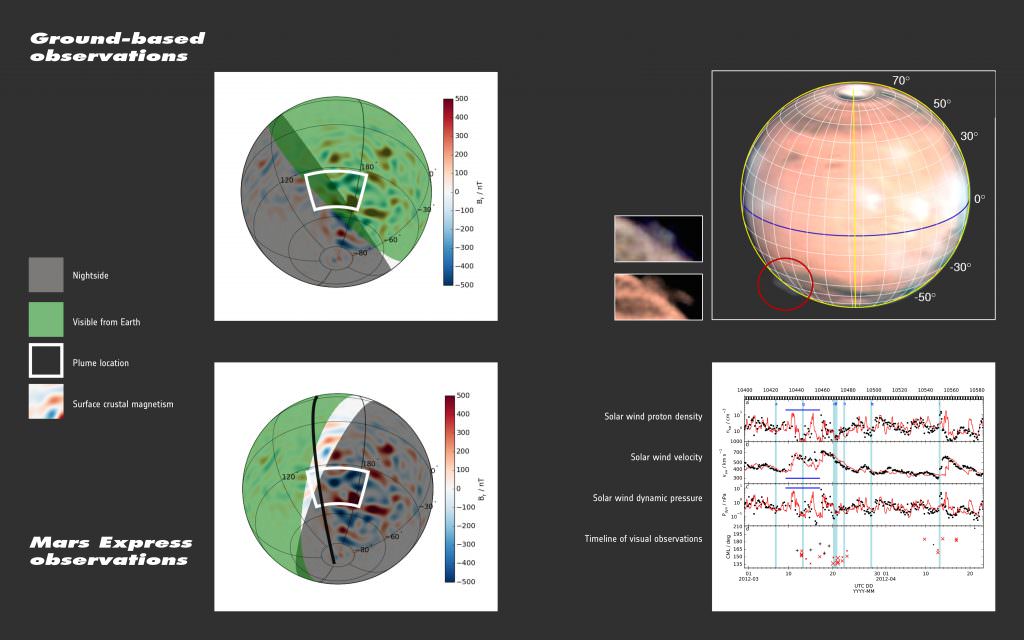
Still, this was a step in the right direction. What was needed was some hard data of a possible Sun-Earth interaction which scientists ultimately found when they looked into plasma and solar wind measurements collected by Mars Express at the time. David Andrews of the Swedish Institute of Space Physics, lead author of a recent paper reporting the Mars Express results, found evidence for a large coronal mass ejection or CME from the Sun striking the martian atmosphere in the right place and at around the right time.

Examples of Earth-based observations of the mysterious plume seen on 21 March 2012 (top right) and of Mars Express solar wind observations during March and April 2012 (bottom right).
Earth-based observations of the plume on March 21, 2012 (top right) and of Mars Express solar wind observations during March and April 2012 (bottom right). The left-hand graphics show Mars as seen by Mars Express. Green represents the planet’s dayside and gray, the nightside. Magnetic areas of the crust are shown in blue and red. The white box indicates the area in which the plume observations were made. Together, these graphics show that the amateur observations were made during the martian daytime, along the dawn terminator, while the spacecraft observations were made along the dusk terminator, approximately half a martian ‘day’ later.The black line on Mars is the ground track of the Mars Express orbiter. The plot on the lower right shows Mars Express’s solar wind measurements. The peaks marked by the horizontal blue line indicate the increase in the solar wind properties as a result of the impact of the coronal mass ejection. Credit: Copyright: visual images: D. Parker (large Mars image and bottom inset) & W. Jaeschke (top inset). All other graphics courtesy D. Andrews

CMEs are enormous explosions of hot solar plasma — a soup of electrons and protons — entwined with magnetic fields that blast off the Sun and can touch off geomagnetic storms and auroras when they encounter the Earth and other planets.

“Our plasma observations tell us that there was a space weather event large enough to impact Mars and increase the escape of plasma from the planet’s atmosphere,” said Andrews. Indeed, the plume was seen along the day–night boundary, over a region of known strong crustal magnetic fields.

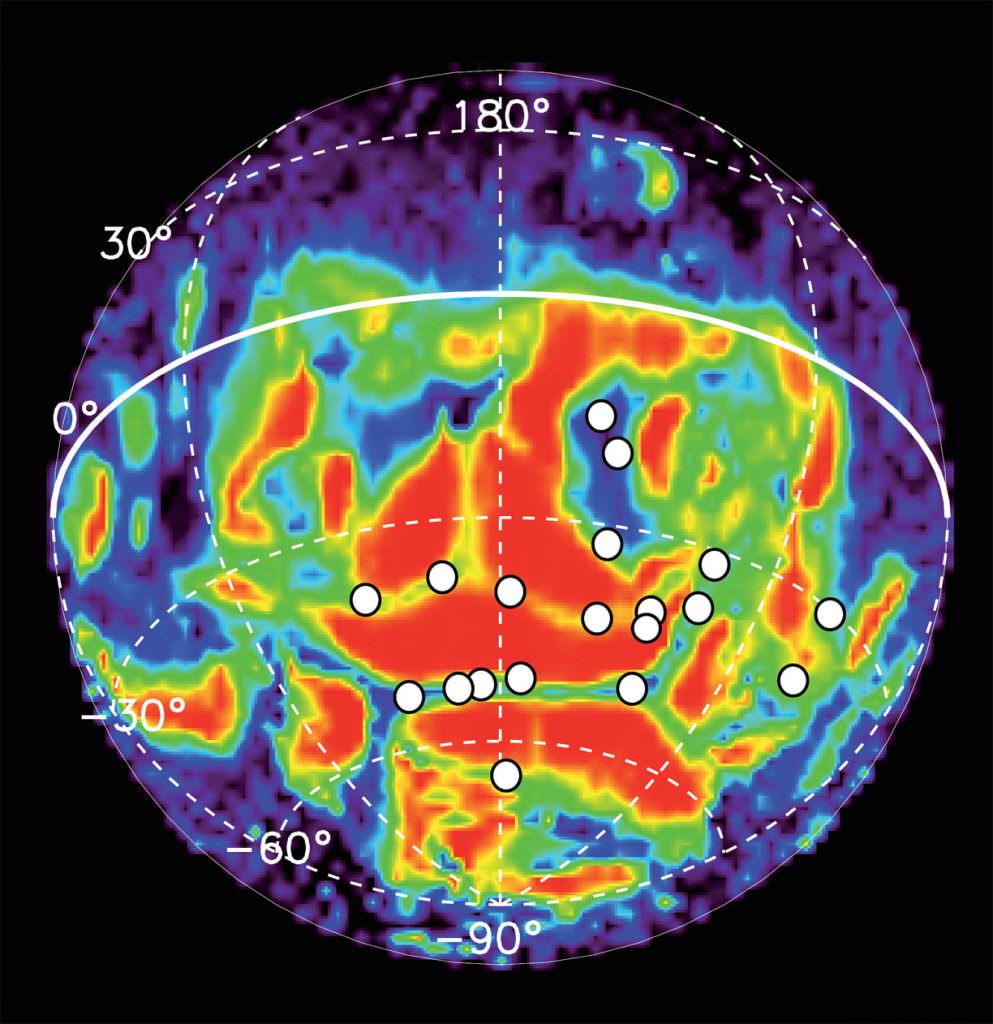
Locations of 19 auroral detections (white circles) made by the SPICAM instrument on Mars Express during 113 nightside orbits between 2004 and 2014, over locations already known to be associated with residual crustal magnetism. The data is superimposed on the magnetic field line structure (from NASA’s Mars Global Surveyor) where red indicates closed magnetic field lines, grading through yellow, green and blue to open field lines in purple. The auroral emissions are very short-lived, they are not seen to repeat in the same locations, and only occur near the boundary between open and closed magnetic field lines. Credit: ESA / Copyright Based on data from J-C. Gérard et al (2015)
Locations of 19 auroral detections (white circles) made by Mars Express during 113 nightside orbits between 2004 and 2014, over locations already known to be associated with residual crustal magnetism. The data is superimposed on the magnetic field line structure (from NASA’s Mars Global Surveyor) where red indicates closed magnetic field lines, grading through yellow, green and blue to open field lines in purple. The auroral emissions are very short-lived, they are not seen to repeat in the same locations. Credit: ESA / Copyright Based on data from J-C. Gérard et al (2015)

But again, a Mars aurora wouldn’t be expected to shine so brightly. That’s why Andrews thinks that the CME prompted a disturbance in the ionosphere large enough to affect dust and ice grains below:

“One idea is that a fast-traveling CME causes a significant perturbation in the ionosphere resulting in dust and ice grains residing at high altitudes in the upper atmosphere being pushed around by the ionospheric plasma and magnetic fields, and then lofted to even higher altitudes by electrical charging,” according to Andrews.

A colossal CME departs the Sun in February 2000. erupting filament lifted off the active solar surface and blasted this enormous bubble of magnetic plasma into space. Credit NASA/ESA/SOHO
A colossal CME, composed of a magnetized cloud of subatomic particles, departs the Sun in February 2000. Credit NASA/ESA/SOHO

With enough dust and ice twinkling high above the planet’s surface, it might be possible for observers on Earth to see the result as a wispy plume of light. Plumes appear to be rare on Mars as a search through the archives has revealed. The only other, seen by the Hubble Space Telescope in May 1997, occurred when a CME was hitting the Earth at the same time. Unfortunately, there’s no information from Mars orbiters at the time about its effect on that planet.

Observers on Earth and orbiters zipping around the Red Planet continue to monitor Mars for recurrences. Scientists also plan to use the webcam on Mars Express for more frequent coverage. Like a dog with a bone, once scientists get a bite on a tasty mystery, they won’t be letting go anytime soon.

Friendly Giants Have Cozy Habitable Zones Too

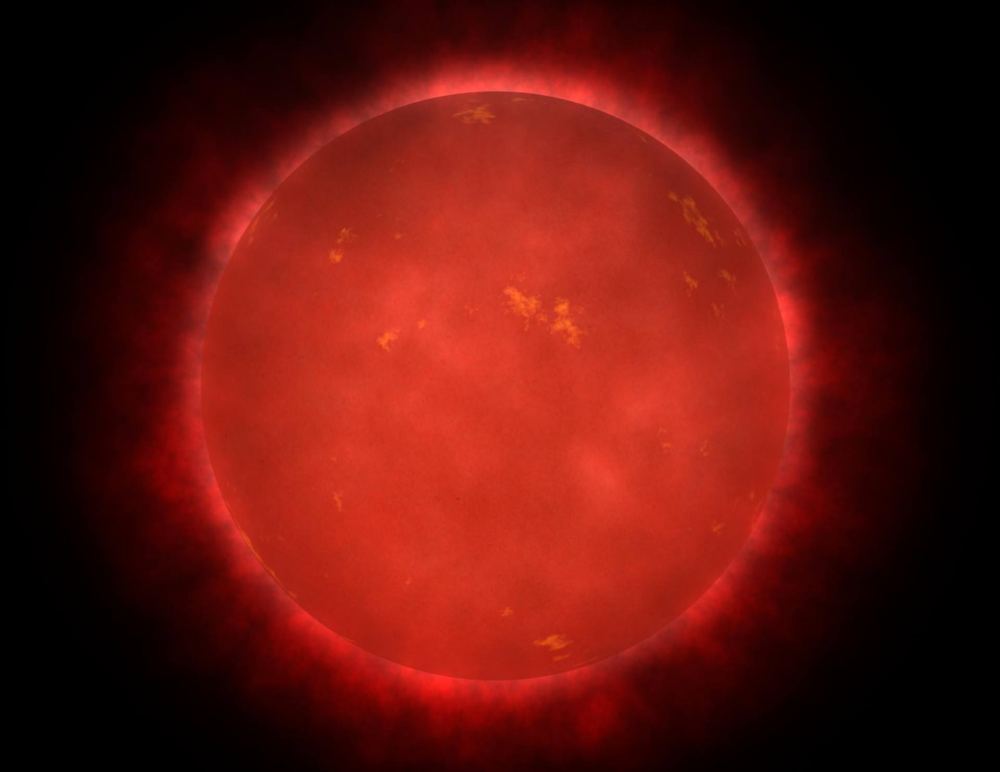
Artist's impression of a red giant star. If the star is in a binary pair, what happens to its sibling? Credit:NASA/ Walt Feimer

It is an well-known fact that all stars have a lifespan. This begins with their formation, then continues through their Main Sequence phase (which constitutes the majority of their life) before ending in death. In most cases, stars will swell up to several hundred times their normal size as they exit the Main Sequence phase of their life, during which time they will likely consume any planets that orbit closely to them.

However, for planets that orbit the star at greater distances (beyond the system’s “Frost Line“, essentially), conditions might actually become warm enough for them to support life. And according to new research which comes from the Carl Sagan Institute at Cornell University, this situation could last for some star systems into the billions of years, giving rise to entirely new forms of extra-terrestrial life!

In approximately 5.4 billion years from now, our Sun will exit its Main Sequence phase. Having exhausted the hydrogen fuel in its core, the inert helium ash that has built up there will become unstable and collapse under its own weight. This will cause the core to heat up and get denser, which in turn will cause the Sun to grow in size and enter what is known as the Red Giant-Branch (RGB) phase of its evolution.

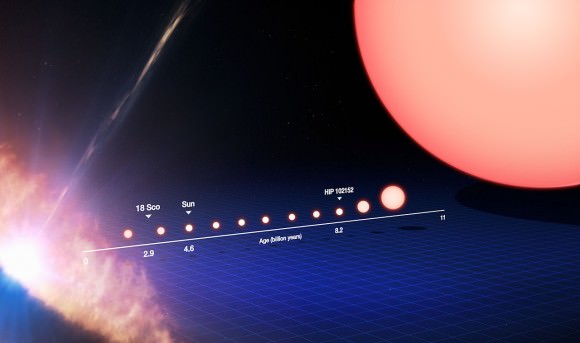
The life cycle of a Sun-like star, from its birth on the left side of the frame to its evolution into a red giant on the right after billions of years. Credit: ESO/M. Kornmesser

This period will begin with our Sun becoming a subgiant, in which it will slowly double in size over the course of about half a billion years. It will then spend the next half a billion years expanding more rapidly, until it is 200 times its current size and several thousands times more luminous. It will then officially be a red giant star, eventually expanding to the point where it reaches beyond Mars’ orbit.

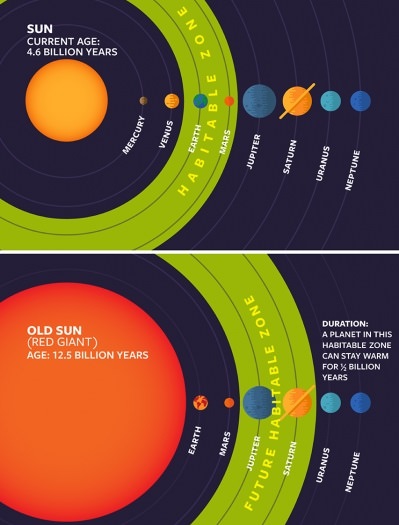
As we explored in a previous article, planet Earth will not survive our Sun becoming a Red Giant – nor will Mercury, Venus or Mars. But beyond the “Frost Line”, where it is cold enough that volatile compounds – such as water, ammonia, methane, carbon dioxide and carbon monoxide – remain in a frozen state, the remain gas giants, ice giants, and dwarf planets will survive. Not only that, but a massive thaw will set in.

In short, when the star expands, its “habitable zone” will likely do the same, encompassing the orbits of Jupiter and Saturn. When this happens, formerly uninhabitable places – like the Jovian and Cronian moons – could suddenly become inhabitable. The same holds true for many other stars in the Universe, all of which are fated to become Red Giants as they near the end of their lifespans.

However, when our Sun reaches its Red Giant Branch phase, it is only expected to have 120 million years of active life left. This is not quite enough time for new lifeforms to emerge, evolve and become truly complex (i.e. like humans and other species of mammals). But according to a recent research study that appeared in The Astrophysical Journal – titled “Habitable Zone of Post-Main Sequence Stars” – some planets may be able to remain habitable around other red giant stars in our Universe for much longer – up to 9 billion years or more in some cases!

Ramses Ramirez, left, and Lisa Kaltenegger hold a replica of our own habitable world, as they hunt for other places in the universe where life can thrive. Credit: Chris Kitchen/University Photo
Ramses Ramirez (left) and Lisa Kaltenegger are on the hunt for other places in the universe where life can thrive. Credit: Chris Kitchen/University Photo

To put that in perspective, nine billion years is close to twice the current age of Earth. So assuming that the worlds in question also have the right mix of elements, they will have ample time to give rise to new and complex forms of life. The study’s co-author, Professor Lisa Kaltennegeris, is also the director of the Carl Sagan Institute. As such, she is no stranger to searching for life in other parts of the Universe. As she explained to Universe Today via email:

“We found that planets – depending on how big their Sun is (the smaller the star, the longer the planet can stay habitable) – can stay nice and warm for up to 9 Billion years. That makes an old star an interesting place to look for life. It could have started sub-surface (e.g. in a frozen ocean) and then when the ice melts, the gases that life breaths in and out can escape into the atmosphere – what allows astronomers to pick them up as signatures of life. Or for the smallest stars, the time a formerly frozen planet can be nice and warm is up to 9 billion years. Thus life could potentially even get started in that time.”

Using existing models of stars and their evolution – i.e. one-dimensional radiative-convective climate and stellar evolutionary models – for their study, Kaltenegger and Ramirez were able to calculate the distances of the habitable zones (HZ) around a series of post-Main Sequence (post-MS) stars. Ramses M. Ramirez – a research associate at the Carl Sagan Institute and the lead author of the paper – explained the research process to Universe Today via email:

“We used stellar evolutionary models that tell us how stellar quantities, mainly the brightness, radius, and temperature all change with time as the star ages through the red giant phase. We also used a  climate model to then compute how much energy each star is outputting at the boundaries of the habitable zone. Knowing this and the stellar brightness mentioned above, we can compute the distances to these habitable zone boundaries.”

After several billions years, yellow suns (like ours) become Red Giants, expanding to several hundred times their normal size. Credit: Wendy Kenigsburg

At the same time, they considered how this kind of stellar evolution could effect the atmosphere of the star’s planets. As a star expands, it loses mass and ejects it outward in the form of solar wind. For planets that orbit close to a star, or those that have low surface gravity, they may find some or all of their atmospheres blasted away. On the other hand, planets with sufficient mass (or positioned at a safe distance) could maintain most of their atmospheres.

“The stellar winds from this mass loss erodes planetary atmospheres, which we also compute as a function of time,” said Ramirez. “As the star loses mass, the solar system conserves angular momentum by moving outwards. So, we also take into account how the orbits move out with time.” By using models that incorporated the rate of stellar and atmospheric loss during the Red Giant Branch (RGB) and Asymptotic Giant Branch (AGB) phases of star, they were able to determine how this would play out for planets that ranged in size from super-Moons to super-Earths.

What they found was that a planet can stay in a post-HS HZ for eons or more, depending on how hot the star is, and figuring for metallicities that are similar to our Sun’s. As Ramirez explained:

“The main result is that the maximum time that a planet can remain in this red giant habitable zone of hot stars is 200 million years. For our coolest star (M1), the maximum time a planet can stay within this red giant habitable zone is 9 billion years. Those results assume metallicity levels similar to those of our Sun. A star with a higher percentage of metals takes longer to fuse the non-metals (H, He..etc) and so these maximum times can increase some more, up to about a factor of two.”

Europa's cracked, icy surface imaged by NASA's Galileo spacecraft in 1998. Credit: NASA/JPL-Caltech/SETI Institute.
Could Europa’s cracked, icy surface thaw and give rise to a new habitable world when our Sun becomes a Red Giant in a few billion years? Credit: NASA/JPL-Caltech/SETI Institute

Within the context of our Solar System, this could mean that in a few billion years, worlds like Europa and Enceladus (which are already suspected of having life beneath their icy surfaces) might get a shot at becoming full-fledged habitable worlds. As Ramirez summarized beautifully:

“This means that the post-main-sequence is another potentially interesting phase of stellar evolution from a habitability standpoint. Long after the inner system of planets have been turned into sizzling wastelands by the expanding, growing red giant star, there could be potentially habitable abodes farther away from the chaos. If they are frozen worlds, like Europa, the ice would melt, potentially unveiling any preexisting life. Such pre-existing life may be detectable by future missions/telescopes looking for atmospheric biosignatures.”

But perhaps the most exciting take-away from their research study was their conclusion that planets orbiting within their star’s post-MS habitable zones would be doing so at distances that would make them detectable using direct imaging techniques. So not only are the odds of finding life around older stars better than previously thought, we should have no trouble in spotting them using current exoplanet-hunting techniques!

It is also worth noting that Kaltenegger and Dr. Ramirez have submitted a second paper for publication, in which they provide a list of 23 red giant stars within 100 light-years of Earth. Knowing that these stars, all of which are in our stellar neighborhood, could have life-sustaining worlds within their habitable zones should provide additional opportunities for planet hunters in the coming years.

And be sure to check out this video from Cornellcast, where Prof. Kaltenegger shares what inspires her scientific curiosity and how Cornell’s scientists are working to find proof of extra-terrestrial life.

Further Reading: The Astrophysical Journal

Watch Mercury Transit the Sun in Multiple Wavelengths

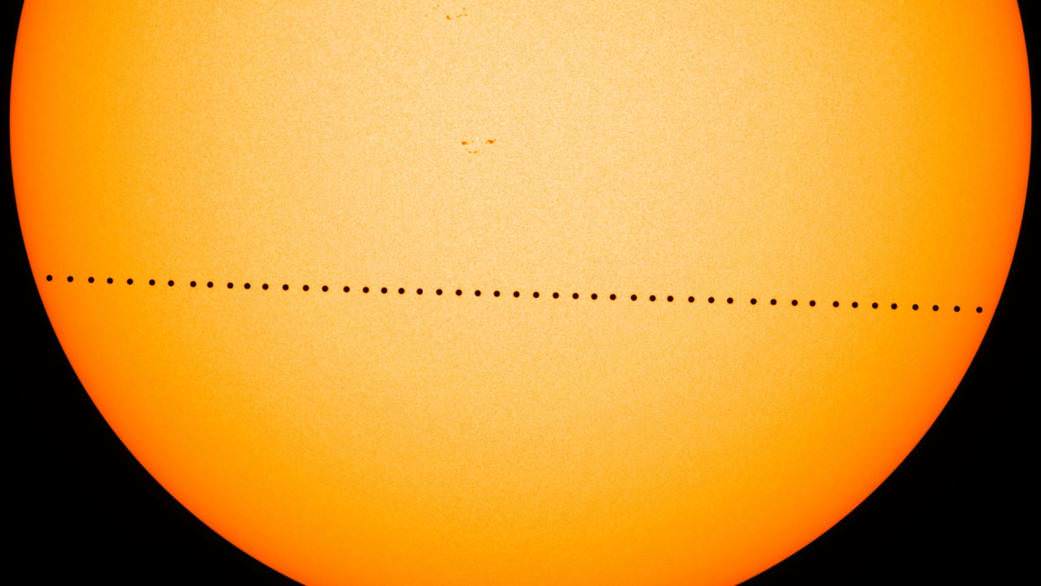
A composite image of the May 9, 2016 transit of Mercury across the face of the Sun, as seen by the Solar Dynamics Observatory. Credit: NASA's Goddard Space Flight Center/SDO/Genna Duberstein

On May 9, 2016, Mercury passed directly between the Sun and Earth. No one had a better view of the event than the space-based Solar Dynamics Observatory, as it had a completely unobstructed view of the entire seven-and-a-half-hour event! This composite image, above, of Mercury’s journey across the Sun was created with visible-light images from the Helioseismic and Magnetic Imager on SDO, and below is a wonderful video of the transit, as it includes views in several different wavelenths (and also some great soaring music sure to stir your soul).

Mercury transits of the Sun happen about 13 times each century, however the next one will occur in only about three and a half years, on November 11, 2019. But then it’s a long dry spell, as the following one won’t occur until November 13, 2032.

Make sure you check out the great gallery of Mercury transit images from around the world compiled by our David Dickinson.

Give Mom the Aurora Tonight / Mercury Transit Update

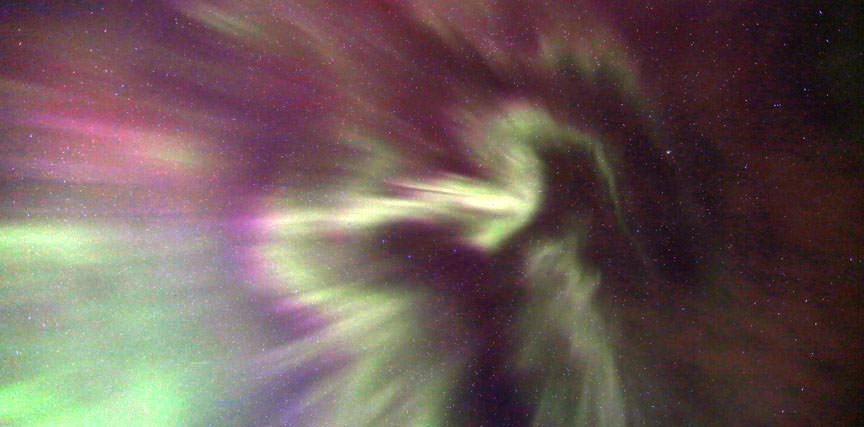
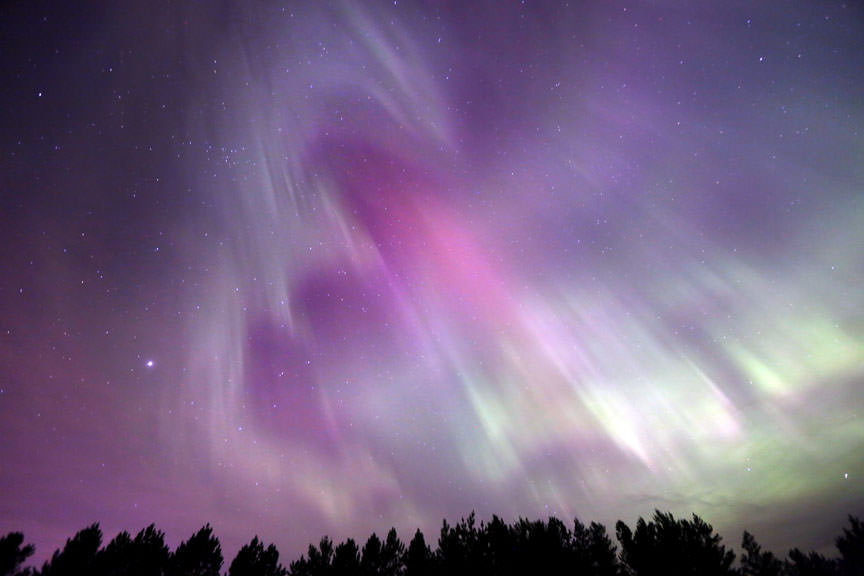
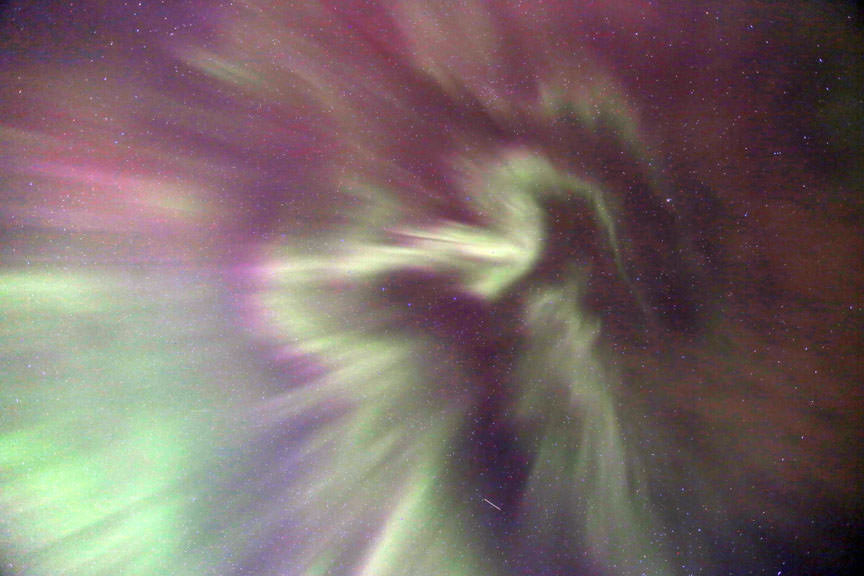
A coronal aurora twists overhead in this photo taken early on May 8, 2016 from near Duluth, Minnesota. Credit: Bob King
Skywatchers across the northern tier of states, the Midwest and southern Canada were treated to a spectacular display of the aurora borealis last night. More may be on tap for tonight. Credit: Bob King
Skywatchers across the northern tier of states, the Midwest and southern Canada were treated to a spectacular display of the aurora borealis last night. More may be on tap for tonight — in honor of Mother’s Day of course! Credit: Bob King

Simple choices can sometimes lead to dramatic turns of events in our lives. Before turning in for the night last night, I opened the front door for one last look at the night sky. A brighter-than-normal auroral arc arched over the northern horizon. Although no geomagnetic activity had been forecast, there was something about that arc that hinted of possibility.

It was 11:30 at the time, and it would have been easy to go to bed, but I figured one quick drive north for a better look couldn’t hurt. Ten minutes later the sky exploded. The arc subdivided into individual pillars of light that stretched by degrees until they reached the zenith and beyond. Rhythmic ripples of light – much like the regular beat of waves on a beach — pulsed upward through the display. You can’t see a chill going up your spine, but if you could, this is what it would look like.

A coronal aurora twists overhead in this photo taken early on May 8 from near Duluth, Minn. Credit: Bob King
A coronal aurora twists overhead in this photo taken around 12:15 a.m. on May 8 from near Duluth, Minn. What this photo and the others don’t show is how fast parts of the display flashed and flickered. Shapes would form, disappear and reform in seconds. Credit: Bob King

Auroras can be caused by huge eruptions of subatomic particles from the Sun’s corona called CMEs or coronal mass ejections, but they can also be sparked by holes in the solar magnetic canopy. Coronal holes show up as blank regions in photos of the Sun taken in far ultraviolet and X-ray light. Bright magnetic loops restrain the constant leakage of electrons and protons from the Sun called the solar wind. But holes allow these particles to fly away into space at high speed. Last night’s aurora traces its origin back to one of these holes.

Visualization of the solar wind encountering Earth's magnetic "defenses" known as the magnetosphere. Clouds of southward-pointing plasma are able to peel back layers of the Sun-facing bubble and stack them into layers on the planet's nightside (center, right). The layers can be squeezed tightly enough to reconnect and deliver solar electrons (yellow sparkles) directly into the upper atmosphere to create the aurora. Credit: JPL
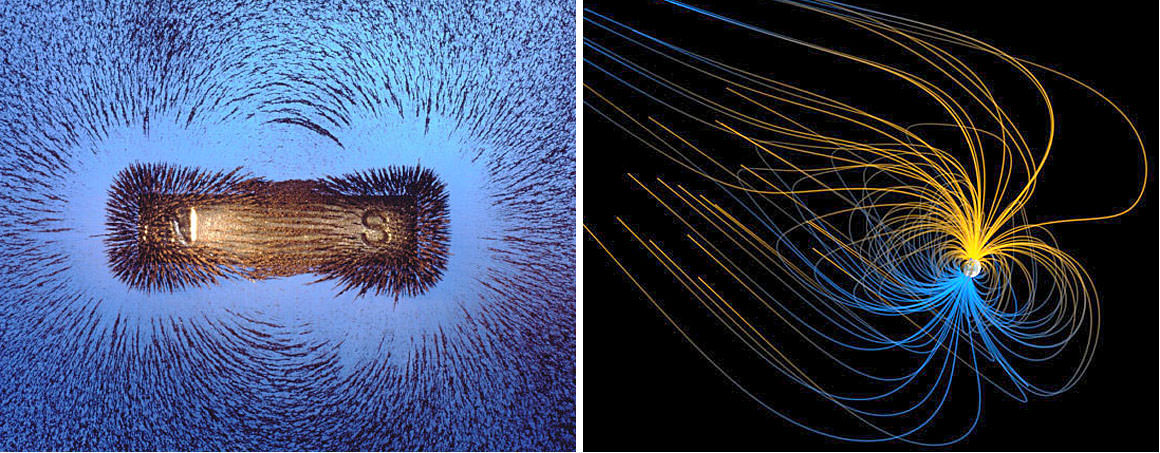
Both a bar magnet (left) and Earth are surrounded by magnetic fields with north and south poles. Earth’s field is shaped by charged particles – electrons and protons – flowing from the sun called the solar wind. Credit: Andy Washnik (left) and NASA

The subatomic particles in the gusty wind come bundled with their own magnetic field with a plus or positive pole and a minus or negative pole. Recall that an ordinary bar magnet also  has a “+” and “-” pole, and that like poles repel and opposite poles attract. Earth likewise has magnetic poles which anchor a large bubble of magnetism around the planet called the magnetosphere.

Visualization of the solar wind encountering Earth's magnetic "defenses" known as the magnetosphere. Clouds of southward-pointing plasma are able to peel back layers of the Sun-facing bubble and stack them into layers on the planet's nightside (center, right). The layers can be squeezed tightly enough to reconnect and deliver solar electrons (yellow sparkles) directly into the upper atmosphere to create the aurora. Credit: JPL
Visualization of the solar wind encountering Earth’s magnetic “defenses” known as the magnetosphere. Clouds of southward-pointing plasma are able to peel back layers of the Sun-facing bubble and stack them into layers on the planet’s nightside (center, right). The layers can be squeezed tightly enough to reconnect and deliver solar electrons (yellow sparkles) directly into the upper atmosphere to create the aurora. Credit: JPL

Field lines in the magnetosphere — those invisible lines of magnetic force around every magnet — point toward the north pole. When the field lines in the solar wind also point north, there’s little interaction between the two, almost like two magnets repelling one another. But if the cloud’s lines of magnetic force point south, they can link directly into Earth’s magnetic field like two magnets snapping together. Particles, primarily electrons, stream willy-nilly at high speed down Earth’s magnetic field lines like a zillion firefighters zipping down fire poles.  They crash directly into molecules and atoms of oxygen and nitrogen around 60-100 miles overhead, which absorb the energy and then release it moments later in bursts of green and red light.

View of the eastern sky during the peak of this morning's aurora. Credit: Bob King
View of the eastern sky during the peak of this morning’s aurora. Credit: Bob King

So do great forces act on the tiniest of things to produce a vibrant display of northern lights. Last night’s show began at nightfall and lasted into dawn. Good news! The latest forecast calls for another round of aurora tonight from about 7 p.m. to 1 a.m. CDT (0-6 hours UT). Only minor G1 storming (K index =5) is expected, but that was last night’s expectation, too. Like the weather, the aurora can be tricky to pin down. Instead of a G1, we got a G3 or strong storm. No one’s complaining.

So if you’re looking for that perfect last minute Mother’s Day gift, take your mom to a place with a good view of the northern sky and start looking at the end of dusk for activity. Displays often begin with a low, “quiet” arc and amp up from there.

The camera recorded pale purple and red but the primary color visible to the eye was green. Credit: Bob Kin
The camera recorded pale purple, red and green, but the primary color visible to the eye was green. Cameras capture far more color than what the naked eye sees because even faint colors increase in intensity during a time exposure. Details: ISO 800, f/2.8, 13 seconds. Credit: Bob King

Aurora or not, tomorrow features a big event many of us have anticipated for years — the transit of Mercury. You’ll find everything you’ll need to know in this earlier story, but to recap, Mercury will cross directly in front of the Sun during the late morning-early evening for European observers and from around sunrise (or before) through late morning-early afternoon for skywatchers in the Americas. Because the planet is tiny and the Sun deadly bright, you’ll need a small telescope capped with a safe solar filter to watch the event. Remember, never look directly at the Sun at any time.

Nov. 15, 1999 transit of Mercury photographed in UV light by the TRACE satellite. Credit: NASA

If you’re greeted with cloudy skies or live where the transit can’t be seen, be sure to check out astronomer Gianluca Masi’s live stream of the event. He’ll hook you up starting at 11:00 UT (6 a.m. CDT) tomorrow.

The table below includes the times across the major time zones in the continental U.S. for Monday May 9:

Time Zone Eastern (EDT) Central (CDT) Mountain (MDT) Pacific (PDT)
Transit start 7:12 a.m. 6:12 a.m. 5:12 a.m. Not visible
Mid-transit 10:57 a.m. 9:57 a.m. 8:57 a.m. 7:57 a.m.
Transit end 2:42 p.m. 1:42 p.m. 12:42 p.m. 11:42 a.m.