A Branching “Tree” of Solar Plasma

Hydrogen-alpha photo of the Sun by Alan Friedman

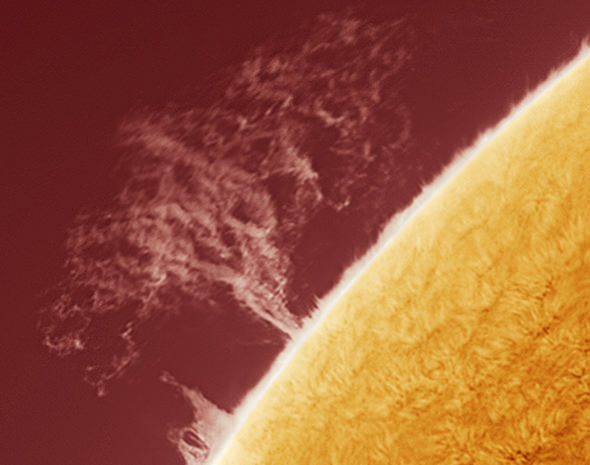
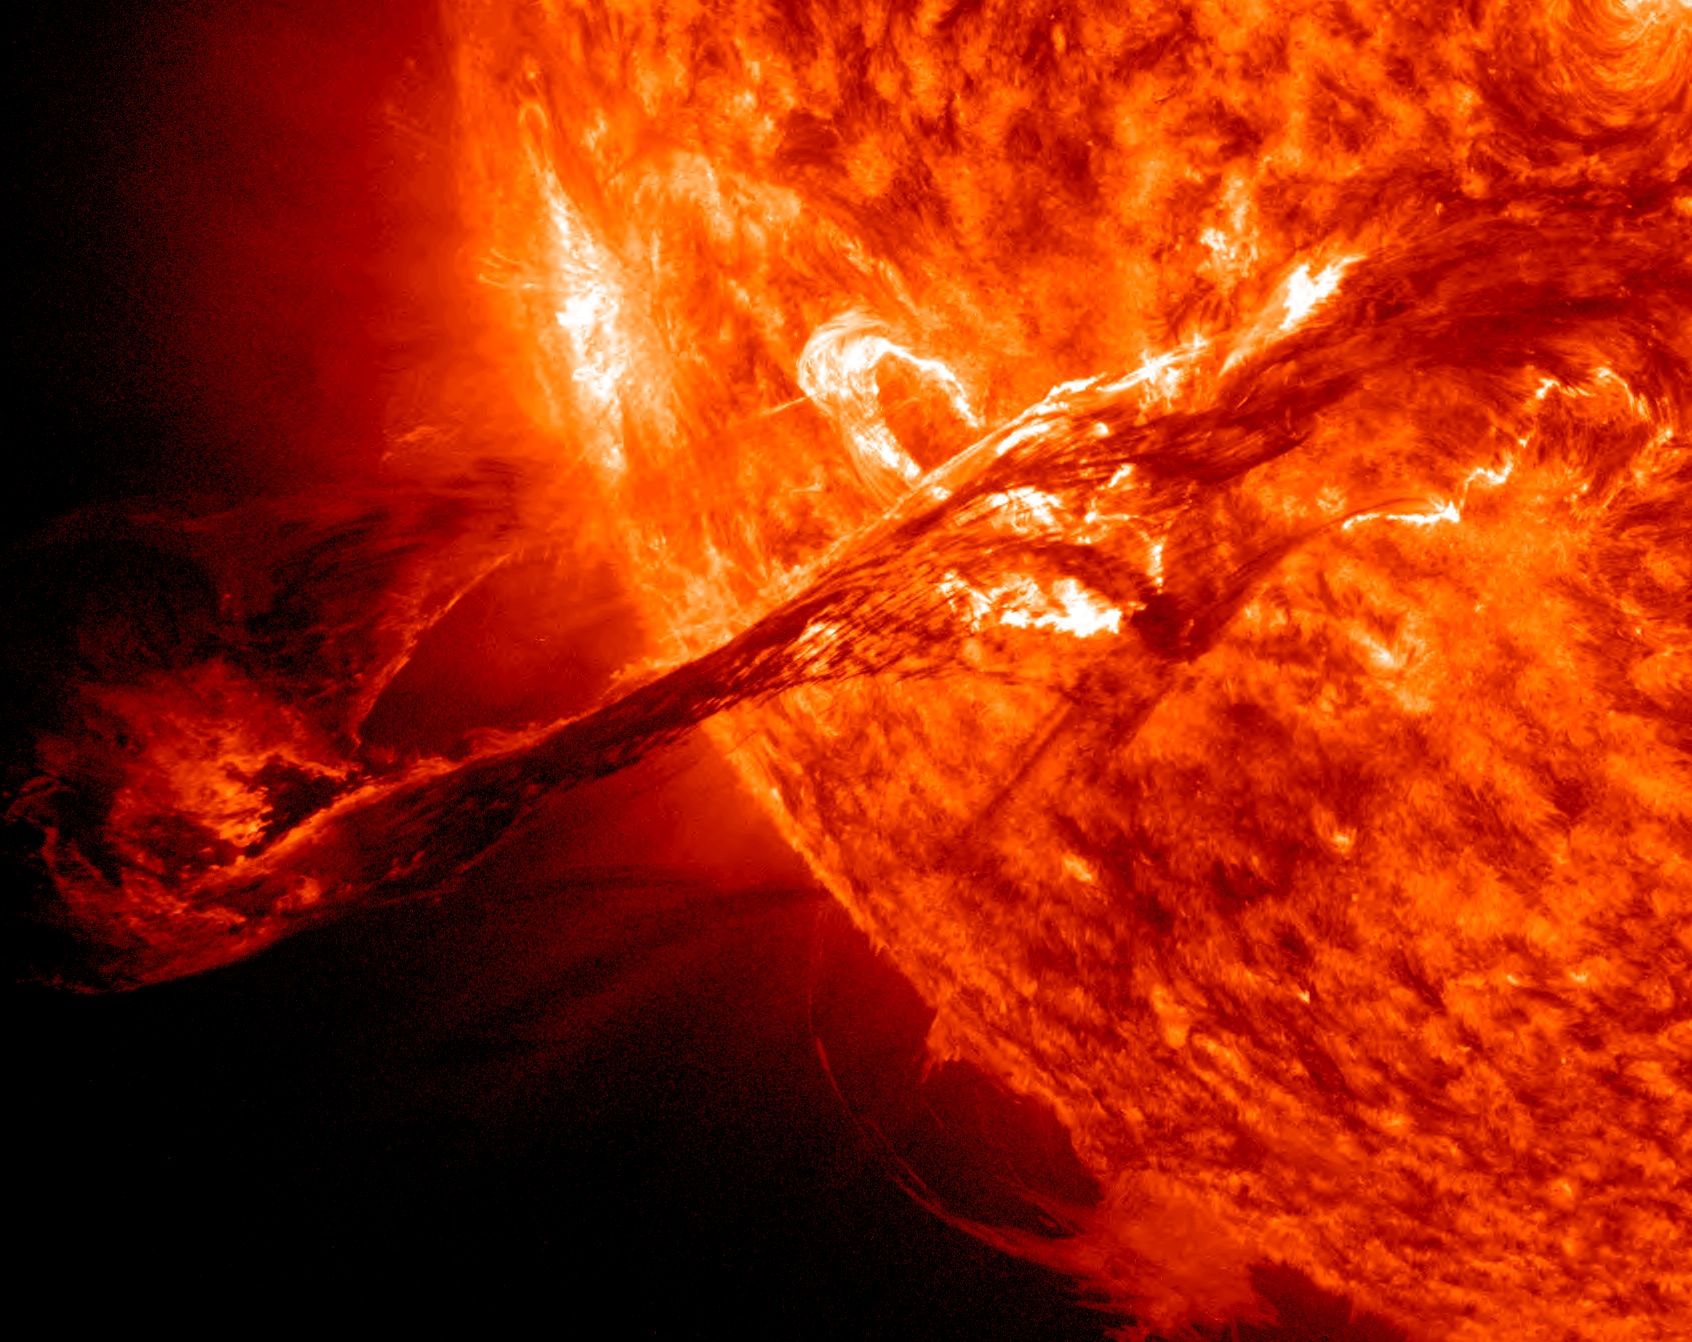
An enormous tree-shaped prominence spreads its “branches” tens of thousands of miles above the Sun’s photosphere in this image, a section of a photo acquired in hydrogen alpha (Ha) by Alan Friedman last week from his backyard in Buffalo, NY.

Writes Alan on his blog, “gotta love a sunny day in November!”

Check out the full image — along with an idea of just how big this “tree” is — after the jump:

Taken through a special solar telescope and a Grasshopper CCD camera, Alan’s gorgeous solar photos show the Sun in a wavelength absorbed by atomic hydrogen — most present in the photosphere and chromosphere — thus revealing the complex and dynamic activity of the Sun’s “surface”.

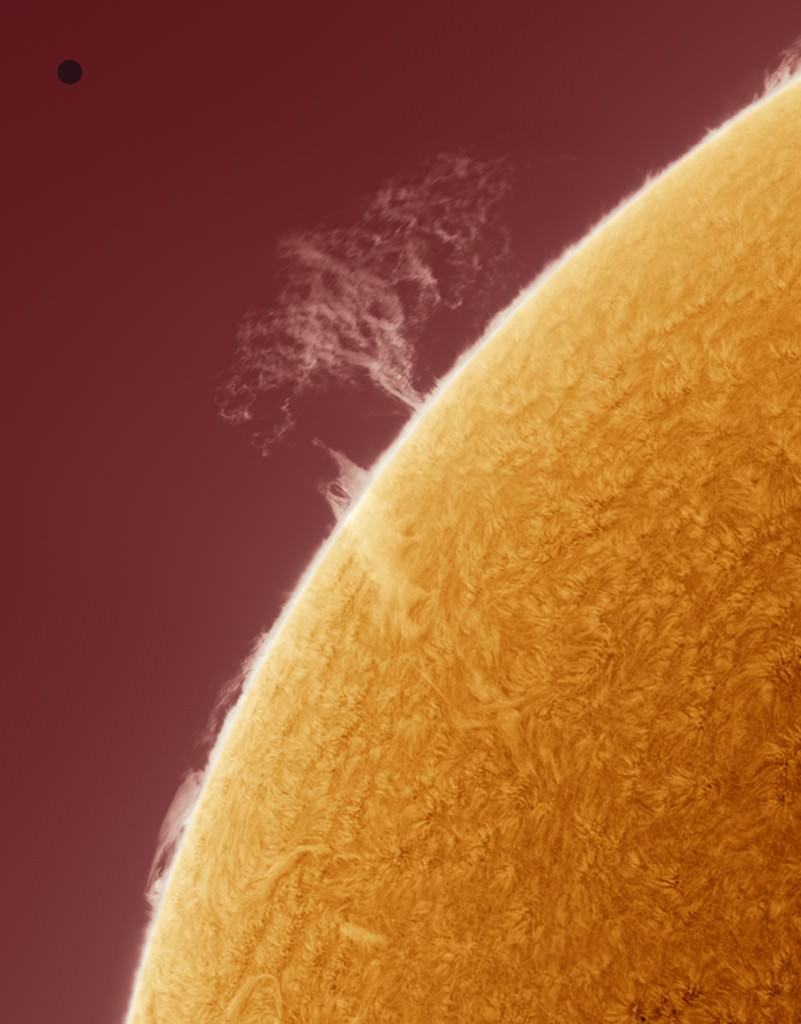
Here’s the full image:

The dark circle at upper left (added by me) shows approximately the scale size of Earth (12,756 km, or about 7,926 miles diameter.) As you can see, that particular prominence is easily six times that in altitude, and spreads out many more times wider… and this isn’t even a particularly large prominence! As far as solar activity goes, this is a non-event. (Not like what was seen by SDO on Nov. 16!)

Regardless, it makes for an impressive backyard photo.

Check out more of Alan’s photos on his blog and on his website, AvertedImagination.com. Many of his photos, some of which have been shown at galleries across the U.S., are available as limited-edition prints. (Alan also runs a greeting card print studio.) I’ve found that he usually shares at least a couple of fantastic solar shots every month, if not more.

Image © Alan Friedman. All rights reserved. Used with permission.


Disco Sun: X-Class Flare Creates Strobe-Light Effect

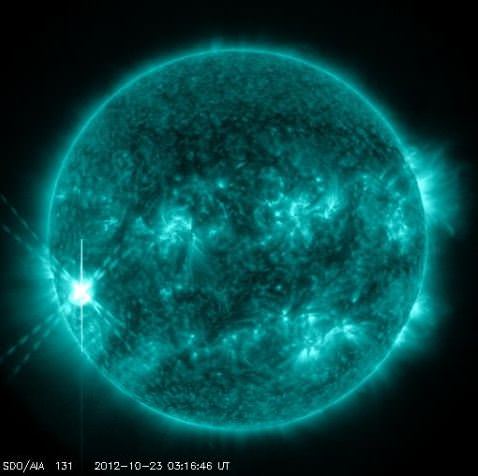
An active region just turning into view on the left side of the Sun has emitted three large flares since Saturday: an M9, an M5 and early today blasted out an X1.8 class flare. This flare occurred around 3:17 am UTC today (or 11:17 pm EDT on Oct. 22). The strobe-light-like effect visible in the video was created by the brightness of the flare and how the instruments on the Solar Dynamics Observatory responded to it. Phil Chamberlin, Deputy Project Scientist SDO told Universe Today that built in algorithms called ‘active exposure control’ compensate for the extra light coming in from a flare. It doesn’t always result in the strobe or fluttering effect, but the algorithms create shorter exposure time, and thus a dimmer, but still scientifically useful view of the entire Sun. The algorithms go into effect whenever there is an M class or higher flare.

Solar flares are powerful bursts of radiation. Harmful radiation from a flare can’t pass through Earth’s atmosphere and pose a hazard to humans on the ground, but flares like this can disturb the atmosphere in the layer where GPS and communications signals travel, and an X-class flare of this intensity can cause problems or even blackouts in radio communications.

A Coronal Mass Ejection (CME) was not associated with this flare, and the flare was not directed at Earth, so scientists do not expect any additional auroral activity to be a result of this latest blast from the Sun.

An image from the Solar Dynamics Observatory during the X-class flare event on Oct. 23, 2012 (UTC). Credit: NASA/SDO

The SDO Twitter feed said there is a 75% chance of more M-class solar flares from this active region and a 20% chance of additional X-class flares.

This is the 7th X-class flare in 2012 with the largest being an X5.4 flare on March 7.

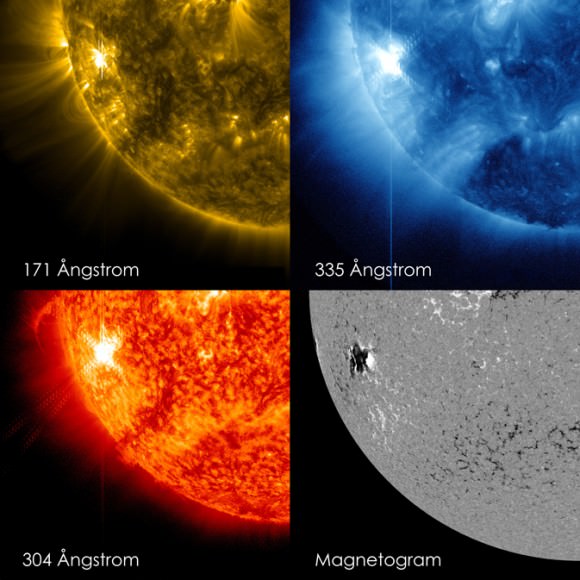
By observing the sun in a number of different wavelengths, NASA’s telescopes can tease out different aspects of events on the sun. These four images of a solar flare on Oct. 22, 2012, show from the top left, and moving clockwise: light from the sun in the 171 Angstrom wavelength, which shows the structure of loops of solar material in the sun’s atmosphere, the corona; light in 335 Angstroms, which highlights light from active regions in the corona; a magnetogram, which shows magnetically active regions on the sun; light in the 304 Angstrom wavelength, which shows light from the region of the sun’s atmosphere where flares originate. (Credit: NASA/SDO/Goddard)

More info: NASA, SpaceWeather.com

Our Gorgeous, Graceful, Gradient Sun

Here’s a mesmerizing video from the folks over at NASA’s Goddard Space Flight Center’s visualization studio showing the Sun in a whole new light… well, a reprocessed light anyway.

Using what’s called a gradient filter, images of the Sun can be adjusted to highlight the intricate details of its dynamic atmosphere. Magnetic activity that’s invisible to human vision can be brought into view, showing the powerful forces in play within the Sun’s corona and helping researchers better understand how it affects space weather. (Plus they sure are pretty!)

Compiled into a video, these images reveal the hidden beauty — and power — of our home star in action.

Video courtesy NASA/GSFC

Astrophoto: Stunning Sun Halo Revisited

When we posted an astrophoto earlier this week of a spectacular 22-degree Sun halo seen in Kuala Lumpur, we quickly got a note from Theo Wellington from Madison, Tennessee USA, who may have one-upped that image. Make that two-upped. “Not only did we have the 22 degree halo, but a circumscribed halo AND a parhelic circle as well!” Wellington wrote. “I became a distracted driver and had to pull off the road to look and photograph.” He added that Moon halo was seen the night before in the same location, as well.

What a stunning view — like a giant eyeball looking back at you!

Wellington used a Pentax K100D, 11mm fisheye lens, f13 1/4000, iso 400.

Want to get your astrophoto featured on Universe Today? Join our Flickr group or send us your images by email (this means you’re giving us permission to post them). Please explain what’s in the picture, when you took it, the equipment you used, etc.

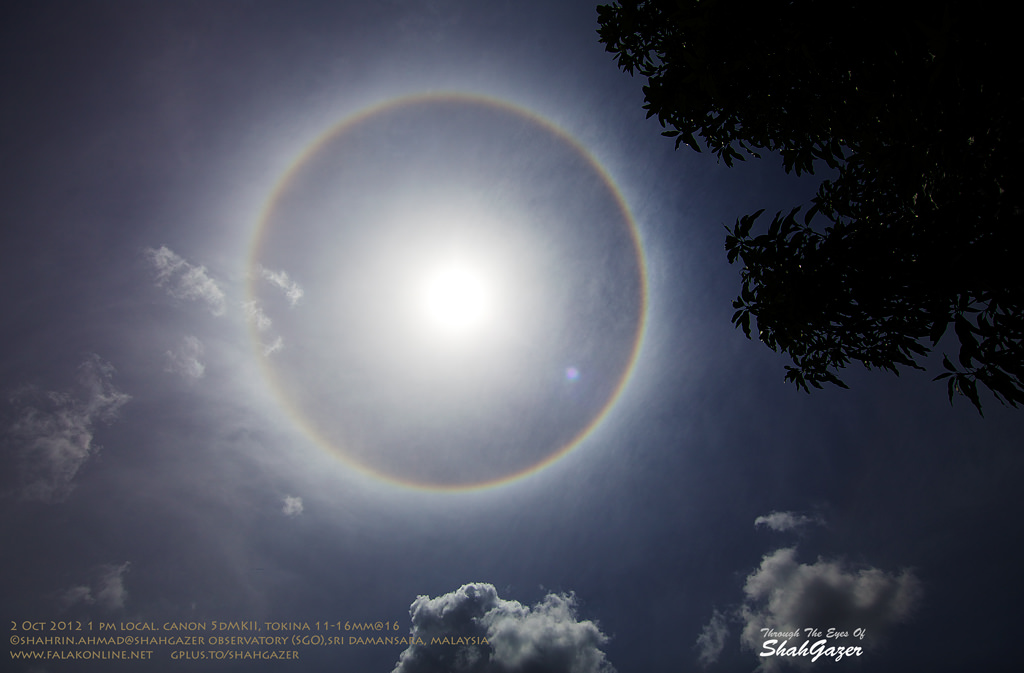
Astrophoto: Spectacular 22-Degree Sun Halo Over Kuala Lumpur

A 22 degree Sun halo was seen in Kuala Lumpur on October 2, 2012. Credit: Shahrin Ahmad

Denizens of Kuala Lumpur, Malaysia were treated to a stunning mid-day meteorological phenomenon today (October 2, 2012,) a Sun Halo. A ‘rainbow’ of sorts forms around the Sun (or the Moon, too) when the light is refracted by ice crystals from high cirrostratus clouds.

News reports said the spectacle began around 12.30pm local time, “a sight which drew gasps of wonder from office workers on their way to lunch.”

Shahrin Ahmad captured the beautiful view and sent it to Universe Today.

“This is among the cleanest view of the Halo I’ve seen so far, and created quite a buzz everywhere,” he said.

Want to get your astrophoto featured on Universe Today? Join our Flickr group or send us your images by email (this means you’re giving us permission to post them). Please explain what’s in the picture, when you took it, the equipment you used, etc.

Peekaboo Sun: SDO’s Eclipse Season

Now you see it, now you don’t! Around the solstices, the Solar Dynamics Observatory ends up having an “eclipse season,” where the Sun, Earth, and the SDO line up, and some of the images and video sent down from the spacecraft appear as though the Sun disappears for a while or just part of the Sun is visible. This is a normal part of life with a geosynchronous observatory, the SDO team says.

They explain it this way:

“Twice a year, SDO enters an eclipse season where the spacecraft slips behind Earth for up to 72 minutes a day. Unlike the crisp shadow one sees on the sun during a lunar eclipse, Earth’s shadow has a variegated edge due to its atmosphere, which blocks the sun light to different degrees depending on its density. Also, light from brighter spots on the sun may make it through, which is why some solar features extend low into Earth’s shadow.”

There’s no way to avoid the loss of images, but the continuous contact with the ground station SDO’s orbit allows was judged to outweigh the loss of some images.

This eclipse season started September 6, and it ends tomorrow, on September 29, 2012, so see it while you can!

Parallax Effect Charted in the 2012 Transit of Venus

Combined images taken simultaneously (06 June 2012, 03:46:18 UTC) from Svalbard and Canberra, showing the Venus parallax effect from 2 different locations on Earth, separated by 11600km. Credit: Pérez Ayúcar/Breitfellner

Back in the 18th century, astronomers were trying to determine the distance from the Earth to the Sun. They used the parallax method during the Transits of Venus the 1760s to help answer that question, and their results provided a cosmic measuring stick that has allowed astronomers to measure distances in the Universe.

How did that method work? New images and movies of the transit of Venus on June 6, 2012 which compare event from two different locations on Earth clearly show the parallax effects that have made Venus transits so important historically.


The movies compress 6 hours of observations and 5,000 individual images taken by optical and solar telescopes into a 40 second video. Data gaps due to cloudy conditions produce jumps in the otherwise smooth Venus motion across the Sun disk. The observations were taken from Svalbard in Norway and Canberra in Australia, which are separated by 11,600 km (7,200 miles).

When the images from the two locations are compared, the parallax effect is obvious.

By knowing the distance between two observers on Earth and comparing the differences in their observations, astronomers were able to work out the distance from the Earth to Venus. And because of Johannes Kepler’s calculations, 18th century astronomers already knew Venus’ orbit is about 70 percent that of Earth’s. So by knowing the distance between the Earth and Venus, they were also able to figure out the value for the Astronomical Unit.

The images used in the movies were obtained by members of the European Space Astronomy Centre, which is located outside Madrid. Two of the observers, Miguel Pérez Ayúcar and Michel Breitfellner are on the science operations planning team for the Venus Express satellite, which has been orbiting Venus since 2006.

“During the hours of the transit we were delighted by the slow, delicate, gracious passage of Venus in front of the Sun,” Ayúcar said. “A perfect black circle, containing a world in it, moving in front of its looming parent star. How thankful we were to witness it. Now with these movies, we can share a sense of that experience.”

Breitfellner said, “In the 18th century people realized that transits of Venus could be used to measure the distance from the Earth to the Sun. Teams of astronomers were sent all across the world to measure this effect. The 2012 transit has its own historical importance – it is the first that has occurred when a spacecraft is in orbit at Venus. Science teams are now working to compare observations of the Venus transit from Earth with simultaneous observations from Venus Express.”

Colin Wilson, Operations Scientist for Venus Express, said, “Planetary transits are not just of historical interest, they have acquired a new importance in the study of newly discovered planets around other stars. Because we cannot image exoplanets directly, it is only by studying their transits that we can discover whether they harbour liquid water or other potential ‘biomarker’ molecules like methane or ozone. The Venus transit is an example much closer to home, offering us a chance to test our understanding of how to interpret transit data. This certainly added extra interest as we watched the Venus transit in June – particularly knowing it was our last chance that we’d have to wait until 2117 to see the next one!”

Transit of Venus 2012 from Svalbard and Canberra from Lightcurve Films on Vimeo.

Source: EPSC

Planets in our Solar System May Have Formed in Fits and Starts

Solar shockwaves would have produced proto-planetary rings at different times, meaning the planets did not form simultaneously (artist concept). Credit: ESO.

Did all the planets in our Solar System form at about the same time? Conventional thinking says the components of our Solar System all formed at the same time, and formed rather quickly. But new research indicates that a series of shockwaves emitted from our very young Sun may have caused the planets to form at different times over millions of years.

“The planets formed in intervals – not altogether, as was previously thought,” said Dr. Tagir Abdylmyanov, Associate Professor from Kazan State Power Engineering University in Russia.

Abdylmyanov’s research, which models the movements of particles in fluids and gasses and in the gas cloud from which our Sun accreted, indicates that the first series of shockwaves during short but very rapid changes in solar activity would have created the proto-planetary rings for Uranus, Neptune, and dwarf planet Pluto first. Jupiter, Saturn, and the asteroid belt would have come next during a series of less powerful shockwaves. Mercury, Venus, Earth, and Mars would have formed last, when the Sun was far calmer. This means that our own planet is one of the youngest in the Solar System.

“It is difficult to say exactly how much time would have separated these groups,” Abdylmyanov said, “but the proto-planetary rings for Uranus, Neptune and Pluto would have likely formed very close to the Sun’s birth. 3 million years later and we would see the debris ring destined to form Saturn. Half a million years after this we would see something similar but for Jupiter. The asteroid belt would have begun to form about a million years after that, and another half a million years on we would see the very early stages of Mercury, Venus, Earth and Mars.”

The shockwaves emitted from the new-born Sun would have rippled out material at different times, creating a series of debris rings around the Sun from which the planets formed.

Abdylmayanov hopes that this research will help us understand the development of planets around distant stars. “Studying the brightness of stars that are in the process of forming could give indications as to the intensity of stellar shockwaves. In this way we may be able to predict the location of planets around far-flung stars millions of years before they have formed.”

His work was part of the European Planetary Science Congress taking place this week in Madrid, Spain.

STEREO Spots a CME Soaring Into Space

Press “play.” Say “wow.”

The enormous eruption of a solar prominence and resulting coronal mass ejection (CME) back on August 31 that was captured in amazing HD by NASA’s Solar Dynamics Observatory was also spotted by the Sun-flanking STEREO-B spacecraft, which observed the gigantic gout of solar material soaring away from the Sun.

This video shows the eruption as it passes across the fields of view of several of STEREO-B’s cameras over the course of 48 hours.

According to NASA’s Goddard Space Flight Center, “while CMEs are routinely seen in the Heliographic Imager (HI) telescopes, it’s very rare for prominences to stay visible for so long. The HI1 field of view ranges from 4 to 24 degrees away from the Sun. To get a sense of scale, we know the Sun is roughly 860,000 miles wide — and look how far the prominence holds together. And this CME is so bright it initially saturates the COR1 telescope.”

The bright spot in the red (COR2) field of view is the planet Venus.

Coronal mass ejections are huge bubbles of gas bounded by magnetic field lines that are ejected from the Sun over the course of several minutes — sometimes even hours. If they are directed toward Earth, the cloud of charged solar particles can interact with our magnetosphere and cause anything from increased auroral activity to radio interference to failure of sensitive electromagnetic equipment.

Particularly long filaments like the one that caused the August 31 CME have been known to collapse with explosive results when they hit the stellar surface.

The CME did not travel directly toward Earth but did connect with Earth’s magnetosphere with a glancing blow, causing bright aurorae to appear around the upper latitudes on the night of September 3.

Image: NASA/STEREO/GSFC

Huge Eruption on the Sun Revisited in Spectacular HD

This one may truly knock your socks off. Remember the spectacular filament eruption on the Sun on August 31 that we posted last week? The folks from NASA Goddard’s Scientific Visualization Studio now have put out a video of the eruption in high definition, and it is definitely worth watching to witness the awesome power of the Sun. The new video also includes data from STEREO and SOHO — as well as the data from the Solar Dynamics Observatory — so the tremendous Coronal Mass Ejection is visible as it travels outward from the Sun. Wow.

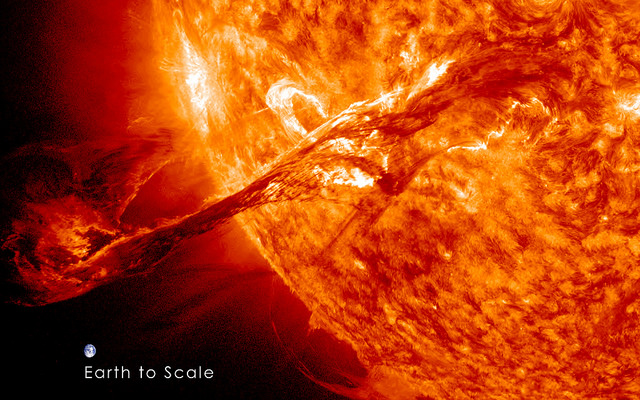
Below is an image of the filament eruption that includes a scale model of Earth. As the @NASAGoddard Twitter feed posted: “Reason #1 why it’s a REALLY good thing that the sun is 93,000,000 miles 150 million km) from Earth…. [mind blowing photo]”

The image above includes an image of Earth to show the size of the filament eruption compared to the size of Earth. Credit: NASA/GSFC/SDO

Thanks to Scott Wiessinger and the Scientific Visualization Studio for the great video and images.