The Orbit of Earth. How Long is a Year on Earth?

Diagram of the Earths orbit around the Sun. Credit: NASA/H. Zell

Ever since the 16th century when Nicolaus Copernicus demonstrated that the Earth revolved around in the Sun, scientists have worked tirelessly to understand the relationship in mathematical terms. If this bright celestial body – upon which depends the seasons, the diurnal cycle, and all life on Earth – does not revolve around us, then what exactly is the nature of our orbit around it?

For several centuries, astronomers have applied the scientific method to answer this question, and have determined that the Earth’s orbit around the Sun has many fascinating characteristics. And what they have found has helped us to understanding why we measure time the way we do.

Orbital Characteristics:

First of all, the speed of the Earth’s orbit around the Sun is 108,000 km/h, which means that our planet travels 940 million km during a single orbit. The Earth completes one orbit every 365.242199 mean solar days, a fact which goes a long way towards explaining why need an extra calendar day every four years (aka. during a leap year).

The planet’s distance from the Sun varies as it orbits. In fact, the Earth is never the same distance from the Sun from day to day. When the Earth is closest to the Sun, it is said to be at perihelion. This occurs around January 3rd each year, when the Earth is at a distance of about 147,098,074 km.

The average distance of the Earth from the Sun is about 149.6 million km, which is also referred to as one astronomical unit (AU). When it is at its farthest distance from the Sun, Earth is said to be at aphelion – which happens around July 4th where the Earth reaches a distance of about 152,097,701 km.

And those of you in the northern hemisphere will notice that “warm” or “cold” weather does not coincide with how close the Earth is to the Sun. That is determined by axial tilt (see below).

Elliptical Orbit:

Next, there is the nature of the Earth’s orbit. Rather than being a perfect circle, the Earth moves around the Sun in an extended circular or oval pattern. This is what is known as an “elliptical” orbit. This orbital pattern was first described by Johannes Kepler, a German mathematician and astronomer, in his seminal work Astronomia nova (New Astronomy).
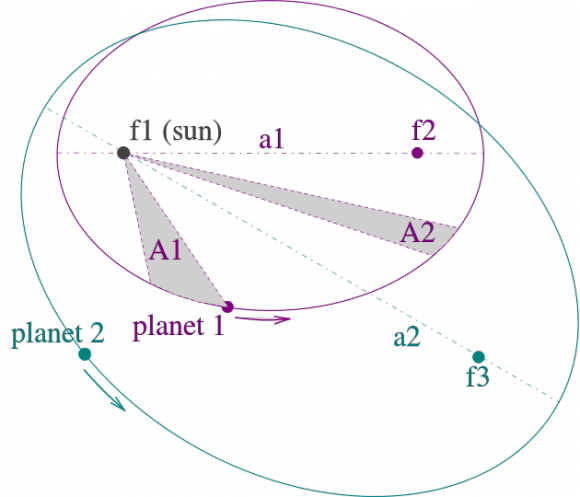
An illustration of Kepler's three laws of motion, which show two planets that have elliptical orbits around the Sun. Credit: Wikipedia/Hankwang
An illustration of Kepler’s three laws of motion, which show two planets that have elliptical orbits around the Sun. Credit: Wikipedia/Hankwang

After measuring the orbits of the Earth and Mars, he noticed that at times, the orbits of both planets appeared to be speeding up or slowing down. This coincided directly with the planets’ aphelion and perihelion, meaning that the planets’ distance from the Sun bore a direct relationship to the speed of their orbits. It also meant that both Earth and Mars did not orbit the Sun in perfectly circular patterns.

In describing the nature of elliptical orbits, scientists use a factor known as “eccentricity”, which is expressed in the form of a number between zero and one. If a planet’s eccentricity is close to zero, then the ellipse is nearly a circle. If it is close to one, the ellipse is long and slender.

Earth’s orbit has an eccentricity of less than 0.02, which means that it is very close to being circular. That is why the difference between the Earth’s distance from the Sun at perihelion and aphelion is very little – less than 5 million km.

Seasonal Change:

Third, there is the role Earth’s orbit plays in the seasons, which we referred to above. The four seasons are determined by the fact that the Earth is tilted 23.4° on its vertical axis, which is referred to as “axial tilt.” This quirk in our orbit determines the solstices – the point in the orbit of maximum axial tilt toward or away from the Sun – and the equinoxes, when the direction of the tilt and the direction to the Sun are perpendicular.
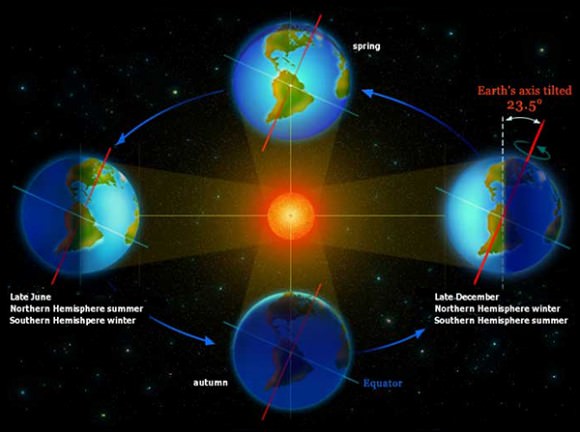
Over the course of a year the orientation of the axis remains fixed in space, producing changes in the distribution of solar radiation. These changes in the pattern of radiation reaching earth’s surface cause the succession of the seasons. Credit: NOAA/Thomas G. Andrews
Over the course of a year the orientation of the axis remains fixed in space, producing changes in the distribution of solar radiation. Credit: NOAA/Thomas G. Andrews

In short, when the northern hemisphere is tilted away from the Sun, it experiences winter while the southern hemisphere experiences summer. Six months later, when the northern hemisphere is tilted towards the Sun, the seasonal order is reversed.

In the northern hemisphere, winter solstice occurs around December 21st, summer solstice is near June 21st, spring equinox is around March 20th and autumnal equinox is about September 23rd. The axial tilt in the southern hemisphere is exactly the opposite of the direction in the northern hemisphere. Thus the seasonal effects in the south are reversed.

While it is true that Earth does have a perihelion, or point at which it is closest to the sun, and an aphelion, its farthest point from the Sun, the difference between these distances is too minimal to have any significant impact on the Earth’s seasons and climate.

Lagrange Points:

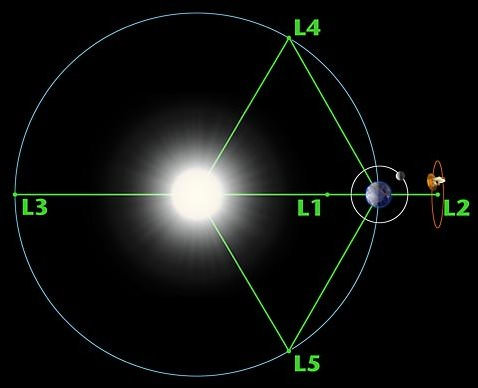
Another interesting characteristic of the Earth’s orbit around the Sun has to do with Lagrange Points. These are the five positions in Earth’s orbital configuration around the Sun where where the combined gravitational pull of the Earth and the Sun provides precisely the centripetal force required to orbit with them.
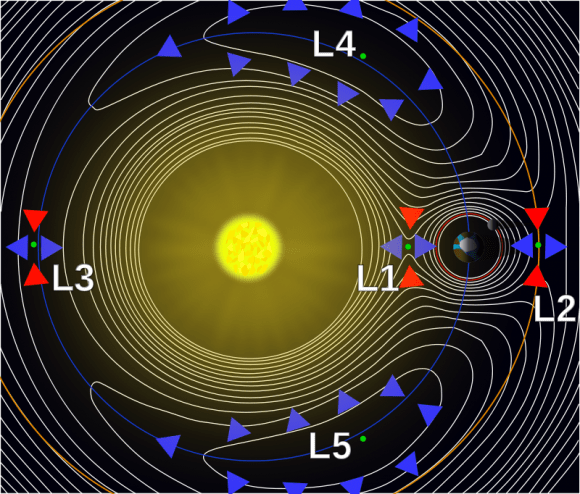
Sun Earth Lagrange Points. Credit: Xander89/Wikimedia Commons
Sun-Earth Lagrange Points. Credit: Xander89/Wikimedia Commons

The five Lagrange Points between the Earth are labelled (somewhat unimaginatively) L1 to L5. L1, L2, and L3 sit along a straight line that goes through the Earth and Sun. L1 sits between them, L3 is on the opposite side of the Sun from the Earth, and L2 is on the opposite side of the Earth from L1. These three Lagrange points are unstable,  which means that a satellite placed at any one of them will move off course if disturbed in the slightest.

The L4 and L5 points lie at the tips of the two equilateral triangles where the Sun and Earth constitute the two lower points. These points liem along along Earth’s orbit, with L4 60° behind it and L5 60° ahead.  These two Lagrange Points are stable, hence why they are popular destinations for satellites and space telescopes.

The study of Earth’s orbit around the Sun has taught scientists much about other planets as well. Knowing where a planet sits in relation to its parent star, its orbital period, its axial tilt, and a host of other factors are all central to determining whether or not life may exist on one, and whether or not human beings could one day live there.

We have written many interesting articles about the Earth’s orbit here at Universe Today. Here’s 10 Interesting Facts About Earth, How Far is Earth from the Sun?, What is the Rotation of the Earth?, Why are there Seasons?, and What is Earth’s Axial Tilt?

For more information, check out this article on NASA- Window’s to the Universe article on elliptical orbits or check out NASA’s Earth: Overview.

Astronomy Cast also espidoes that are relevant to the subject. Here’s BQuestions Show: Black black holes, Unbalancing the Earth, and Space Pollution.

Sources:

Communicating Across the Cosmos, Part 2: Petabytes from the Stars?

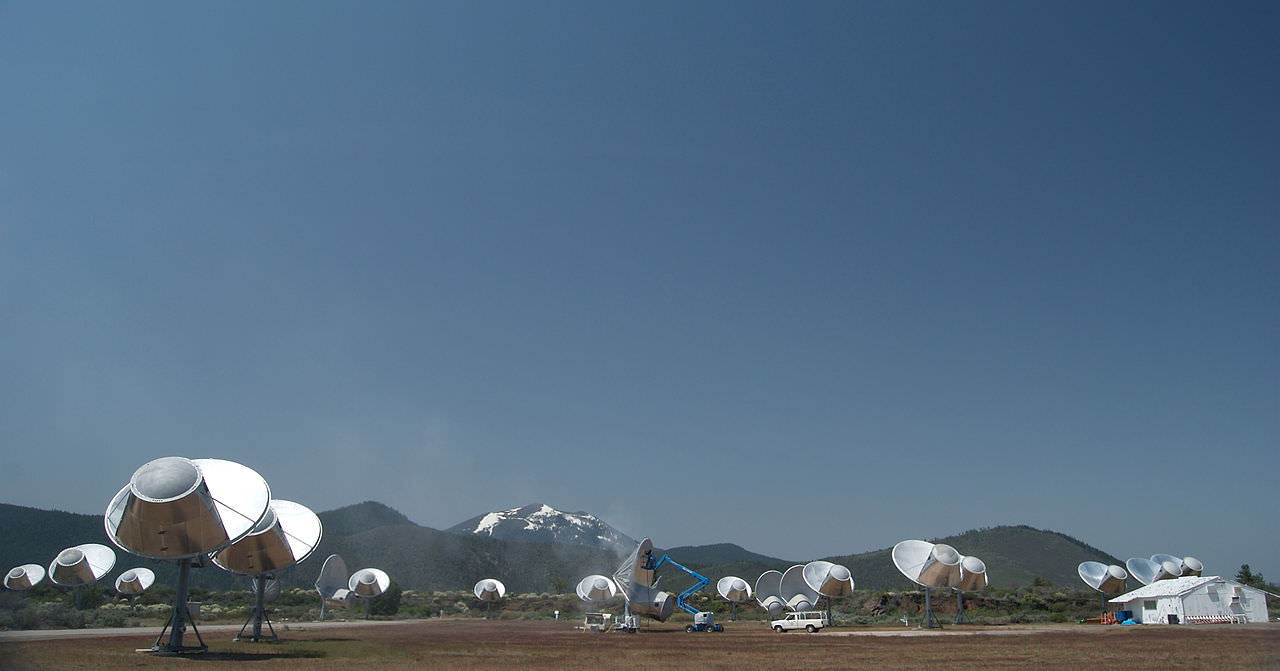
The Allen Telescope Array is the first radio telescope designed specifically for SETI Photo by Colby Gutierrez-Kraybill

Since it was founded in 1984, the SETI (Search for Extraterrestrial Intelligence) Institute in Mountain View, California, has been a principal American venue for scientific efforts to discover evidence of extraterrestrial civilizations. In mid-November, the institute sponsored a conference, “Communicating across the Cosmos”, on the problems of devising and understanding messages from other worlds. The conference drew 17 speakers from numerous disciplines, including linguistics, anthropology, archeology, mathematics, cognitive science, philosophy, radio astronomy, and art.

This is the second of four installments of a report on the conference. Today, we’ll look at the SETI Institute’s current efforts to find an extraterrestrial message, and some of their future plans. If they find something, just how much information can we expect to receive? How much can we send?

The idea of using radio to listen for messages from extraterrestrials is as old as radio itself. Radio pioneers Nikola Tesla and Guglielmo Marconi both listened for signals from the planet Mars early in the 20th century. The first to listen for messages from the stars was radio astronomer Frank Drake in 1960. Until recently though, SETI projects have been limited and sporadic. That began to change in 2007 when the SETI Institute’s Allen Telescope Array (ATA) started observations.

Consisting of 42 small dishes, the ATA is the first radio telescope in the world designed specifically for SETI. The SETI search is currently managed by Jon Richards, an engineer who is an expert on both the system’s hardware and software. He spoke at the conference about the project. The ATA is currently used for SETI research twelve hours out of each day, from 7 pm to 7 am. During the day, the site is operated by Stanford Research International to perform more conventional astronomical studies. When used for such observations, the dishes can function together as an interferometer, generating images of celestial radio sources. To minimize radio interference from human activities, the telescope is sited a six hour drive north of the SETI Institute at the remote Hat Creek Observatory in the Cascade Mountains of Northern California.

The ATA can detect signals over the range from 1 to 10 GHz. The researchers use several strategies to tell potential ETI signals apart from naturally occurring radio sources in space, and human-made terrestrial interference. Radio emissions from natural sources are smeared over a broad range of frequencies. Artificial signals designed for communication typically pack all of their energy into a very narrow frequency band. To detect such signals, the ATA can resolve frequency differences down to just 1 Hz.

When a radio source is moving with respect to the receiver, it appears to change in frequency. This phenomenon is called the Doppler effect. Because an alien planet and the Earth would be moving in relation to one another, a genuine ETI signal would exhibit the Doppler effect. A source of terrestrial interference that’s fixed to the Earth wouldn’t. If the beam of the telescope is shifted away from the target, a genuine alien signal emanating from a distant point in space would disappear, reappearing when the beam was shifted back. A signal due to local interference wouldn’t.

This illustration of the Doppler effect shows the change of wavelength caused by the motion of the source. Credit: ARM.

The ATA is designed to perform these tests automatically whenever it detects a potential candidate signal. To make sure, it repeats the second test five times. If a signal passes the tests, the operator is automatically sent an e-mail, and the candidate signal is entered into a database. Periodically, as a test, the telescope is programed to point in the direction of one of the two Voyager spacecraft. Because these spacecraft are hurtling through deep space beyond the orbit of Neptune, their signals mimic the properties expected from an alien transmission. So far, all the e-mails received have been generated by such tests, and by false alarms. The fateful e-mail announcing the successful detection of an extraterrestrial signal has not yet been sent.

Richards explained that the ATA’s most recent project has been to listen to more than one hundred Earth-like planets discovered by the Kepler space telescope between 2009 and 2012. Next year the ATA’s antenna feeds will get an upgrade that will increase their upper frequency limit to 15 GHz and greatly increase their sensitivity. Both ground-based and Kepler studies have identified numerous Earth-like planets at habitable distances from small dim red dwarf stars. A systematic search of these stars is planned next. If the SETI Institute can find the funding they hope eventually to expand the ATA to 350 dishes.

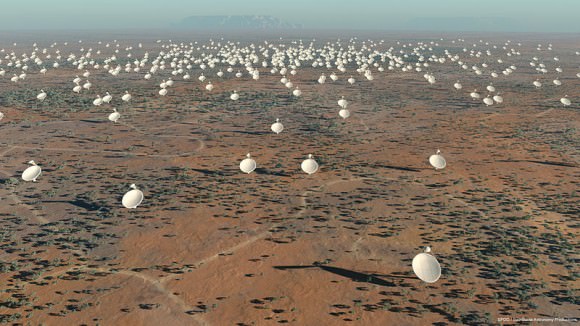
According to astronomer Jill Tartar, the retired director of the SETI Institute’s Center for SETI Research, the institute is hoping to become involved in a much larger international project; the Square Kilometer Array (SKA). When it begins operations in 2020, the SKA is planned to be the world’s largest radio telescope. It will consist of several thousand dishes and other receivers giving it a radio signal collecting area of one square kilometer. The advantage of having more collecting area is that the telescope is sensitive to fainter signals. If funding allows it to be built in the way currently planned, it will be capable of training multiple simultaneous beams at the sky, some of which Tartar said might be used to mount a continuously ongoing SETI search.

The planned Square Kilometer Array will be the world's largest radio telescope when it begins operations in 2018  Swinburne Astronomy Productions for SKA Project Development Office
The planned Square Kilometer Array will be the world’s largest radio telescope when it begins operations in 2018 Swinburne Astronomy Productions for SKA Project Development Office

Suppose we did find something. What sort of reply could we send? How much do we have the technological capability to send, if we wanted to? Back in 1974, in the first demonstration of the capacity for interstellar messaging, the Arecibo radio telescope transmitted a mere 210 bytes, and took 3 minutes to do it. The message consisted of a human stick figure and a few other crude symbols and diagrams. Because this primitive effort is still the most well-known example of interstellar radio messaging, prepare yourself for a stunning surprise. According to SETI Institute radio astronomer Seth Shostak, using broadband microwave radio, we could send them the Library of Congress (consisting of 17 million books) in 3 days, and the contents of the World Wide Web (as of 2008) in a comparable time.

Using the shorter optical wavelengths of a laser beam and optical broadband, we could send either one in 20 minutes. Since the extraterrestrials might tune in at any time, we would need to send the transmission over and over again many times. Although our transmissions could be sent in only days or minutes, they would, of course, still take decades or centuries to traverse the light years. This transmission capability presents a stunning opportunity. We can send anything. We can send everything. Could it really be that someday, beings from Tau Ceti will peruse your Facebook page?

So what can we expect from the aliens? Any message we might receive, Seth Shostak thought, would be of one of two possible sorts. A civilization already aware of our existence, he believed, would send us a huge message, rich in information content. This is because even if technological civilizations are fairly common in the galaxy the nearest one might be tens, hundreds, or thousands of light years away. Radio messages traveling at the speed of light will take that long to cross those distances, and decades or centuries will elapse between query and response. If we are contacted, Shostak really does think that we should send the aliens the entire content of the World Wide Web. Civilizations further away than 70 light years from Earth probably wouldn’t know that we exist, because radio signals from Earth haven’t reached them yet. Shostak didn’t think that civilizations would waste precious transmitting time and energy bombarding planets with petabytes of information if they didn’t already know that there was a technological civilization there. Worlds that weren’t known to harbor a civilization, Shostak speculated, might get put on a long list of potentially habitable planets to which the aliens might periodically send a brief “ping” hoping to get a response.

A petabyte of gibberish contains as much information as a petabyte of our world’s greatest art and literature (or tackiest YouTube videos). A petabyte of our world’s greatest art and literature is gibberish to a being who can’t understand it. We could send the aliens truly stunning amounts of information, but can we find some way to ensure that they will understand its meaning? Could we hope to understand an alien message sent to us, or would all those petabytes be for naught? In the next installment, we’ll learn that we face daunting problems.

Part 1: Shouting Into the Darkness

References and Further Readings:

Communicating Across the Cosmos: How can we make ourselves understood by other civilizations in the galaxy, SETI Institute.

N. Atkinson (2012), SETI: The Search Goes On, Universe Today.

S. J. Dick (1996), The Biological Universe: The Twentieth_Century Extraterrestrial Life Debate and the Limits of Science, Cambridge University Press, Cambridge, UK.

S. Hall (2014), Are We Ready for Contact?, Universe Today.

Allen Telescope Array, SETI Institute.

Wow! Epic 4K Timelapse of Aurora Over Iceland and Greenland

Screenshot from 'Two Lands: Greenland and Iceland' by Joe Capra.

Holy Northern Lights, Batman! This new timelapse is just beautiful! Photographer Joe Capra traveled to Greenland and Iceland to shoot 10 nights of the arctic Aurora. Not only was the aurora absolutely stunning, but the landscape is equally beautiful. Joe said that all the footage was shot in super high resolution 4K Ultra HD, and you can even see the bright aurora reflected in small rivers and streams.

Here are some of the locations Joe shot the footage: Greenland locations include the Kangerlussuaq, Ilulissat, Ilimanaq, Ilulissat Ice Fjord, Russell Glacier, Greenland Icecap, and Disko Bay. Iceland locations include the South Coast, Snæfellsnes Peninsula, Kirkjufell, and Grundarfjörður.

Check out more of Joe’s work at his website Scientifantastic.

Two Lands – Greenland | Iceland from SCIENTIFANTASTIC on Vimeo.

Global Warming Watch: How Carbon Dioxide Bleeds Across The Earth

High concentrations of carbon dioxide (in red) tend to congregate in the northern hemisphere during colder months, when plants can't absorb as much from the atmosphere. This picture is based on a NASA Goddard computer model from ground-based observations and depicts concentrations on March 30, 2006. Credit: NASA's Goddard Space Flight Center/B. Putman/YouTube (screenshot)

Red alert — the amount of carbon dioxide in the atmosphere is increasing year-by-year due to human activity. It’s leading to a warming Earth, but just how quickly — and how badly it will change the environment around us — is hard to say.

NASA released a new video showing how carbon dioxide — a product mainly of fossil fuels — shifts during a typical year. Billed as the most accurate model to date, the emissions shown in 2006 (tracked by ground-based sources) show how wind currents across the globe spread the gas across the globe. The red you see up there indicates high concentrations. The full video is below the jump.

In spring and summer, plants absorb carbon dioxide and the amount in the atmosphere above that hemisphere decreases. In fall and winter, carbon dioxide is not absorbed as well since the plants are dead or dormant. Also seen in the video is carbon monoxide that spreads out from forest fires, particularly in the southern hemisphere.

“Despite carbon dioxide’s significance, much remains unknown about the pathways it takes from emission source to the atmosphere or carbon reservoirs such as oceans and forests,” NASA stated.

“Combined with satellite observations such as those from NASA’s recently launched OCO-2 [Orbiting Carbon Observatory-2], computer models will help scientists better understand the processes that drive carbon dioxide concentrations.”

The model is called GEOS-5 and was made by scientists at the NASA Goddard Space Flight Center’s global modeling and assimilation office.

Source: NASA

Subaru Telescope Spots Galaxies From The Early Universe

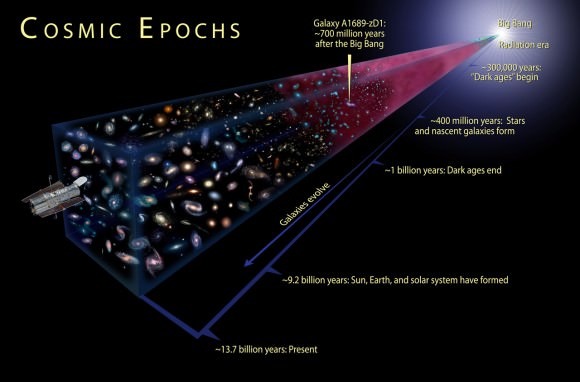
The expansion of the universe over most of its history has been relatively gradual. The notion that a rapid period "inflation" preceded the Big Bang expansion was first put forth 25 years ago. The new WMAP observations favor specific inflation scenarios over other long held ideas.
A team of astronomers have used the Subaru Telescope to look back more than 13 billion years to find 7 early galaxies that appeared quite suddenly within 700 million years of the Big Bang . Credit: NASA/WMAP Science Team

It’s an amazing thing, staring into deep space with the help of a high-powered telescope. In addition to being able to through the vast reaches of space, one is also able to effectively see through time.

Using the Subaru Telescope’s Suprime-Cam, a team of astronomers has done just that. In short, they looked back 13 billion years and discovered 7 early galaxies that appeared quite suddenly within 700 million years of the Big Bang. In so doing, they discovered clues to one of astronomy’s most burning questions: when and how early galaxies formed in our universe.

The team, led by graduate student Akira Konno and Dr. Masami Ouchi (Associate Professor at the University of Tokyo’s ICRR) was looking for a specific kind of galaxy called a Lyman-alpha emitter (LAE), to understand the role such galaxies may have played in an event called “cosmic reionization”.

The current cosmological model states that the universe was born in the Big Bang some 13.8 billion years ago. In its earliest epochs, it was filled with a hot “soup” of charged protons and electrons. As the newborn universe expanded, its temperature decreased uniformly.

 Credit: NASA, ESA & A. Felid (STScI)).
It is estimated that the first stars and galaxies formed 12.8 billion years ago, during a period of “cosmic reionization”. Credit: NASA/ESA/A. Felid (STScI)

When the universe was 400,000 years old, conditions were cool enough to allow the protons and electrons to bond and form neutral hydrogen atoms. That event is called “recombination” and resulted in a universe filled with a “fog” of these neutral atoms.

Eventually the first stars and galaxies began to form, and their ultraviolet light ionized the hydrogen atoms, and “divided” the neutral hydrogen into protons and electrons again. As this occurred, the “fog” of neutral hydrogen cleared.

Astronomers call this event “cosmic reionization” and think that it ended about 12.8 billion years ago – a billion years after the Big Bang. The timing of this event – when it started and how long it lasted – is one of the big questions in astronomy.

To investigate this cosmic reionization, the Subaru team searched for early LAE galaxies at a distance of 13.1 billion light years. Although Hubble Space Telescope has found more distant LAE galaxies, the discovery of seven such galaxies at 13.1 billion light-years represents a distance milestone for Subaru Telescope.

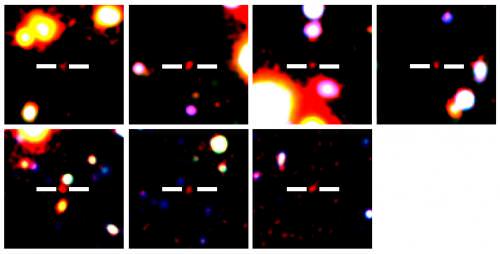
Color composite images of seven LAEs found in this study as they appeared 13.1 billion years ago. This represents the combination of three filter images from Subaru Telescope. Red objects between two white lines are the LAEs. The LAEs of 13.1 billion years ago have a quite red color due to the effects of cosmic expansion on their component wavelengths of light. Credit: ICRR, University of Tokyo
Color composite images of seven LAEs found in the study. The red objects between two white lines are the LAEs. Credit: ICRR, University of Tokyo

Mr. Konno, the graduate student heading the analysis of the data from the Subaru Telescope pointed out the obstacles that Subaru had to overcome to make the observations.”It is quite difficult to find the most distant galaxies due to the faintness of the galaxies.” he said. “So, we developed a special filter to be able to find a lot of faint LAEs. We loaded the filter onto Suprime-Cam and conducted the most distant LAE survey with the integration time of 106 hours.”

That extremely long integration time was one of the longest ever performed at Subaru Telescope. It allowed for unprecedented sensitivity and enabled the team to search for as many of the most distant LAEs as possible.

According to Konno, the team expected to find several tens of LAEs. Instead they only found seven.

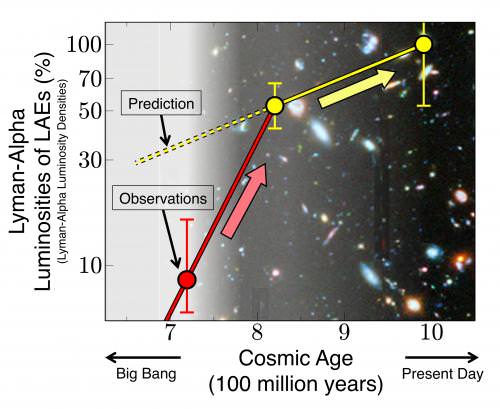
“At first we were very disappointed at this small number,” Konno said. “But we realized that this indicates LAEs appeared suddenly about 13 billion years ago. This is an exciting discovery. We can see that the luminosities suddenly brightened during the 700-800 million years after the Big Bang. What would cause this?”

Figure 2: This shows evolution of the Lyman-alpha luminosities of the galaxies. The yellow circle at 1 billion years after the Big Bang is used for normalization. The yellow circles come from previous studies, and the yellow dashed line shows the expected evolutionary trend of the luminosity. The current finding is shown by a red circle, and we can see that the galaxies appear suddenly when the universe was 700 million years old. This indicates that the neutral hydrogen fog was suddenly cleared, allowing the galaxies to shine out, as indicated by the backdrop shown for scale and illustration. Credit: ICRR, University of Tokyo; Hubble Space Telescope/NASA/ESA
This shows evolution of the Lyman-alpha luminosities of the galaxies. Credit: ICRR, University of Tokyo; Hubble Space Telescope/NASA/ESA

As the table above illustrates, the luminosities of LAEs changed based on this study. The yellow circle at 1 billion years after the Big Bang is used for normalization. The yellow circles come from previous studies, and the yellow dashed line shows the expected evolutionary trend of the luminosity.

The current finding is shown by a red circle, and we can see that the galaxies appear suddenly when the universe was 700 million years old. This indicates that the neutral hydrogen fog was suddenly cleared, allowing the galaxies to shine out, as indicated by the backdrop shown for scale and illustration.

According to the team’s analysis, one reason that LAEs appeared very quickly is cosmic reionization. LAEs in the epoch of cosmic reionization became darker than the actual luminosity due to the presence of the neutral hydrogen fog.

In the team’s analysis of their observations, they suggest the possibility that the neutral fog filling the universe was cleared about 13.0 billion years ago and LAEs suddenly appeared in sight for the first time.

“However, there are other possibilities to explain why LAEs appeared suddenly,” said Dr. Ouchi, who is the principal investigator of this program. “One is that clumps of neutral hydrogen around LAEs disappeared. Another is that LAEs became intrinsically bright. The reason of the intrinsic brightening is that the Lyman-alpha emission is not efficiently produced by the ionized clouds in a LAE due to the significant escape of ionizing photons from the galaxy. In either case, our discovery is an important key to understanding cosmic reionization and the properties of the LAEs in early universe.”

Dr. Masanori Iye, who is a representative of the Thirty Meter Telescope (TMT) project of Japan, commented on the observations and analysis. “To investigate which possibility is correct, we will observe with HSC (Hyper Suprime-Cam) on Subaru Telescope, which has a field of view 7 times wider than Suprime-Cam, and TMT currently being built on the summit of Mauna Kea in Hawaii in the future. By these observations, we will clarify the mystery of how galaxies were born and cosmic reionization occurred.”

Further Reading: Subaru Telescope

New Simulation Offers Stunning Images of Black Hole Merger

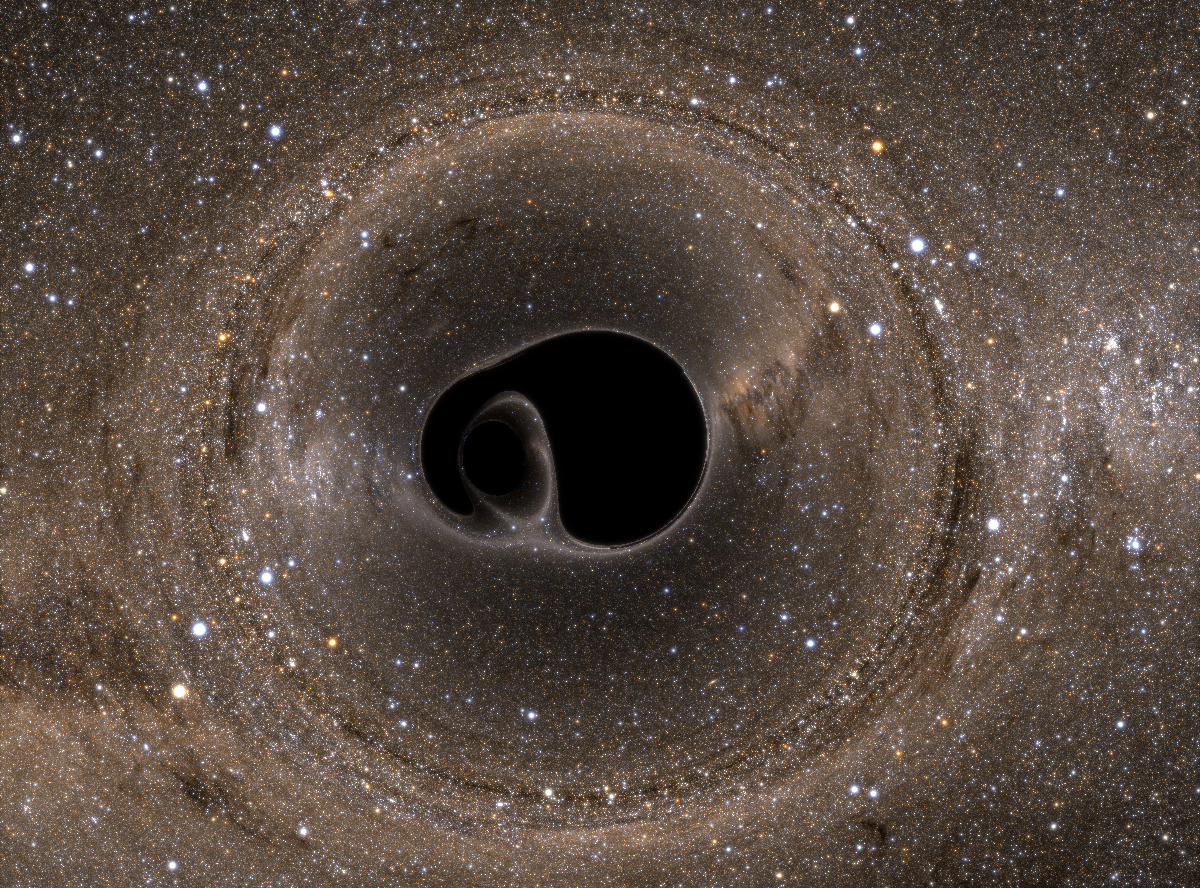
A binary black hole system, viewed edge-on. This pair of extremely dense objects twists and warps spacetime as the two black holes spiral in toward one another. Image Credit: Bohn, Throwe, Hébert, Henriksson, Bunandar, Taylor, Scheel (see http://www.black-holes.org/lensing)

A black hole is an extraordinarily massive, improbably dense knot of spacetime that makes a living swallowing or slinging away any morsel of energy that strays too close to its dark, twisted core. Anyone fortunate (or unfortunate) enough to directly observe one of these beasts in the wild would immediately notice the way its colossal gravitational field warps all of the light from the stars and galaxies behind it, a phenomenon known as gravitational lensing.

Thanks to the power of supercomputers, a curious observer no longer has to venture into outer space to see such a sight. A team of astronomers has released their first simulated images of the lensing effects of not just one, but two black holes, trapped in orbit by each other’s gravity and ultimately doomed to merge as one.

Astronomers have been able to model the gravitational effects of a single black hole since the 1970s, but the imposing mathematics of general relativity made doing so for a double black-hole system a much larger challenge. Over the last ten years, however, scientists have improved the accuracy of computer models that deal with these types of calculations in an effort to match observations from gravitational wave detectors like LIGO and VIRGO.

The research collaboration Simulating Extreme Spacetimes (SXS) has begun using these models to mimic the lensing effects of high-gravity systems involving objects such as neutron stars and black holes. In their most recent paper, the team imagines a camera pointing at a binary black hole system against a backdrop of the stars and dust of the Milky Way. One way to figure out what the camera would see in this situation would be to use general relativity to compute the path of each photon traveling from every light source at all points within the frame. This method, however, involves a nearly impossible number of calculations.  So instead, the researchers worked backwards, mapping only those photons that would reach the camera and result in a bright spot on the final image – that is, photons that would not be swallowed by either of the black holes.

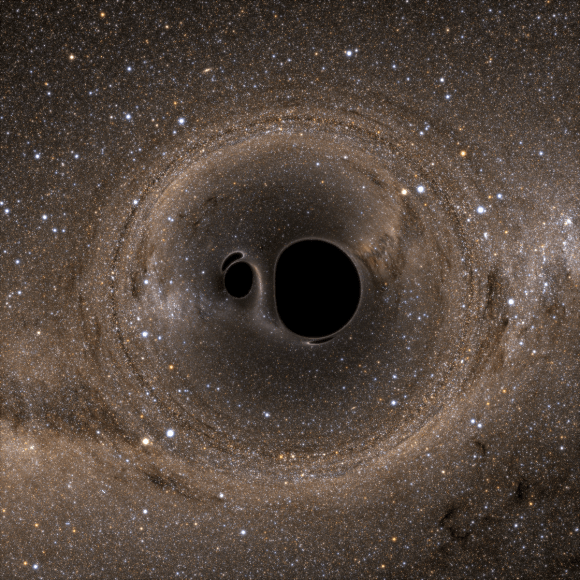
A binary black hole system, viewed from above. Image Credit: Bohn et al. (see http://arxiv.org/abs/1410.7775)
The same binary black hole system, viewed from above. Image Credit: Bohn et al. (see http://arxiv.org/abs/1410.7775)

As you can see in the image above, the team’s simulations testify to the enormous effect that these black holes have on the fabric of spacetime. Ambient photons curl into a ring around the converging binaries in a process known as frame dragging. Background objects appear to multiply on opposite sides of the merger (for instance, the yellow and blue pair of stars in the “northeast” and the “southwest” areas of the ring). Light from behind  the camera is even pulled into the frame by the black holes’ mammoth combined gravitational field. And each black hole distorts the appearance of the other, pinching off curved, comma-shaped regions of shadow called “eyebrows.” If you could zoom in with unlimited precision, you would find that there are, in fact, an infinite number of these eyebrows, each smaller than the last, like a cosmic set of Russian dolls.

In case you thought things couldn’t get any more amazing, SXS has also created two videos of the black hole merger: one simulated from above, and the other edge-on.


The SXS collaboration will continue to investigate gravitationally ponderous objects like black holes and neutron stars in an effort to better understand their astronomical and physical properties. Their work will also assist observational scientists as they search the skies for evidence of gravitational waves.

Check out the team’s ArXiv paper describing this work and their website for even more fascinating images.

NASA Aims To Slash Space Shipping Costs With Shiny 3-D Printer

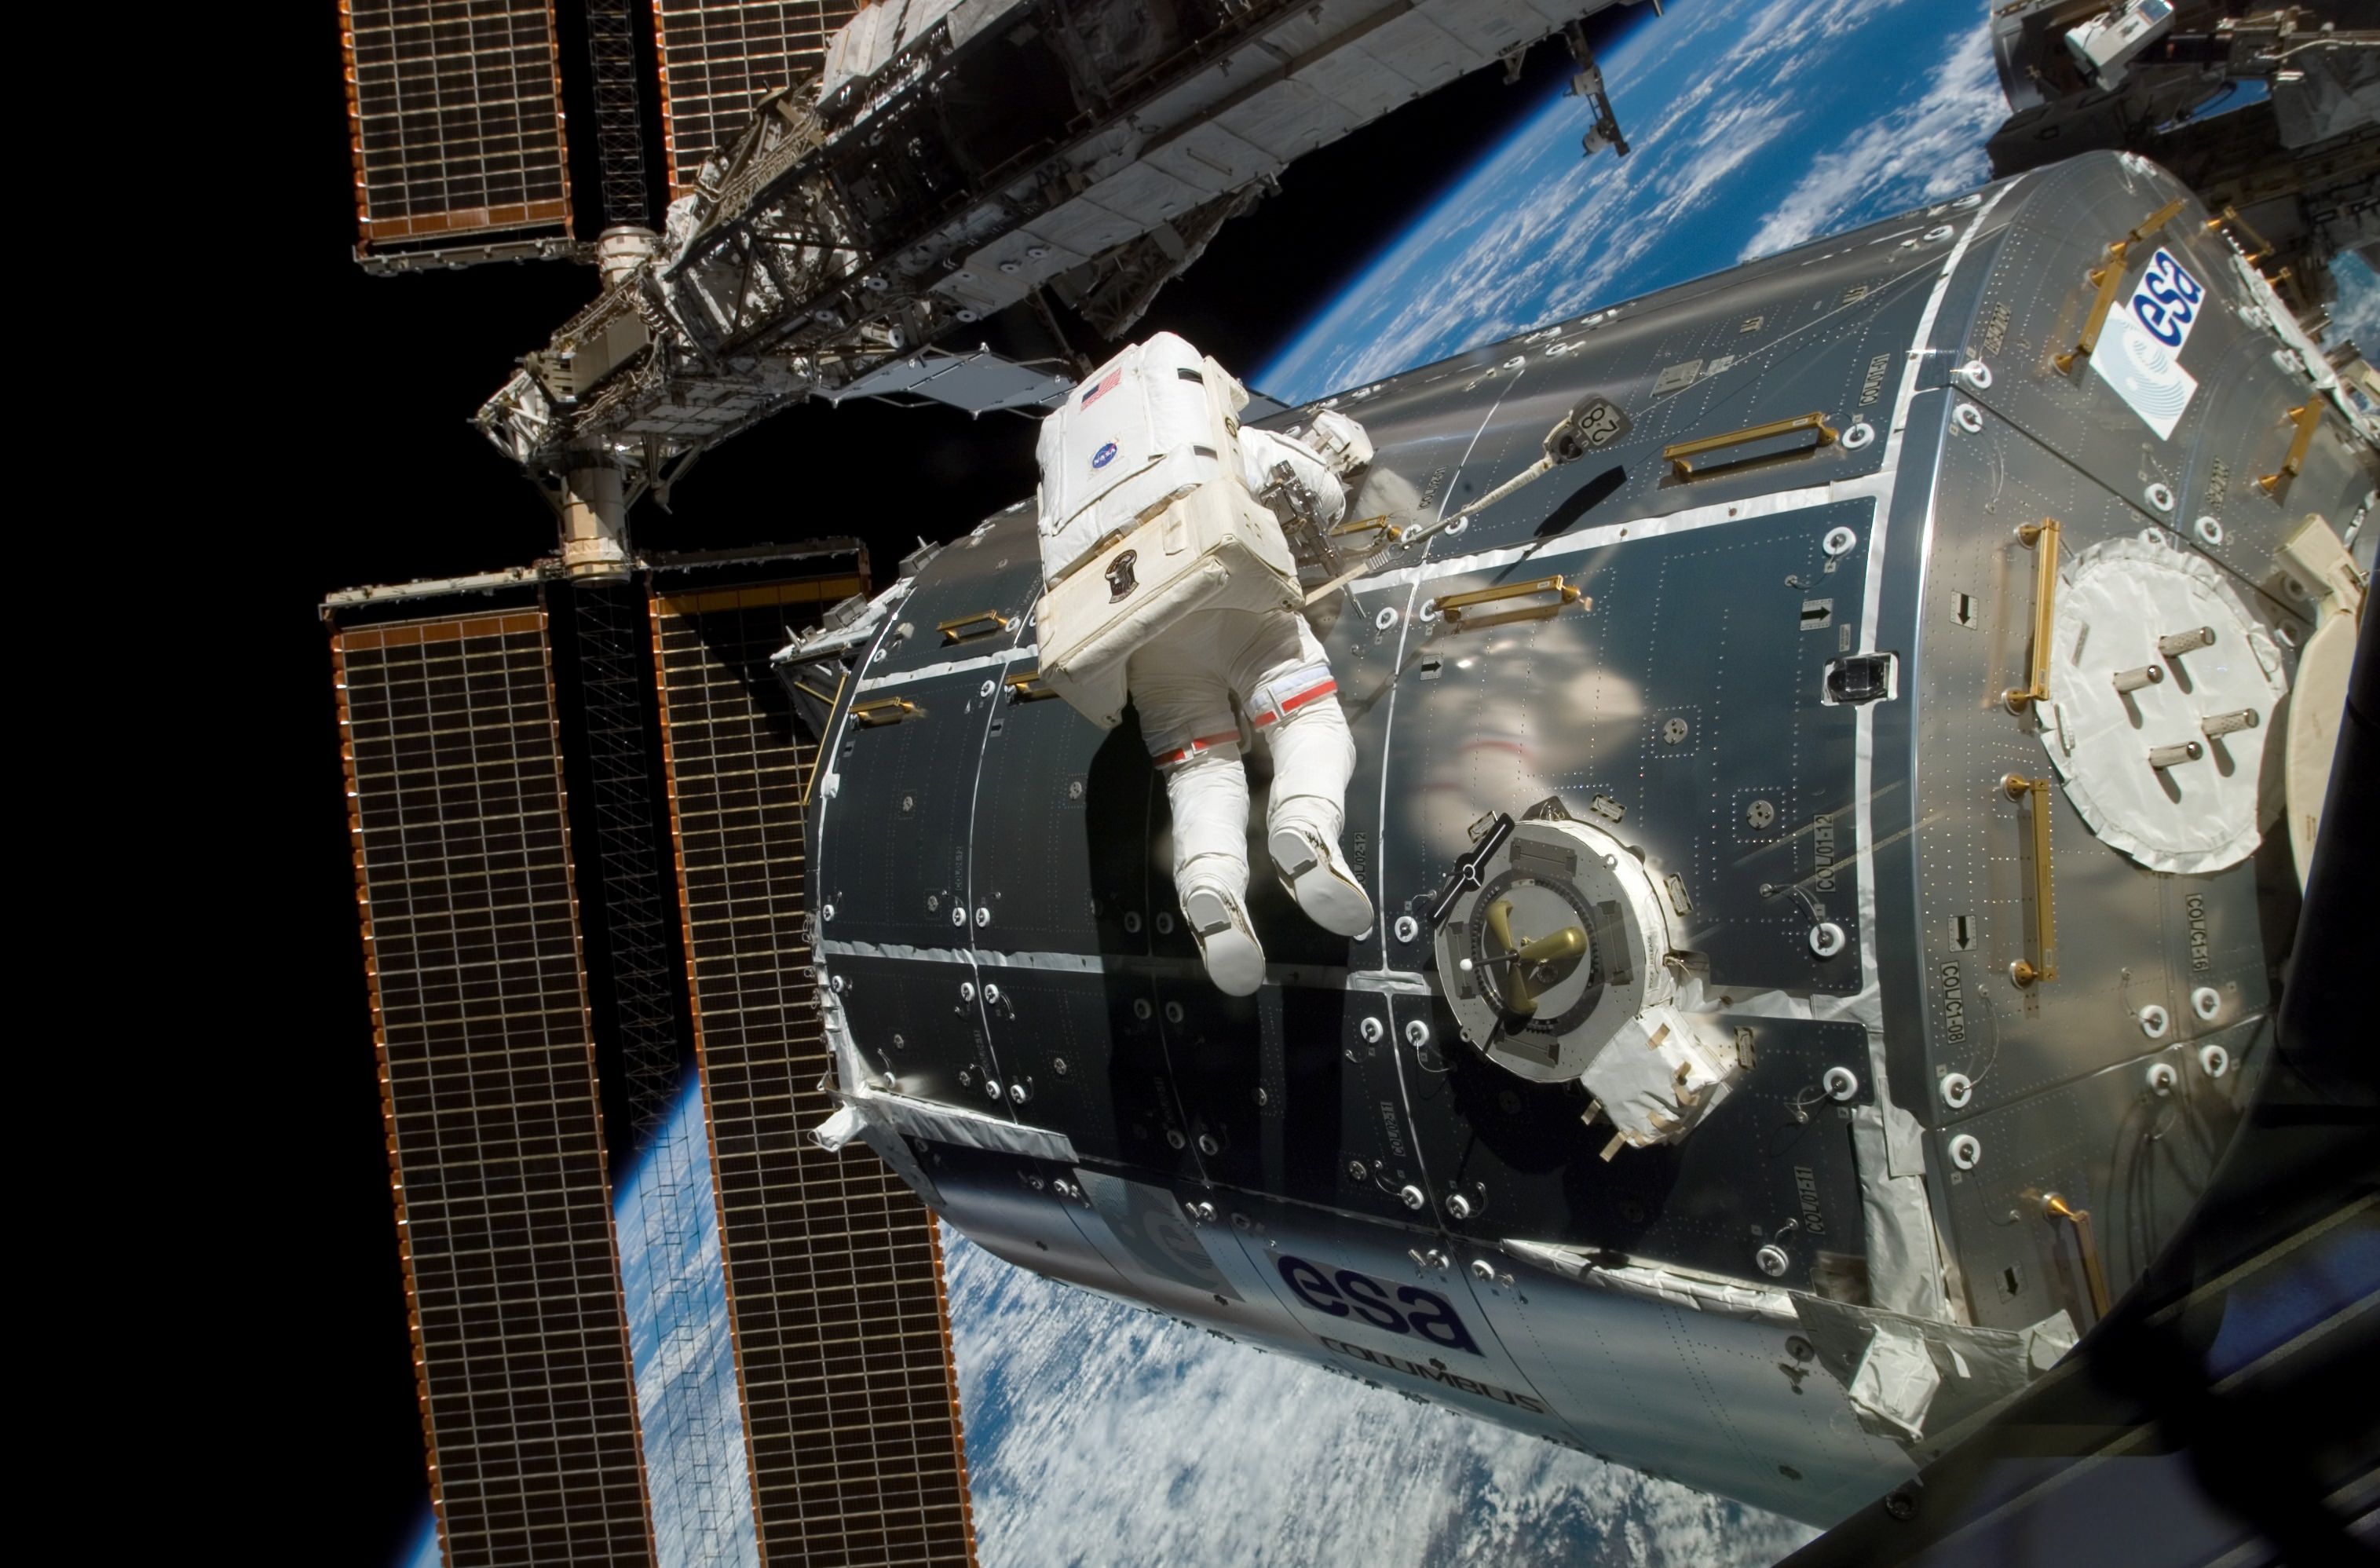
The Columbus module is installed on the International Space Station in 2008. Pictured is NASA astronaut Rex Walheim. Credit: NASA

Need a part on the International Space Station? You’re going to have to wait for that. That is, wait for the next spaceship to arrive with the critical tool to make a repair, or replace something that broke. You can imagine how that slows down NASA’s desire for science on the orbiting laboratory.

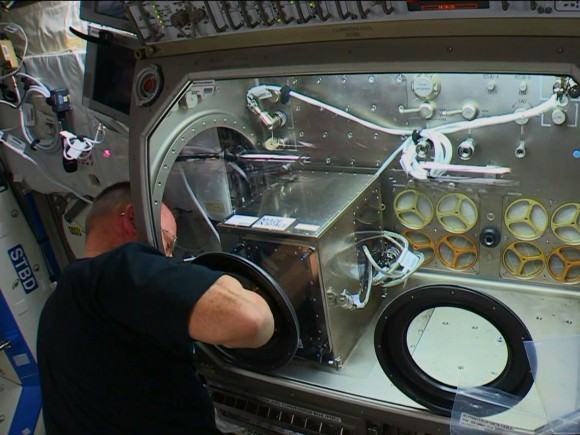
Enter the first orbiting “machine shop”: a 3-D printer that was just installed in the station’s Columbus laboratory this week. If the printer works as planned, astronauts will be able to make simple things based on instructions from the ground. Over time, the agency hopes this will save time and money, and reduce the need to rely on shipments from Earth. And keep an eye out in 2015: two other 3-D printers are scheduled to join it.

As NASA aims to send astronauts to an asteroid and perhaps to Mars, the need to manufacture parts on site is critical. Sending a valve to Phobos isn’t an easy proposition. Much better that future crews will make stuff on the spot, and NASA says the space station will be a good spot to test this kind of stuff out. Adding motivation is a National Research Council report from this summer urging NASA to start 3-D printing testing as soon as possible, since the station (as of yet) is only funded by all partners through 2020. Negotiations are ongoing to extend that to 2024.

In November 2014, NASA astronaut Butch Wilmore installed a 3-D printer made by Made in Space in the Columbus laboratory's Microgravity Science Glovebox on the International Space  Station. Credit: NASA TV
In November 2014, NASA astronaut Butch Wilmore installed a 3-D printer made by Made in Space in the Columbus laboratory’s Microgravity Science Glovebox on the International Space Station. Credit: NASA TV

“Additive manufacturing with 3-D printers will allow space crews to be less reliant on supply missions from Earth and lead to sustainable, self-reliant exploration missions where resupply is difficult and costly,” stated Jason Crusan, director of NASA’s advanced explorations systems division at NASA headquarters in Washington. “The space station provides the optimal place to perfect this technology in microgravity.”

But don’t get too excited yet; astronauts aren’t going to make screwdrivers right away. The first step will be calibrating the printer. Then, the first files (mainly test coupons) will be printed and sent back to Earth to make sure they meet up to standards compared to identical samples printed on the ground with the same printer.

Made In Space Inc. manufactured this printer (which arrived on station in September) with the aim of sending up a more advanced version in 2015. In a statement, the company said it is “gratified” that the printer is ready to go in space. Any science collected on it will inform the design of the new printer, “which will enable a fast and cost-effective way for people to get hardware to space,” the company added.

And guess what: there is yet another printer that will be launched to the space station next year. Called the POP3D Portable On-Board Printer, the European Space Agency promises that the tiny machine — less than half the diameter of a basketball — will be able to print a plastic part in about half an hour.

The prime contractor for this printer is Italian company Altran. POP3D will reach the station in the first half of next year, ideally while Italy’s Samantha Cristoforetti is still doing her Futura mission in space (which starts this Sunday, if the launch schedule holds.)

Iconic Kennedy Space Center Countdown Clock Retires

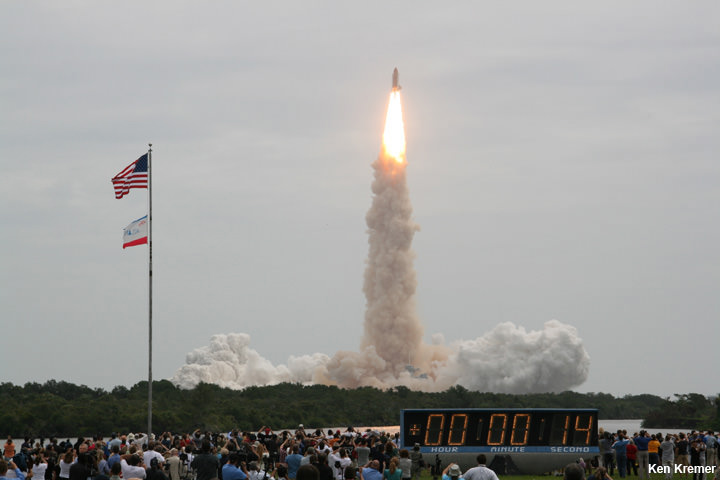
STS-135: Last launch using RS-25 engines that will now power NASA’s SLS deep space exploration rocket. NASA’s 135th and final shuttle mission takes flight on July 8, 2011 at 11:29 a.m. from the Kennedy Space Center in Florida bound for the ISS and the high frontier with Chris Ferguson as Space Shuttle Commander. Credit: Ken Kremer/kenkremer.com

Iconic Kennedy Space Center Countdown Clock seen here retires
NASA’s 135th and final shuttle mission takes flight on July 8, 2011 at 11:29 a.m. from the Kennedy Space Center in Florida bound for the ISS and the high frontier with Chris Ferguson as Space Shuttle Commander. Credit: Ken Kremer/kenkremer.com
Story updated and more photos[/caption]

In another sign of dramatically changing times since the end of NASA’s Space Shuttle program, the world famous Countdown Clock that ticked down to numerous blastoffs at the Kennedy Space Center Press Site and was ever present to billions of television viewers worldwide, has been retired.

Years of poor weather and decades of unforgiving time have visibly taken their toll on the iconic Countdown Clock beloved by space enthusiasts across the globe – as I have personally witnessed over years of reporting on launches from the KSC Press Site.

It was designed in the 1960s and has been counting down launches both manned and unmanned since the Apollo 12 moon landing mission in November 1969. And it continued through the final shuttle mission liftoff in July 2011 and a variety of unmanned NASA launches since then.

The countdown clock’s last use came just two months ago in September 2014 during the SpaceX CRS-4 launch to the ISS, which I attended along with the STS-135 launch.

The clock is located just a short walk away from another iconic NASA symbol – the Vehicle Assembly Building (VAB) – which assembled the Apollo/Saturn and Space Shuttle stacks for which it ticked down to blastoff. See photo below.

A new clock should be in place for NASA’s momentous upcoming launch of the Orion crew capsule on its inaugural unmanned test flight on Dec. 4, 2014.

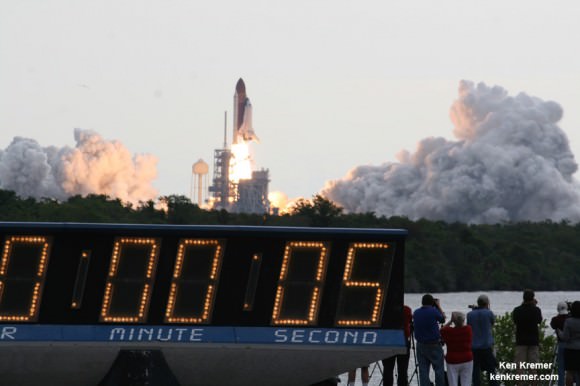
Space Shuttle Endeavour blasts off on her 25th and final mission from Pad 39 A on May 16, 2011 at 8:56 a.m. View from the world famous countdown clock at T Plus 5 Seconds. Credit: Ken Kremer – kenkremer.com

Because of its age, it has become harder to replace broken pieces.

“Maintaining the clock was becoming problematic,” NASA Press spokesman Allard Beutel told Universe Today.

It displays only time in big bold digits. But of course in this new modern digital era it will be replaced by one with a modern multimedia display, similar to the screens seen at sporting venues.

“The new clock will not only be a timepiece, but be more versatile with what we can show on the digital display,” Beutel told me.

The countdown clock is a must see for journalists, dignitaries and assorted visitors alike. Absolutely everyone, and I mean everyone !! – wants a selfie or group shot with it in some amusing or charming way to remember good times throughout the ages.

And of course, nothing beats including the countdown clock and the adjacent US flag in launch pictures in some dramatic way.

Indeed the clock and flag are officially called “The Press Site: Clock and Flag Pole” and are were listed in the National Register of Historic Places on Jan. 21, 2000.

The clock was officially powered down for the last time at 3:45 p.m. EDT on Nov. 19, 2014.

Famous KSC Press Site Countdown Clock and US Flag with VAB during SpaceX CRS-5 launch in September 2014. Credit: Ken Kremer – kenkremer.com
Famous KSC Press Site Countdown Clock and US Flag with VAB during SpaceX CRS-4 launch in September 2014. Credit: Ken Kremer – kenkremer.com

“The countdown clock at Kennedy’s Press Site is considered one of the most-watched timepieces in the world and may only be second in popularity to Big Ben’s Great Clock in London, England. It also has been the backdrop for a few Hollywood movies,” noted a NASA press release announcing the impending shutdown of the iconic clock.

“It is so absolutely unique — the one and only — built for the world to watch the countdown and launch,” said Timothy M. Wright, IMCS Timing, Countdown and Photo Services. “From a historical aspect, it has been very faithful to serve its mission requirements.”

The famous landmark stands nearly 6 feet (70 inches) high, 26 feet (315 inches) wide is 3 feet deep and sits on a triangular concrete and aluminum base.

Each numerical digit (six in all) is about 4 feet high and 2 feet wide. Each digit uses 56 40-watt light bulbs, the same ones found at the local hardware store. There are 349 total light bulbs in the clock, including the +/- sign (nine) and pair of colons (four), according to a NASA statement.

The new clock will be about the same size.

Fortunately for space fans, there is some good news!

The Countdown Clock will be moved to the nearby Kennedy Space Center Visitor Complex (KSCVC) and placed on permanent display for public viewing.

Details soon!

Space Shuttle Discovery awaits blast off on her final mission from Pad 39 A on the STS-133 mission, its 39th and final flight to space on February 24, 2011.  Prelaunch twilight view from the countdown clock at the KSC Press Site. Credit: Ken Kremer – kenkremer.com
Space Shuttle Discovery awaits blast off on her final mission from Pad 39 A on the STS-133 mission, its 39th and final flight to space on February 24, 2011. Prelaunch twilight view from the countdown clock at the KSC Press Site. Credit: Ken Kremer – kenkremer.com

Stay tuned here for Ken’s continuing Earth and Planetary science and human spaceflight news.

Ken Kremer

With Philae Delivered, Rosetta Will Play ‘Comet Escort’ Through 2015

The Rosetta spacecraft takes a selfie Oct. 7 with its target, 67P/Churyumov–Gerasimenko, from an altitude of about 9.9 miles (16 kilometers). Credit: ESA/Rosetta/Philae/CIVA

With the Philae mission down on the comet and preliminary science results coming from its brief science surge on the surface, little has been said about the delivery vehicle. But while Philae is in hibernation, the Rosetta spacecraft remains quietly in orbit around Comet 67P/Churyumov–Gerasimenko for what will prove to be a dramatic 2015.

Should the orbiter remain healthy, it will be the first to be a “comet escort” — to watch a comet changing from up close as the celestial body draws closer to the Sun. And to stay out of the debris field, Rosetta will have some fancy footwork to perform in the next few months, says the European Space Agency (ESA).

“Burns” with the comet are planned on Saturday (Nov. 22) and Wednesday (Nov. 26) to bring it up about 30 kilometers (19 miles) above, and then it will scoot down closer to about 20 kilometers (12.5 miles) on Dec. 3. Rosetta will remain in this orbit for a while to look at the comet’s nucleus, as well as to measure plasma, dust and gas that is expected to increase as the comet gets closer to the Sun.

Rosetta will stay as close to 67P as possible, but if activity heats up to an unacceptable risk, it will jump to a “high-activity” trajectory that will keep it away from the worst of the debris. And it’s also going to keep an ear out for Philae, just in case more sunlight on the comet ends up recharging the hibernating lander’s battery. “Early next year, Rosetta will be switched into a mode that allows it to listen periodically for beacon signals from the surface.,” ESA wrote.

There has been some discussion about the magnitude of Philae’s success given that it did land on the comet as planned, but the harpoons (which had travelled a decade in space at that point) did not fire on to the surface as planned. This meant that the lander drifted for about two hours before settling far from its prime landing spot, mostly outside of the sunlight it needs to recharge its batteries.

But in a science marathon, researchers got as much as they could out of the instruments and have already released preliminary results, such as how the sound of Philae’s landing revealed the comet’s interior structure, and the discovery of organic materials on the surface.

Source: European Space Agency