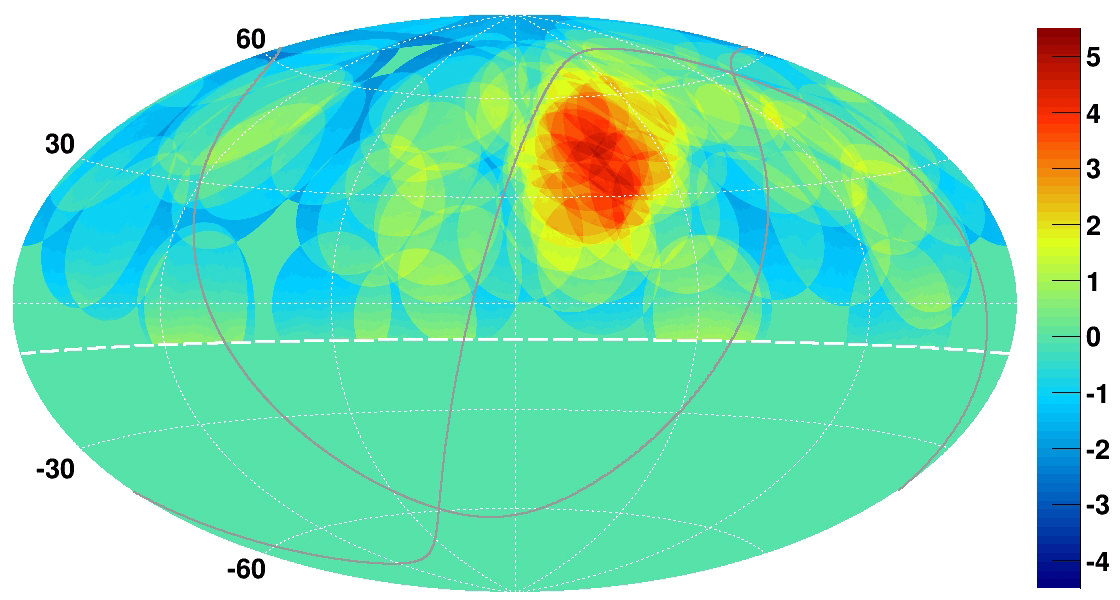
A map of cosmic ray concentrations in the northern sky, showing a "hotspot" (red) in the location of the Big Dipper. Credit: K. Kawata, University of Tokyo Institute for Cosmic Ray Research
Behind the Big Dipper is something pumping out a lot of extremely high-energy cosmic rays, a new study says. And as astronomers try to learn more about the nature of these emanations — maybe black holes, maybe supernovas — newer work hints that it could be related to how the universe is structured.
It appears that the particles come from spots in the cosmos where matter is densely packed, such as in “superclusters” of galaxies, the researchers stated, adding this is promising progress for tracking down the source of the cosmic rays.
“This puts us closer to finding out the sources – but no cigar yet,” stated University of Utah physicist Gordon Thomson, co-principal investigator for the Telescope Array that performed the observations. “All we see is a blob in the sky, and inside this blob there is all sorts of stuff – various types of objects – that could be the source,” he added. “Now we know where to look.”
The study examined the highest-energy cosmic rays that are about 57 billion billion electron volts (5.7 times 10 to the 19th power), picking that type because it is the least affected by magnetic field lines in space. As cosmic rays interact with the magnetic field lines, it changes their direction and thus makes it harder for researchers to figure out where they came from.
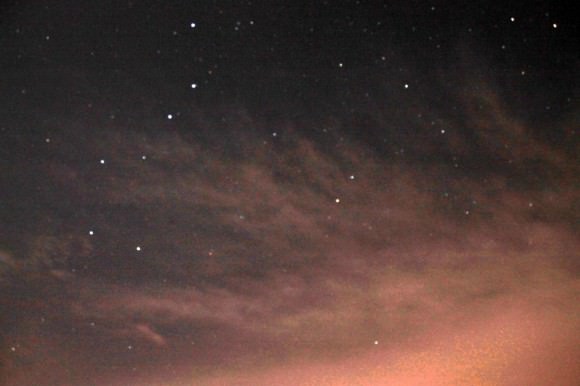
Ursa Major and Big Dipper Among the Red Clouds. Credit: Rajat Sahu
Scientists used a set of 500 detectors called the Telescope Array, which is densely packed in a 3/4 mile (1.2 kilometer) square grid in the desert area of Millard County, Utah. The array recorded 72 cosmic rays between May 11, 2008 and May 4, 2013, with 19 of those coming from the “hotspot” — a circle 40 degrees in diameter taking up 6% of the sky. (Researchers are hoping for funding for an expansion to probe this area in more detail.)
It’s possible the hotspot could be a fluke, but not very possible, the researchers added: there’s a 1.4 in 10,000 chance. And they’re keeping themselves open to many types of sources: “Besides active galactic nuclei and gamma ray emitters, possible sources include noisy radio galaxies, shock waves from colliding galaxies and even some exotic hypothetical sources such as the decay of so-called ‘cosmic strings’ or of massive particles left over from the big bang that formed the universe 13.8 billion years ago,” the researchers stated.
Cosmic rays were first discovered in 1912 and are believed to be hydrogen nuclei or the centers of nuclei from heavier elements like iron or oxygen. The highest-energy ones in the study may come from protons alone, but that’s not clear yet.
An artist's conception of a supermassive black hole's jets. Credit: NASA / Dana Berry / SkyWorks Digital
The supermassive black holes in the cores of most massive galaxies wreak havoc on their immediate surroundings. During their most active phases — when they ignite as luminous quasars — they launch extremely powerful and high-velocity outflows of gas.
These outflows can sweep up and heat material, playing a pivotal role in the formation and evolution of massive galaxies. Not only have astronomers observed them across the visible Universe, they also play a key ingredient in theoretical models.
But the physical nature of the outflows themselves has been a longstanding mystery. What physical mechanism causes gas to reach such high speeds, and in some cases be expelled from the galaxy?
A new study provides the first direct evidence that these outflows are accelerated by energetic jets produced by the supermassive black hole.
Using the Very Large Telescope in Chile, a team of astronomers led by Clive Tadhunter from Sheffield University, observed the nearby active galaxy IC 5063. At locations in the galaxy where its jets are impacting regions of dense gas, the gas is moving at extraordinary speeds of over 600,000 miles per hour.
“Much of the gas in the outflows is in the form of molecular hydrogen, which is fragile in the sense that it is destroyed at relatively low energies,” said Tadhunter in a press release. “I find it extraordinary that the molecular gas can survive being accelerated by jets of highly energetic particles moving at close to the speed of light.
As the jets travel through the galactic matter, they disrupt the surrounding gas and generate shock waves. These shock waves not only accelerate the gas, but also heat it. The team estimates the shock waves heat the gas to temperatures high enough to ionize the gas and dissociate the molecules. Molecular hydrogen is only formed in the significantly cooler post-shock gas.
“We suspected that the molecules must have been able to reform after the gas had been completely upset by the interaction with a fast plasma jet,” said Raffaella Morganti from the Kapteyn Institute Groningen University. “Our direct observations of the phenomenon have confirmed that this extreme situation can indeed occur. Now we need to work at describing the exact physics of the interaction.”
In interstellar space, molecular hydrogen forms on the surface of dust grains. But in this scenario, the dust is likely to have been destroyed in the intense shock waves. While it is possible for molecular hydrogen to form without the aid of dust grains (as seen in the early Universe) the exact mechanism in this case is still unknown.
The research helps answer a longstanding question — providing the first direct evidence that jets accelerate the molecular outflows seen in active galaxies — and asks new ones.
A portion of a 2014 Mars map showing the area east of Hellas basin, at midsoutherly latitudes. Credit: USGS
Where did the water on Mars come from, and where did it go? This plot (sort of) formed the basis of one of the best Doctor Who episodes of the modern era, but in all seriousness, it is also driving scientists to examine the Red Planet over and over again.
This means revisiting older information with newer data to see if everything still matches up. From time to time, it doesn’t. The latest example came when scientists at the U.S. Geological Survey created a map of the canyon systems of Waikato Vallis and Reull Vallis, which are in the midsoutherly latitudes of Mars.
They previously believed the canyons were connected, but updating the data from an understanding based on 1980s Viking data revealed a different story.
“These canyons are believed to have formed when underground water was released from plains materials to the surface, causing the ground to collapse. The water could have been stored within the plains in localized aquifers or as ice, which could have melted due to the heat from nearby volcanoes,” the U.S. Geological Survey stated.
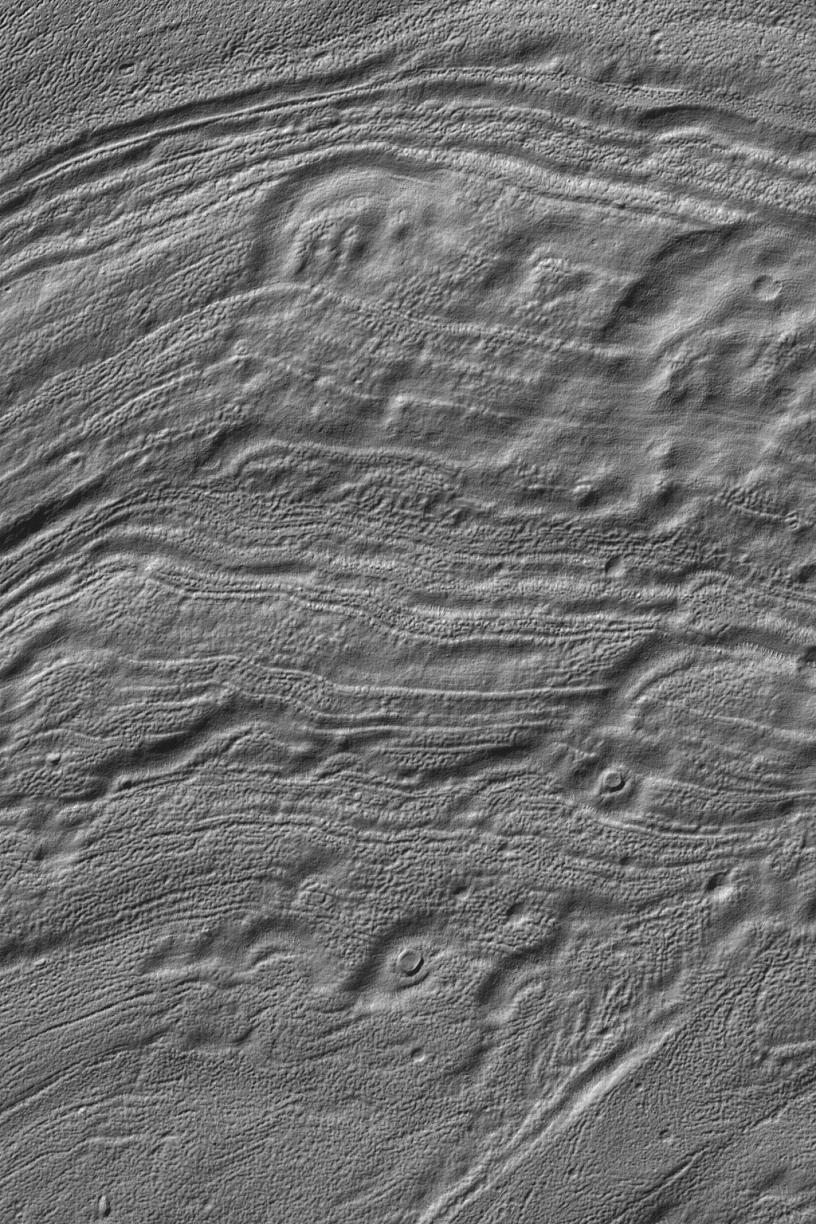
Part of the floor of Reull Vallis, a valley east of Hellas Basin on Mars. Picture taken by Mars Global Surveyor. Credit: NASA/JPL/Malin Space Science Systems
But the newer data — looking at information from the Mars Reconnaissance Orbiter, Mars Odyssey, Mars Global Surveyor — revealed the canyons are quite separate, demarcated by a zone called Eridania Planitia in between.
“Careful estimates of the ages of the canyons and the plains reveal a sequence of events starting with the water released from Waikato Vallis, which would have been stored for a time in the plains as a shallow lake. As Reull Vallis was forming separately, the canyon breached a crater rim that was holding back the water in the lake; the lake drained gradually, which can be seen by many smaller channels incised on the floor of Reull Vallis.”
The map was co-produced by Scott Mest and David Crown, who are both of the Planetary Science Institute. You can view the entire map and related materials here.
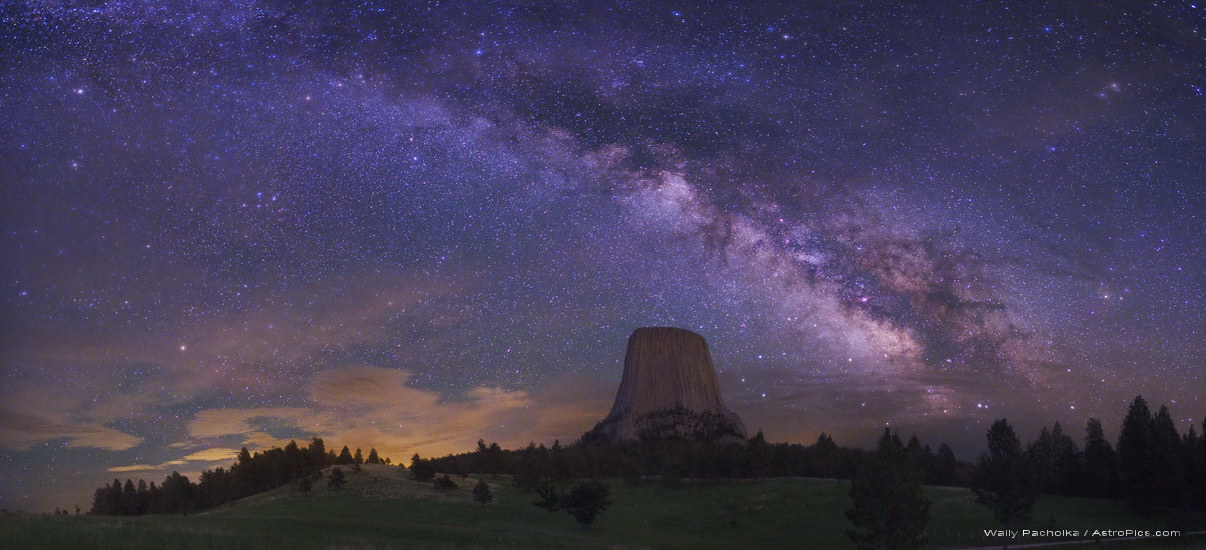
The Milky Way as seen from Devil's Tower, Wyoming. Image Credit: Wally Pacholka
There are few moments more breathtaking than standing beneath a brilliant starry sky. Thousands of small specks of light mark only the beginning of the vast cosmic arena, with its unimaginable vistas of time and space. The Milky Way, wrapping above in a cosmic sheet of colors and patterns, also hints that there’s more than meets the eye.
Most of us long for these dark nights, far away from the city lights. But a new study suggests the Universe is a little too dark.
The vast reaches of empty space are bridged by filaments of hydrogen and helium. But there’s a disconnect between how bright the large-scale structure of the Universe is expected to be and how bright it actually is.
In a recent study, a team of astronomers led by Juna Kollmeier from the Carnegie Institute for Science found the light from known populations of stars and quasars is not nearly enough to explain observations of intergalactic hydrogen.
In a brightly lit Universe, intergalactic hydrogen will be easily destroyed by energetic photons, meaning images of the large-scale structure will actually appear dimmer. Whereas in a dim Universe, there are fewer photons to destroy the intergalactic hydrogen and images will appear brighter.
Hubble Space Telescope observations of the large-scale structure show a brightly lit Universe. But supercomputer simulations using only the known sources of ultraviolet light produces a dimly lit Universe. The difference is a stunning 400 percent.
Computer simulations of intergalactic hydrogen in a “dimly lit” universe (left) and a “brightly lit” universe (right) that has five times more of the energetic photons that destroy neutral hydrogen atoms. Image Credit: Ben Oppenheimer / Juna Kollmeier.
Observations indicate that the ionizing photons from hot, young stars are almost always absorbed by gas in the host galaxy, so they never escape to affect intergalactic hydrogen. The necessary culprit could be the known number of quasars, which is far lower than needed to produce the required light.
“Either our accounting of the light from galaxies and quasars is very far off, or there’s some other major source of ionizing photons that we’ve never recognized,” said Kollmeier in a press release. “We are calling this missing light the photon underproduction crisis. But it’s the astronomers who are in crisis — somehow or other, the universe is getting along just fine.”
Strangely, this mismatch only appears in the nearby, relatively well-studied cosmos. In the early Universe, everything adds up.
“The simulations fit the data beautifully in the early universe, and they fit the local data beautifully if we’re allowed to assume that this extra light is really there,” said coauthor Ben Oppenheimer from the University of Colorado. “It’s possible the simulations do not reflect reality, which by itself would be a surprise, because intergalactic hydrogen is the component of the Universe that we think we understand the best.”
So astronomers are attempting to shed light on the missing light.
“The most exciting possibility is that the missing photons are coming from some exotic new source, not galaxies or quasars at all,” said coauthor Neal Katz from the University of Massachusetts at Amherst.
The team is exploring these new sources with vigor. It’s possible that there could be an undiscovered population of quasars in the nearby Universe. Or more exotically, the photons could be created from annihilating dark matter.
“The great thing about a 400 percent discrepancy is that you know something is really wrong,” said coauthor David Weinberg from Ohio State University. “We still don’t know for sure what it is, but at least one thing we thought we knew about the present day universe isn’t true.”
The results were published in The Astrophysical Journal Letters and are available online.
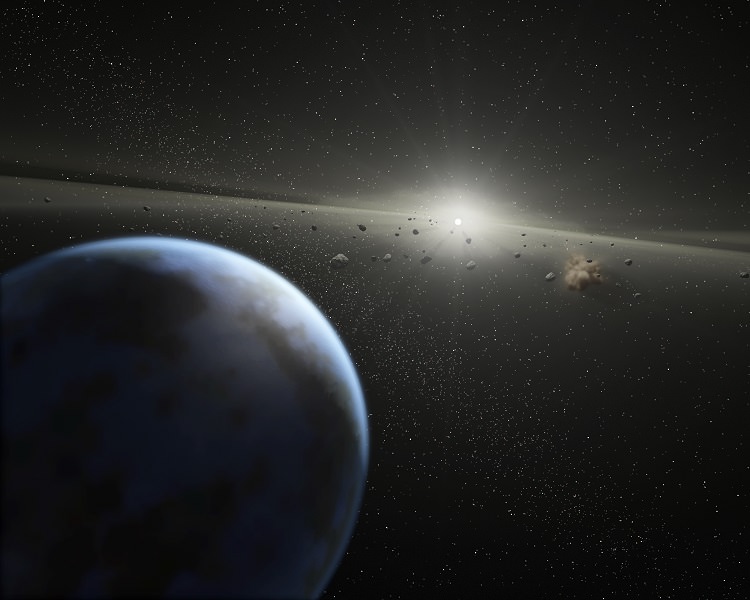
Artist’s impression of a massive asteroid belt in orbit around a star. Earth's water may not have all come from asteroids and comets, so maybe that's true for exoplanets. Credit: NASA-JPL / Caltech / T. Pyle (SSC)
As readers of Universe Today know, exoplanets are one of the hottest topics in astronomy today. In just the past six months, astronomers have announced the discovery of more than 700 planets orbiting other stars, bringing the total to more than 1700. These discoveries include the first Earth-size planet found in what’s called the habitable zone of a star, where liquid water could exist; the oldest known planet that could support life; and the first rocky “mega-Earth,” a planet that’s much like Earth except that it’s 17 times more massive.
On July 9, at 19:00 UTC (3 pm EDT, 12:00 pm PDT), three exoplanet hunters will come together discuss the discovery boom, consider the next steps in the hunt for habitable worlds, and debate whether we’re likely to find alien life in the next decade.
You can watch live (or watch the webcast later) below:
The panel includes MIT’s Zachory Berta-Thompson, Stanford’s Bruce Macintosh and Université de Montréal’s Marie-Eve Naud) will come together discuss the recent discovery boom, consider the next steps in the hunt for habitable worlds, and ponder the odds of finding life on another planet. The discussion will be moderated by journalist Kelen Tuttle.
To submit questions ahead of time or during the webcast, send an email to [email protected] or post on Twitter with hashtag #KavliLive. You can find additional information about the webcast and the Kavli Foundation here.
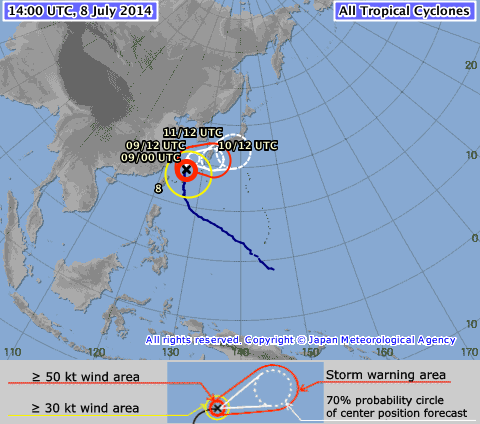
“Watch Out Japan!” added Gerst while he and his crewmates working aboard the ISS send back breathtaking imagery of the gigantic super typhoon heading towards Japan.
Neoguri is currently lashing the Japanese island of Okinawa with powerful damaging winds of over 125 mph and heavy downpours of flooding rain.
The Joint Typhoon Warning Center or JTWC reports that Neoguri is creating large and dangerous swells with wave heights to 37 feet (11.2 meters).
CNN reports today, July 8, that over 600,000 people have been told to evacuate and over 100,000 already have no power. Gusts have reached 212 kph (132 mph),
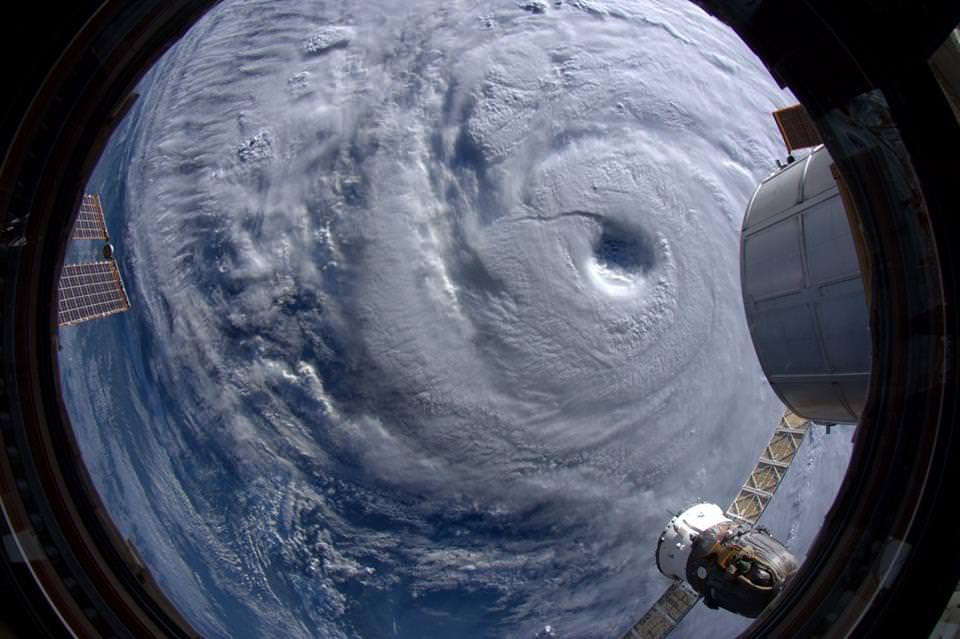
“Supertyphoon Neoguri did not even fit into our fisheye lens view. I have never seen anything like this.” Taken from the ISS on 8 July 2014. Credit: ESA/NASA/Alexander Gerst
The storm is so big it could not even be captured in a single image taken today using the astronauts fisheye lens on the ISS.
“Supertyphoon Neoguri did not even fit into our fisheye lens view. I have never seen anything like this,” reports Gerst today, July 8.
And the worst may be yet to come as Neoguri is forecast to make landfall on Kyushu, the southernmost island of the Japanese mainland and home to more than 13 million people after 0000 UTC on July 10 (8 p.m. EDT on July 9).
Super Typhoon Neoguri formed in the western Pacific Ocean south-southeast of Guam on July 3, 2014, according to NASA.
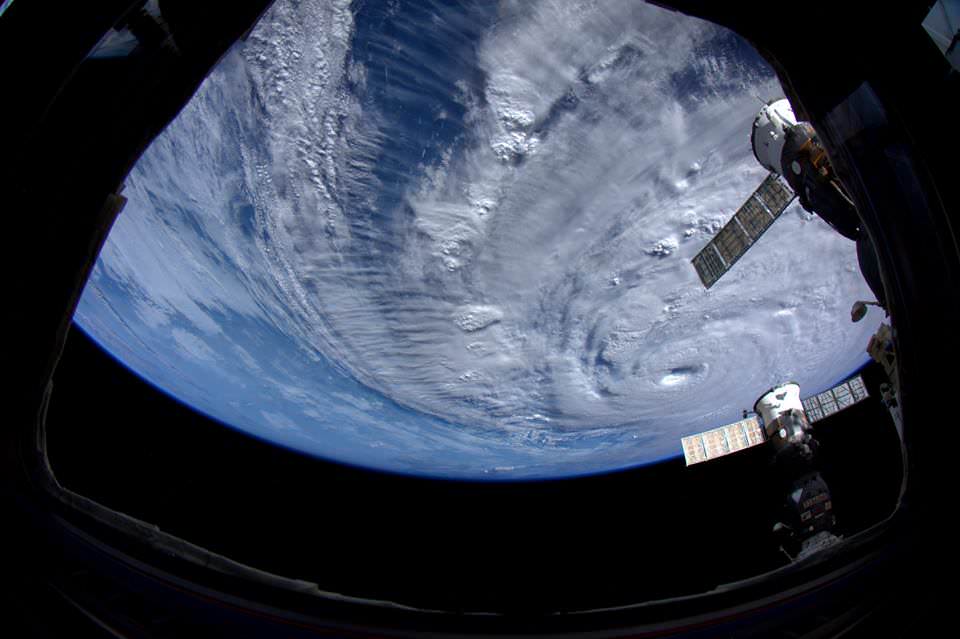
ISS above Supertyphoon Neoguri. Taken from the ISS on 7 July 2014. Credit: ESA/NASA/Alexander Gerst
By July 5 it had maximum sustained winds near 110 knots (127 mph).
The NASA and Japan Aerospace Exploration Agency’s Tropical Rainfall Measuring Mission or TRMM satellite passed over the typhoon on Monday, July 7. It was classified as a category four typhoon on the Saffir-Simpson hurricane scale with sustained winds estimates at 135 knots (155 mph), says NASA.
The eerie looking eye is 65 kilometers (40 miles) in diameter. See photo.
“Scary. The sunlight is far from reaching down the abyss of Neoguri’s 65 km-wide eye.” Taken from the ISS on 8 July 2014. Credit: ESA/NASA/Alexander Gerst
It has since decreased slightly in intensity to a category three typhoon.
According to the Japanese Meteorological Agency Neoguri is currently located at 28°55′ (N) and E125°50′ (E).
At 5:02 PM EDT today, July 8, NASA just reported that the ISS flew directly over Neoguri and may have been visible in the new live HDEV cameras residing on the stations truss.
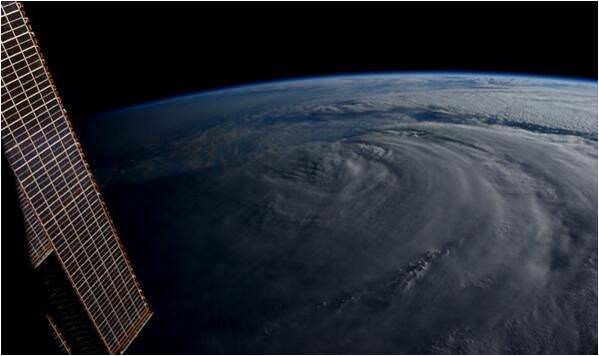
“Neoguri has been literally cut in half. Unreal.” Taken from the ISS on 8 July 2014. Credit: NASA/Reid Wiseman
Stay tuned here for Ken’s continuing ISS, OCO-2, GPM, Curiosity, Opportunity, Orion, SpaceX, Boeing, Orbital Sciences, MAVEN, MOM, Mars and more Earth & Planetary science and human spaceflight news.
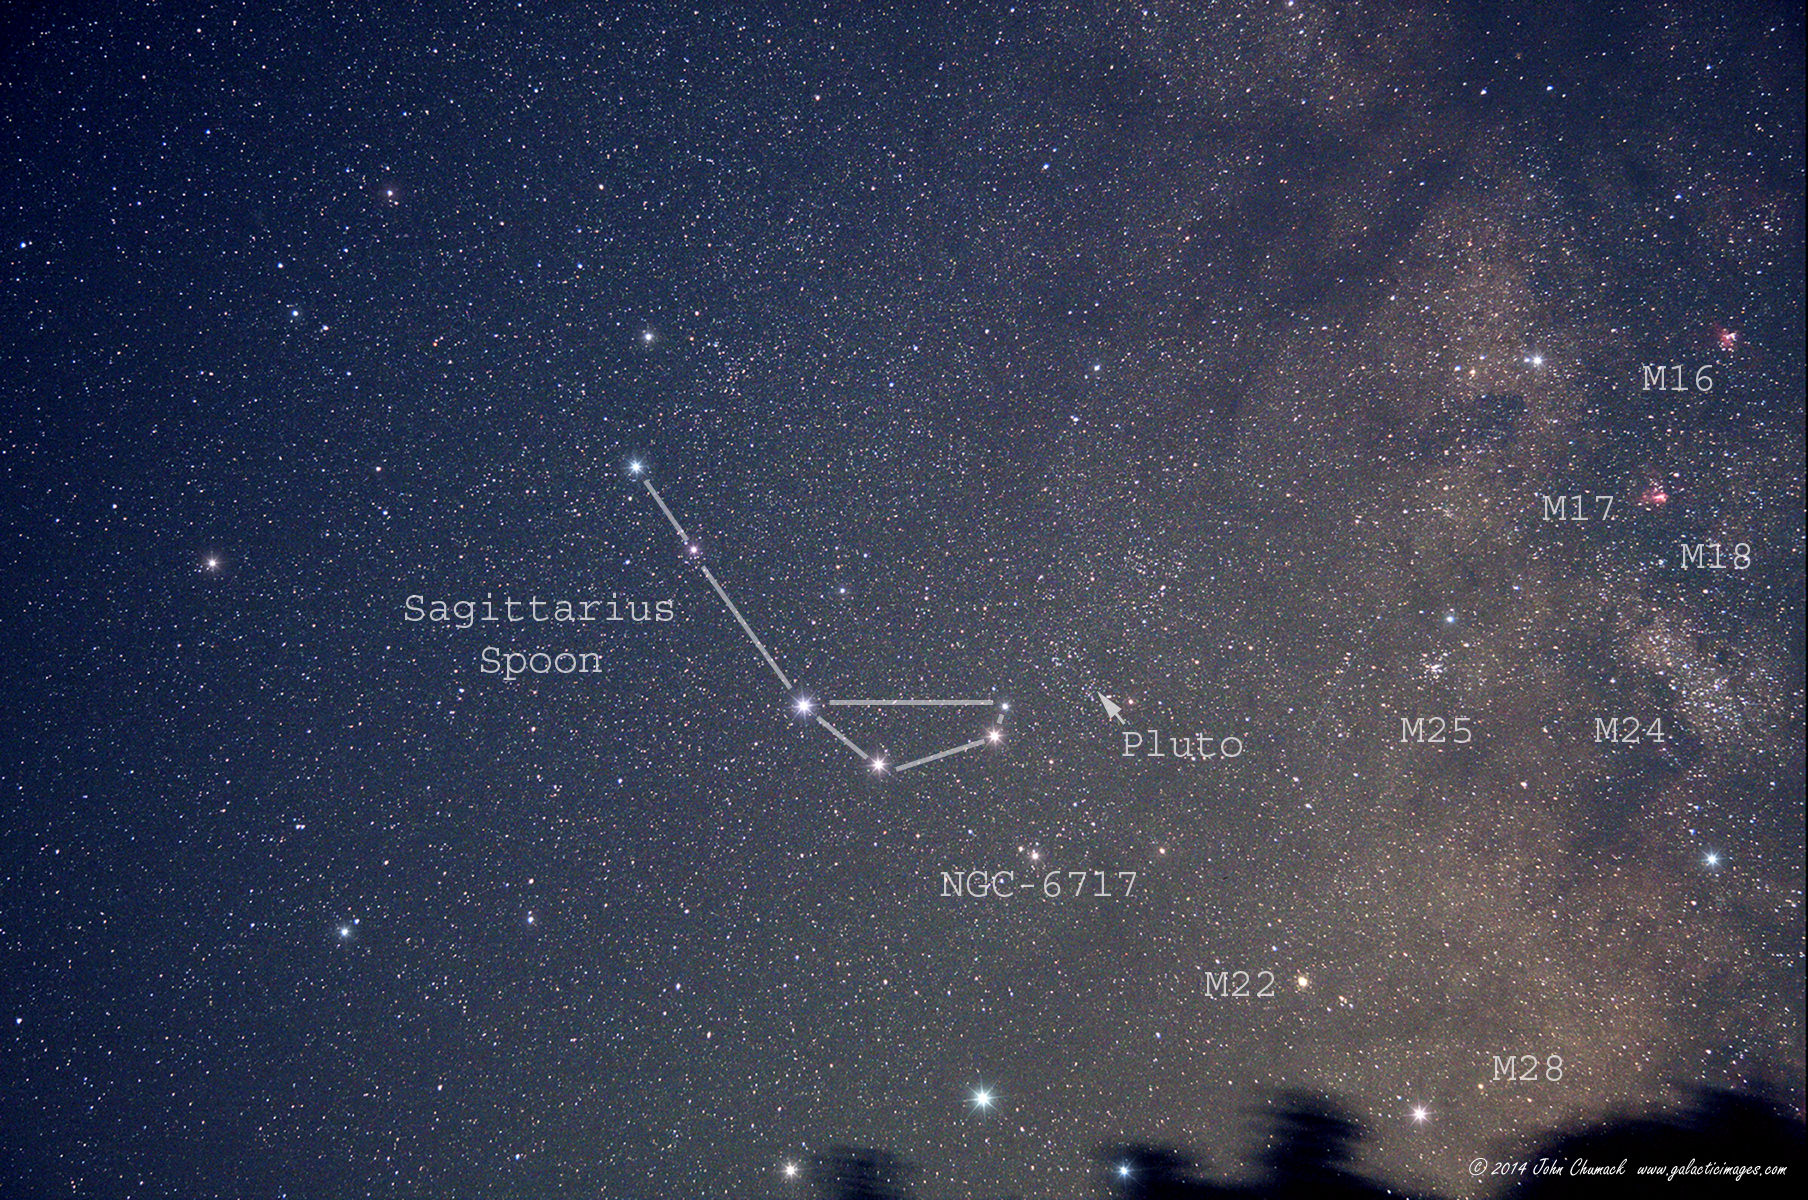
The Sagittarius Spoon with dwarf planet Pluto (14.1 Mag) crossing the star fields of Sagittarius.
The arrow points to the location of Pluto. Image taken from Dexter, Iowa on June 29, 2014 around 3:50 am local time. Credit and copyright: John Chumack.
Last week, we encouraged those of you with a decent sized backyard telescope (and a little patience) to try and spot tiny dwarf planet Pluto, which was at opposition over this past weekend.
One of our favorite astrophotographers, John Chumack, did just that using the “Sagittarius Spoon” to zero-in on Pluto’s location.
“Most astronomers are familiar with the Great Tea Pot of Sagittarius, but just above the Teapot’s Handle is the Sagittarius Spoon!” John said via email. His annotated image, above, shows the spoon and the arrow points to Pluto.
See a non-annotated version, below, and try to also spot some very familiar deep sky objects in this field of view:
A non-annotated version of the Sagittarius Spoon and Pluto on 06-29-2014 from Dexter, Iowa. Credit and copyright: John Chumack.
Can you see:
Globular Clusters M22, M28, NGC-6717
Open Star Clusters M25, M18
Emission Nebulae M17 The Swan or Omega Nebula & M16 The Eagle Nebula
M24 The Sagittarius Star Cloud, (also awesome in binoculars, John says)
John used a modified Canon 40D DSLR & 50mm lens @F5.6, ISO 1600 for a Single 4 minute exposure while tracking on a CG-4 Mount. And friends from Dexter, Iowa provided the view!
Update:
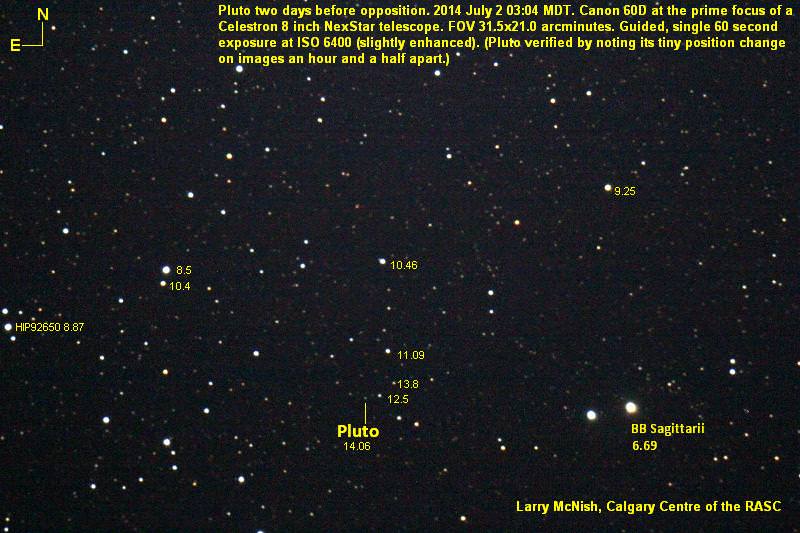
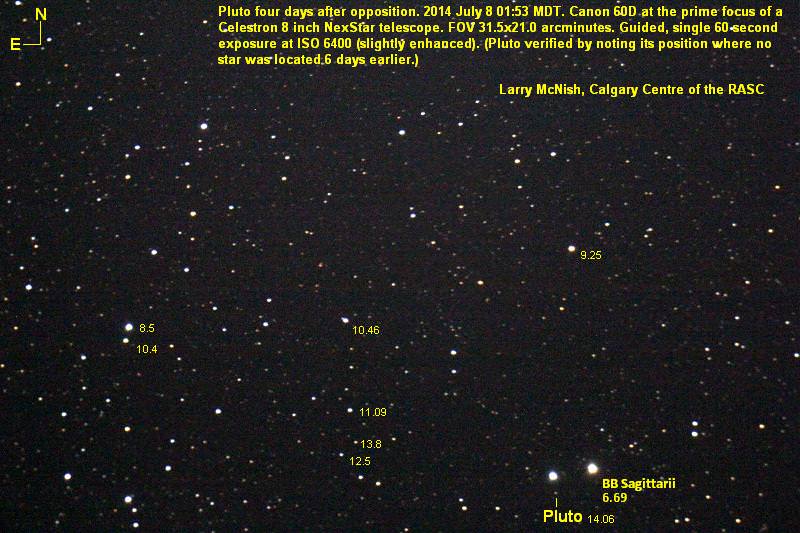
Larry McNish from the Calgary Centre of the Royal Astronomical Society of Canada also sent in two images of Pluto at opposition. All the details are on the images, but they emphasize just how difficult capturing Pluto can be:
Pluto two days before opposition on July 2, 2014. Credit and copyright: Larry McNish, Calgary Centre of the Royal Astronomical Society of Canada.Pluto, four days after opposition on July 8, 2014. Credit and copyright: Larry McNish, Calgary Centre of the Royal Astronomical Society of Canada.
Want to get your astrophoto featured on Universe Today? Join our Flickr group or send us your images by email (this means you’re giving us permission to post them). Please explain what’s in the picture, when you took it, the equipment you used, etc.
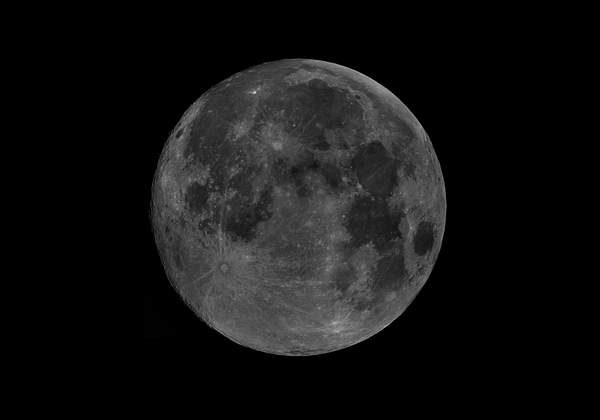
The perigee Full Moon of June 22nd, 2013. Credit: Russell Bateman (@RussellBateman1)
‘Tis the season once again, when rogue Full Moons nearing perigee seem roam the summer skies to the breathless exhortations of many an astronomical neophyte at will. We know… by now, you’d think that there’d be nothing new under the Sun (or in this case, the Moon) to write about the closest Full Moons of the year.
But love ‘em or hate ‘em, tales of the “Supermoon” will soon be gracing ye ole internet again, with hyperbole that’s usually reserved for comets, meteor showers, and celeb debauchery, all promising the “biggest Full Moon EVER…” just like last year, and the year be for that, and the year before that…
How did this come to be?
What’s happening this summer: First, here’s the lowdown on what’s coming up. The closest Full Moon of 2014 occurs next month on August 10th at 18:11 Universal Time (UT) or 1:44 PM EDT. On that date, the Moon reaches perigee or its closest approach to the Earth at 356,896 kilometres distant at 17:44, less than an hour from Full. Of course, the Moon reaches perigee nearly as close once everyanomalistic month (the time from perigee-to-perigee) of 27.55 days and passes Full phase once every synodic period (the period from like phase to phase) with a long term average of 29.53 days.
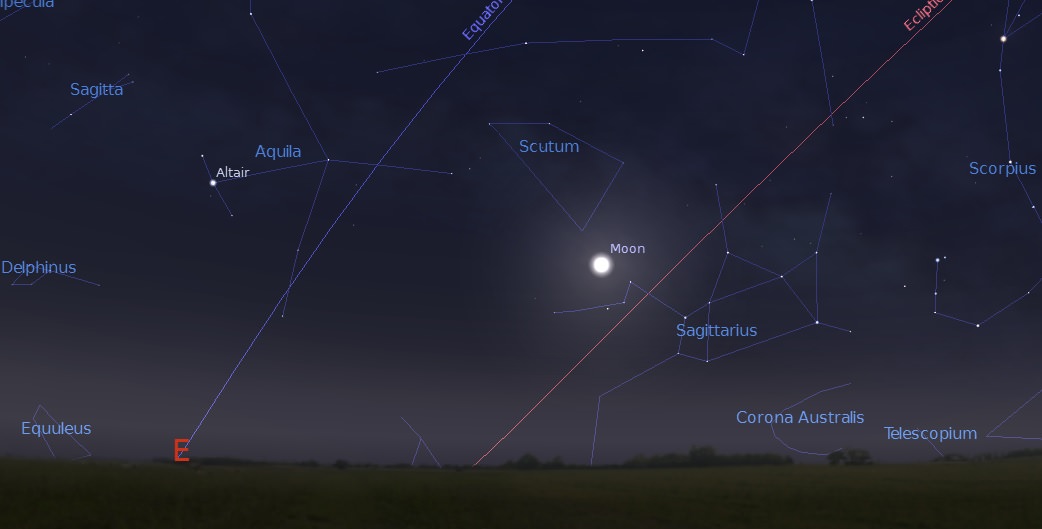
Moon rise on the evening of July 11th, 2014 as seen from latitude 30 degrees north. Credit: Stellarium.
And the August perigee of the Moon only beats out the January 1st, 2014 perigee out by a scant 25 kilometres for the title of the closest perigee of the year, although the Moon was at New phase on that date, with lots less fanfare and hoopla for that one. Perigee itself can vary from 356,400 to 370,400 kilometres distant.
But there’s more. If you consider a “Supermoon” as a Full Moon falling within 24 hours of perigee, (folks like to play fast and loose with the informal definitions when the Supermoon rolls around, as you’ll see) then we actually have a trio of Supermoons on tap for 2014, with one this week on July 12th and September 9th as well.
What, then, is this lunacy?
Well, as many an informative and helpful commenter from previous years has mentioned, the term Supermoon was actually coined by an astrologer. Yes, I know… the same precession-denialists that gave us such eyebrow raising terms as “occultation,” “trine” and the like. Don’t get us started. The term “Supermoon” is a more modern pop culture creation that first appeared in a 1979 astrology publication, and the name stuck. A more accurate astronomical term for a “Supermoon” is a perigee-syzygy Full Moon or Proxigean Moon, but those just don’t seem to be able to “fill the seats” when it comes to internet hype.
One of the more arcane aspects set forth by the 1979 definition of a Supermoon is its curiously indistinct description as a “Full Moon which occurs with the Moon at or near (within 90% of) its closest approach to Earth in a given orbit.” This is a strange demarcation, as it’s pretty vague as to the span of distance (perigee varies, due to the drag of the Sun on the Moon’s orbit in what’s known as the precession of the line of apsides) and time. The Moon and all celestial bodies move faster near perigee than apogee as per Kepler’s 2nd Law of planetary motion.
A photo essay comparing Full Moon sizes and appearance from one Supermoon to the next, spanning 2011-2012. Credit: Marion Haligowski/RadicalRetinscopy. Used with permission.
We very much prefer to think of a Proxigean Moon as defined by a “Full Moon within 24 hours of perigee”. There. Simple. Done.
And let’s not forget, Full phase is but an instant in time when the Moon passes an ecliptic longitude of 180 degrees opposite from the Sun. The Moon actually never reaches 100% illumination due to its 5.1 degree tilt to the ecliptic, as when it does fall exactly opposite to the Sun it also passes into the Earth’s shadow for a total lunar eclipse.
-Check out this animation of the changing size of the Moon and its tilt — known as libration and nutation, respectively — as seen from our Earthly perspective over the span of one lunation.
The truth is, the Moon does vary from 356,400 to 406,700 kilometres in its wonderfully complicated orbit about our fair world, and a discerning eye can tell the difference in its size from one lunation to the next. This means the apparent size of the Moon can vary from 29.3’ to 34.1’ — a difference of almost 5’ — from perigee to apogee. And that’s not taking into account the rising “Moon illusion,” which is actually a variation of an optical effect known as the Ponzo Illusion. And besides, the Moon is actually more distant when its on the local horizon than overhead, to the tune of about one Earth radius.
Like its bizarro cousin the “minimoon” and the Blue Moon (not the beer), the Supermoon will probably now forever be part of the informal astronomical lexicon. And just like recent years before 2014, astronomers will soon receive gushing platitudes during next month’s Full Moon from friends/relatives/random people on Twitter about how this was “the biggest Full Moon ever!!!”
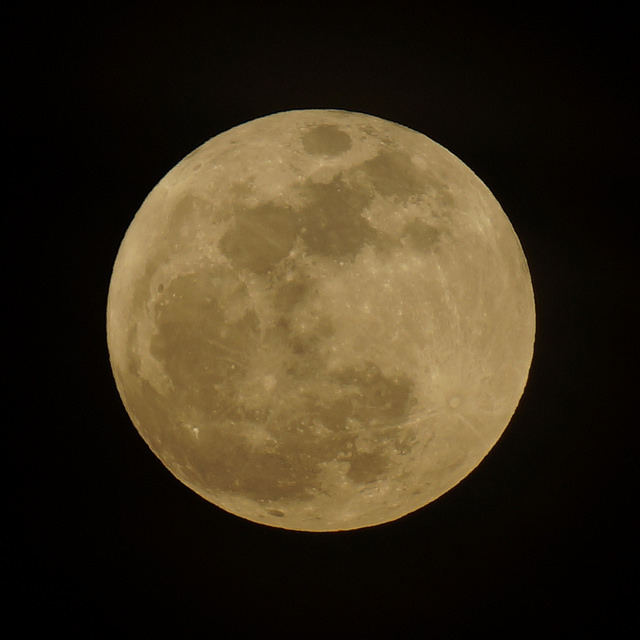
The perigee Full Moon of May 5th, 2012. Credit: Stephen Rahn (@StephenRahn13)
Does the summer trio of Full Moons look bigger to you than any other time of year? It will be tough to tell the difference visually over the next three Full Moons. Perhaps a capture of the July, August and September Full Moons might just tease out the very slight difference between the three.
And for those preferring not to buy in to the annual Supermoon hype, the names for the July, August and September Full Moons are the Buck, Sturgeon and Corn Moon, respectively. And of course, the September Full Moon near the Equinox is also popularly known as the Harvest Moon.
And in case you’re wondering, or just looking to mark your calendar for the next annual “largest Full Moon(s) of all time,” here’s our nifty table of Supermoons through 2020, as reckoned by our handy definition of a Full Moon falling within 24 hours of perigee.
So what do you say? Let ‘em come for the hype, and stay for the science. Let’s take back the Supermoon.
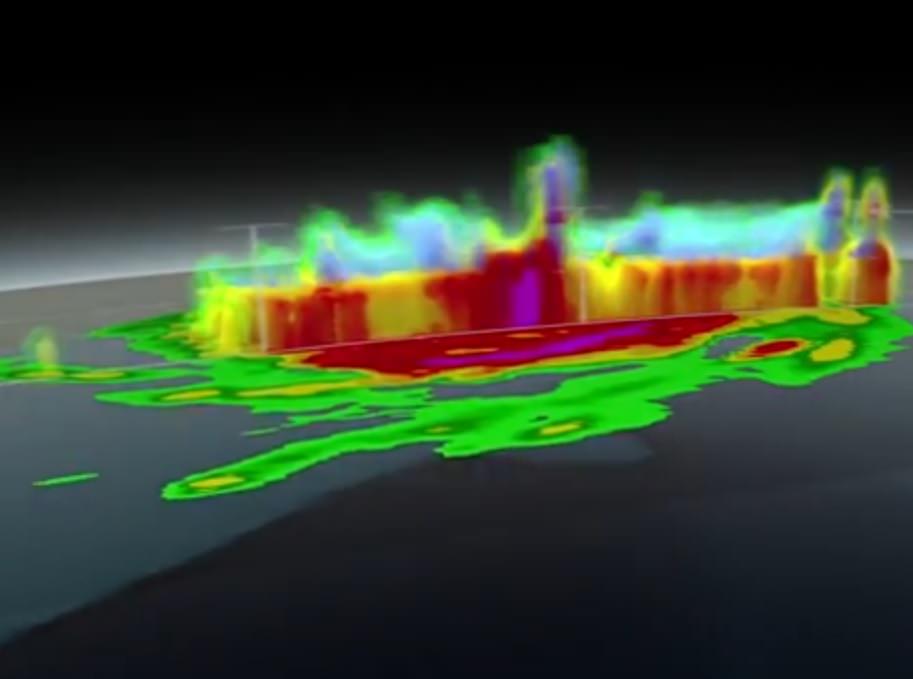
A 3-D view of Hurricane Arthur in July 2014, taken from instruments aboard the NASA-JAXA Global Precipitation Measurement (GPM) Core Observatory. Credit: NASA / YouTube (screenshot)
While Hurricane Arthur was still a hurricane, the new Global Precipitation Measurement (GPM) Core Observatory flew over the storm last week and captured its structure in 3-D. This was a good test of the new satellite, which is supposed to help NASA track these Atlantic storms to better precision than before.
The joint NASA-Japanese Aerospace Exploration Agency mission allowed researchers to do better forecasting because they could track the precipitation to 1,000 feet vertically and three miles horizontally (305 meters and five kilometers).
“Hurricane features pop out more. They’re sharper, there’s more clarity to the structures,” stated NASA Goddard hurricane researcher Scott Braun. “Being able to see the structures more clearly may allow for better determination of the structure of the eye wall and rainbands, thereby providing clues about the likelihood of a storm intensifying or weakening.”
Artist's concept of Voyager 1 in interstellar space. Credit: NASA/JPL-Caltech
Wow! Even from interstellar space, the plucky Voyager 1 can still listen in to activities from our Sun. Whenever the Sun has a large amount of activity, the waves of energy it sends out bashes into the charged gas particles or plasma surrounding the NASA spacecraft, which has been sailing away from Earth since 1977.
There have been three events so far from our Sun (which is in solar maximum), with each one confirming scientists’ findings that interstellar space is where the spacecraft is, NASA said.
“Normally, interstellar space is like a quiet lake,” stated Voyager project scientist Ed Stone of the California Institute of Technology. “But when our sun has a burst, it sends a shock wave outward that reaches Voyager about a year later. The wave causes the plasma surrounding the spacecraft to sing.”
“The tsunami wave rings the plasma like a bell,” added Stone. “While the plasma wave instrument lets us measure the frequency of this ringing, the cosmic ray instrument reveals what struck the bell — the shock wave from the Sun.”
The discovery of this wave front confirms the previous assertion that Voyager 1 is indeed in interstellar space, NASA added. Winds from the sun push against the plasma at the edge of interstellar space, making it denser (40 times denser than what was measured before Voyager reached the milestone in 2012, in fact.)
NASA’s announcement in 2013 that Voyager 1 is in interstellar space was accompanied by intense discussion about whether it is in or out of the Solar System (it still hasn’t reached the shell of the Oort Cloud that hosts comets, a milestone that won’t be possible for 300 years). Prior to the announcement, several scientific papers had also weighed in on Voyager 1’s status, with some saying it was interstellar space and some not.