Arctic Melting Is Lasting Longer And Affecting More Ice: Study

An image mosaic of ice breaking up in the Arctic Ocean's Canada Basin on March 28, 2014. Image taken by Operation IceBridge's Digital Mapping System. Credit: Digital Mapping System/NASA Ames

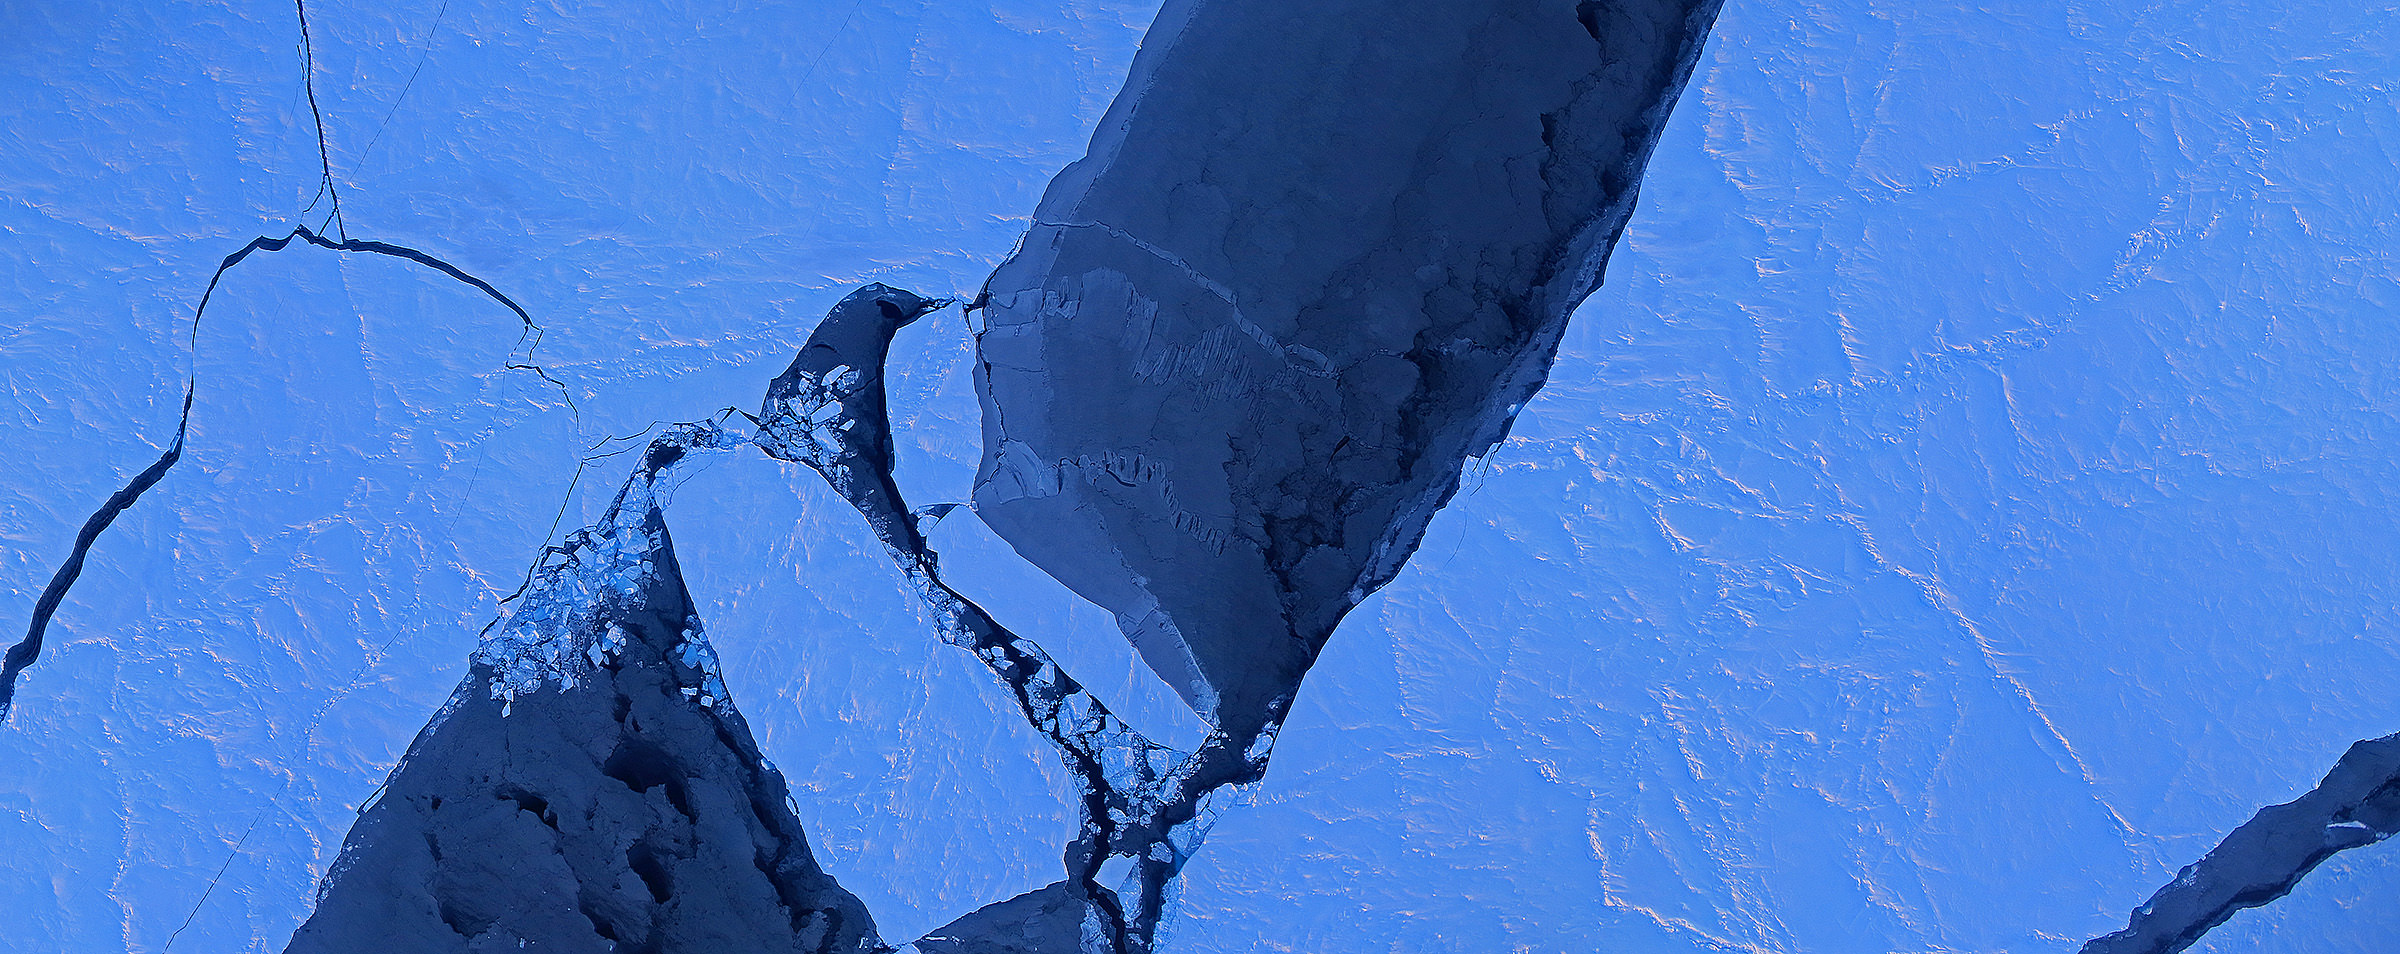
The Arctic melt season is averaging five days longer with each passing decade, a new study by NASA and the National Snow and Ice Data Center reveals. And with more ice-free days, the water (which is darker than the surrounding ice) is absorbing the sun’s heat and accelerating the process. This means the Arctic ice cap has shrank by as much as four feet.

The sobering news comes following a study of satellite data from 1979 to 2013. By the end of this century, scientists believe, there will be a fully melted Arctic Ocean during the entire summer. And the news also comes in the same week that the Intergovernmental Panel on Climate Change  (IPCC) released its own report on global warming.

“The Arctic is warming and this is causing the melt season to last longer,” stated Julienne Stroeve, a senior scientist at NSIDC, Boulder and lead author of a new study. “The lengthening of the melt season is allowing for more of the sun’s energy to get stored in the ocean and increase ice melt during the summer, overall weakening the sea ice cover.”

The research further revealed that solar radiation absorption depends on when the melt season begins; this is particularly true since the sun rises higher during the spring, summer and fall than in the winter. It’s still hard to predict when things will melt or freeze, however, since this depends on weather.

“There is a trend for later freeze-up, but we can’t tell whether a particular year is going to have an earlier or later freeze-up,” Stroeve said. “There remains a lot of variability from year to year as to the exact timing of when the ice will reform, making it difficult for industry to plan when to stop operations in the Arctic.”

Data was collected with NASA’s (long deceased) Nimbus-7 Scanning Multichannel Microwave Radiometer and instruments aboard Defense Meteorological Satellite Program spacecraft.

“When ice and snow begin to melt, the presence of water causes spikes in the microwave radiation that the snow grains emit, which these sensors can detect,” NASA stated. “Once the melt season is in full force, the microwave emissivity of the ice and snow stabilizes, and it doesn’t change again until the onset of the freezing season causes another set of spikes.”

The research has been accepted for publication in Geophysical Research Letters.

Source: NASA

Tranquil-Looking Galaxy Bears ‘Battle Scars’ From Ancient Struggles

NGC 1316 (left) and its smaller companion galaxy NGC 1317. Image taken with the MPG/ESO 2.2-metre telescope at ESO’s La Silla Observatory in Chile. Credit: ESO

Shining 60 million light-years away all serene-looking is NGC 1316 (left) and a smaller galaxy NGC 1317. This new picture from the European Southern Observatory’s La Silla Observatory in Chile, however, reveals “battle scars” of ancient fights, the observatory stated.

“Several clues in the structure of NGC 1316 reveal that its past was turbulent. For instance, it has some unusual dust lanes embedded within a much larger envelope of stars, and a population of unusually small globular star clusters. These suggest that it may have already swallowed a dust-rich spiral galaxy about three billion years ago,” the European Southern Observatory stated.

“Also seen around the galaxy are very faint tidal tails — wisps and shells of stars that have been torn from their original locations and flung into intergalactic space. These features are produced by complex gravitational effects on the orbits of stars when another galaxy comes too close. All of these signs point to a violent past during which NGC 1316 annexed other galaxies and suggest that the disruptive behavior is continuing.”

You might better known NGC 1316 as Fornax A, the brightest radio source in the constellation Fornax and the fourth-brightest source in the sky. This is due to its supermassive black hole sucking up material in the area — and could actually be stronger because of the close encounters with other galaxies.

This image is a composite of archival pictures from the telescope. If you look closely, you can spot some fainter galaxies in the background, too.

Source: ESO

Massive Earthquake off the Coast of Chile Triggers Tsunami Warnings in the Pacific

Tsunami propagation forecast following the April 1, 2014 earthquake off the coast of Chile. Credit: NOAA's Pacific Tsunami Warning Center.

An 8.2-magnitude earthquake off the coast of northern Chile on April 1, 2014 was followed by at least a dozen significant aftershocks, including one with a magnitude of 6.2. This activity initially generated tsunami warnings across the Pacific, but the warnings were later canceled except for the coastal regions of Chile and Peru, according to NOAA’s Pacific Tsunami Warning Center.

Tsunami waves of more than 2 meters (6 feet) came ashore on the coast of Pisagua, Chile and 2.13 meter (7-foot) waves were reported in Iquique, Chile, according to the PTWC. The U.S Geological Survey reported the quake major quake was centered offshore about 96 km (60 miles) northwest of Iquique, at a depth of 20 km (12.5 miles).

At the time of this writing, the quake has reportedly caused only minor damage in Chile with two possible casualties, but several people are missing. There was a small landslide, several large fires, along with damaged boats and some flooding in Iquique due to the tsunami, according to Earthquakereport.com.

Chile’s National Emergency Office tweeted Tuesday night that it was asking everyone to evacuate the country’s coastal areas, and reports in the news and on social media said that the evacuations were orderly.

This earthquake follows several weeks of seismic activity in the South American Pacific region. On March 16, a 6.7-magnitude earthquake struck 60 km (37 miles)northwest of Iquique, according to the USGS. A 6.1-magnitude hit the same area one week later.

Chile is one of the most seismically active countries in the world, and is along the so-called “Ring of Fire,” an arc of volcanoes and fault lines circling the Pacific Basic that is prone to frequent earthquakes and volcanic eruptions.
The strongest earthquake ever recorded on Earth also took place happened in Chile. A magnitude-9.5 quake in 1960 killed more than 5,000 people. The most recent large quake in February 2010 hit central and southern Chile with a magnitude of 8.8, followed by a tsunami that left more than 500 dead with $30 billion in damage to property.

BkLusWJCcAAeGQl

Tsunami waves travel about 800 km per hour, (500 miles per hour). That seems fast, but compared to a seismic wave it is slow. The speed of seismic wave, the P wave (or primary wave, which is the fastest kind of seismic wave) is about 8 km per second, or 30,000 km per hour.

You can compare a tsuanmi wave to the speed of a jet plane.

But while scientists can predict the speed and the direction of tsunamis fairly well, the height at a given location is can be very hard to predict, according to Anne Sheehan from the University of Colorado at Boulder, who spoke to Universe Today for a previous article about the science behind a tsunami.

“For predicting an ensuing tsunami, to have data on the earthquake itself — getting its epicenter located and knowing its size as accurately as possible plays a big role,” she said, “and the USGS plays a big role in getting that information out as quickly as possible.

Update: Here’s an animation from NOAA of the prediction of the tsunami following the April 1 quake in Chile:

Astrophotos: Here’s What a Super-thin Crescent Moon Looks Like

A tiny crescent Moon, with only about 1% of the lunar surface illuminated, one day a few hours after the New Moon phase. March 31, 2014 from Sulmona, Abruzzo, Italy. Credit and copyright: Giuseppe Petricca.

Last night, you could have sung that old astronomical favorite, “By the light of the slivery Moon.” Yep, it was a teeny, tiny sliver of a crescent Moon, with just under 2% of the lunar surface illuminated. In fact, depending on where you live, the sliver could have been even tinier. Giuseppe Petricca from Sulmona, Abruzzo, Italy snapped a 1% illuminated Moon (above) and then realized he also managed to capture images of the crescent Moon during the day when the Moon was just 0.7% illuminated! (below) “It was less than a day since the New Moon!” Giuseppe said via email. “I was absolutely amazed, to say the least!”

See his daytime image below, plus many more “slivery” tiny crescent Moons as seen from around the world:

The tiny crescent Moon captured during the daytime in Sulmona, Abruzzo, Italy, in a 0.7% phase, minus than a day since New Moon. Credit and copyright: Giuseppe Petricca.

The one-day old crescent Moon on March 31, 2014. Credit and copyright: Robert Sparks.

The 1.2 day old Moon, 2% illuminated, from Weatherly, PA. Inset picture taken with 12" Meade telescope. Credit and copyright: Tom Wildoner.
The 1.2 day old Moon, 2% illuminated, from Weatherly, PA. Inset picture taken with 12″ Meade telescope. Credit and copyright: Tom Wildoner.
 The Moon at sunset with only 2% of its surface illuminated. Credit and copyright:  Héctor Barrios.

The Moon at sunset with only 2% of its surface illuminated. Credit and copyright: Héctor Barrios.
A thin crescent Moon on April 1, 2014. Credit and copyright: Jason Hill.

Want to get your astrophoto featured on Universe Today? Join our Flickr group or send us your images by email (this means you’re giving us permission to post them). Please explain what’s in the picture, when you took it, the equipment you used, etc.

Eye-Popping Aurora in Alaska

Aurora Borealis coronal display near Fairbanks Alaska, on March 25, 2014. Credit and copyright: John Chumack.

For the past several years, astrophotographer John Chumack has lead a tour to Alaska on how to photograph the northern lights and the night sky, and this year was a great success. “We experienced perfect weather this year: 10 clear nights in a row, with an aurora display every night,” John said via email. Last week, we featured some of images from this year’s trip, but here are some additional images that are really amazing, plus John has put together a stunning timelapse from images he took on March 26, see below:


Aurora Borealis coronal display near Fairbanks Alaska, on March 25, 2014. Credit and copyright: John Chumack.
Another image of the Aurora Borealis coronal display near Fairbanks Alaska, on March 25, 2014. Credit and copyright: John Chumack.
John Chumack stand under the Aurora Borealis near Fairbanks, Alaska on March 25, 2014. Credit and copyright: John Chumack.

Find out more about John’s Alaska aurora tour for 2015 here.

Neil Armstrong: Why The World Needs ‘Nerdy Engineers’ (In Animated Form)

Neil Armstrong at a gala celebrating NASA's 50th anniversary in September 2008. Credit: NASA/Paul Alers

Combine the gravitas of humanity’s first moon visitor with the whimsy of animation, and the result is pure fun. Here, you can see part of Neil Armstrong’s address to the National Press Club on Feb. 22, 2000 about how engineering made the world a lot better in the past century. Providing animation is PhD Comics creator Jorge Cham.

“Engineering helped create a world in which no injustice could be hidden,” the retired NASA astronaut (now deceased) said in that speech, explaining that engineering is more focused on envisioning possibilities than the facts-based science professions.

While Armstrong makes no direct reference to his historic 1969 moon landing in the speech, the animation is peppered with references including the famous “bootprint” picture taken by his crewmate, Buzz Aldrin.

We’d be interested in knowing what scientists or science fans think of his point of view. Is Armstrong’s view too limited for science, or an accurate description? Watch the video, and let us know in the comments.

SpaceX’s Next-Generation Reusable Rocket Roars In Tie-Down Test

The first stage of SpaceX's F9R rocket was tested in a "static fire" in March 2014. Credit: SpaceX/YouTube (screenshot)

As SpaceX pursues its quest of rocket reusability, it recently subjected the first stage of its next generation Falcon 9 rocket (called the Falcon 9-reusable or F9R) to a tie-down test ahead of some more heavy-duty work in the coming months and years. Early indications are that the test was a success, the firm said.

Details of the rocket are still scance on the SpaceX’s website, but the California-based company said that the rocket would generate about a million pounds of thrust at sea level, and 1.5 million pounds in space. It’s also a sort of follow-on from the leaping reusable Grasshopper rocket that retired last year.

Rockets are usually the “throwaway” items in a flight, but SpaceX is betting that by creating a reusable one that it will save on launch costs in the long run. (The rocket has been tested before, such as this long-duration one last June.)

“F9R test flights in New Mexico will allow us to test at higher altitudes than we are permitted for at our test site in Texas, to do more with unpowered guidance and to prove out landing cases that are more-flight like,” SpaceX stated in the YouTube video description.

SpaceX’s next launch to the space station was supposed to be in March, but it was scrubbed due to a radar outage that is affecting several launches. You can read more about the Falcon 9 rocket’s development (including the addition of landing legs) in this recent Universe Today article by Ken Kremer.

Starquake! How Super-Suns Swing, And What It Could Look Like

Artist's conception of a starquake cracking the surface of a neutron star. Credit: Darlene McElroy of LANL

Much like how an earthquake can teach us about the interior of the Earth, a starquake shows off certain properties about the inside of a star. Studying the closest star we have (the sun) has yielded information about rotation, radius, mass and other properties of stars that are similar to our own. But how do we apply that information to other types of stars?

A team of astronomers attempted to model the inside of a delta-Scuti, a star like Caleum that is about 1.5 to 2.5 times the mass of the sun and spins rapidly, so much more that it tends to flatten out. The model reveals there is likely a correlation between how these types of stars oscillate, and what their average density is. The theory likely holds for stars as massive as four times the mass of our sun, the team said.

“Thanks to asteroseismology we know precisely the internal structure, mass, radius, rotation and evolution of solar type stars, but we had never been able to apply this tool efficiently to the study of hotter and more massive stars,” stated Juan Carlos Suárez, a researcher at the Institute of Astrophysics of Andalusia who led the investigation.

Model of an oscillation within the sun. Credit: David Guenther, Saint Mary´s University

What’s more, knowing how dense a star is leads to other understandings: what its mass is, its diameter and also the age of any exoplanets that happen to be hovering nearby. The astronomers added that the models could be of use for the newly selected Planetary Transits and Oscillations (PLATO) telescope that is expected to launch in 2024.

A paper based on the research was published in Astronomy and Astrophysics and is also available in preprint form on Arxiv.

Source: The Institute of Astrophysics of Andalusia

Carnival of Space #347

Carnival of Space. Image by Jason Major.

This week’s Carnival of Space is hosted by Nicole Gugliucci at her Cosmoquest blog.

Click here to read Carnival of Space #347

And if you’re interested in looking back, here’s an archive to all the past Carnivals of Space. If you’ve got a space-related blog, you should really join the carnival. Just email an entry to [email protected], and the next host will link to it. It will help get awareness out there about your writing, help you meet others in the space community – and community is what blogging is all about. And if you really want to help out, sign up to be a host. Send an email to the above address.

Possible Nova Pops in Cygnus

Cygnus. Credit: Stellarium

A newly-discovered star of magnitude +10.9 has flared to life in the constellation Cygnus the Swan. Koichi Nishiyama and Fujio Kabashima, both of Japan, made their discovery yesterday March 31 with a 105mm f/4 camera lens and electronic camera. They quickly confirmed the observation with additional photos taken with a 0.40-m (16-inch) reflector. Nothing was seen down to magnitude +13.4  in photos taken the on the 27th, but when they checked through images made on March 30 the star present at +12.4. Good news – it’s getting brighter!

This more detailed map, showing stars to mag. 10.5, will help you pinpoint the star. Stellarium
This more detailed map, showing stars to mag. 10.5, will help you pinpoint the star. Its coordinates are R.A. 20h 21m 42, declination +31 o3′. Stellarium

While the possible nova will need confirmation, nova lovers may want to begin observing the star as soon as possible. Novae can brighten quickly, sometimes by several magnitudes in just a day. These maps should help you hone in on the star which rises around midnight and becomes well placed for viewing around 1:30-2 a.m. local time in the eastern sky. At the moment, it will require a 4-inch or larger telescope to see, but I’m crossing my fingers we’ll see it brighten further.

Novae occur in close binary systems where one star is a tiny but extremely compact white dwarf star. The dwarf pulls material into a disk around itself, some of which is funneled to the surface and ignites in a nova explosion. Credit: NASA

To see a nova is to witness a cataclysm. Astronomers – mostly amateurs – discover about 10 a year in our Milky Way galaxy. Many more would be seen were it not for dust clouds and distance. All involve close binary stars where a tiny but extremely dense white dwarf star steals gas from its companion. The gas ultimately funnels down to the 150,000 degree surface of the dwarf where it’s compacted by gravity and heated to high temperature until it ignites in an explosive fireball. If you’ve ever wondered what a million nuclear warheads would look like detonated all at once, cast your gaze at a nova.

Novae can rise in brightness from 7 to 16 magnitudes, the equivalent of 50,000 to 100,000 times brighter than the sun, in just a few days. Meanwhile the gas they expel in the blast travels away from the binary at up to 2,000 miles per second.

One of the key diagnostics for nova identification is the appearance of deep red light in its spectrum called hydrogen alpha or H-alpha. Italian astronomer obtained this spectrum of the possible nova on April 1. Credit: Gianluca Masi
Emission of deep red light called hydrogen alpha or H-alpha is often diagnostic of a nova. When in the fireball phase, the star is hidden by a fiery cloud of rosy hydrogen gas and expanding debris cloud. Italian astronomer obtained this spectrum of the possible nova on April 1 showing H-alpha emission. Credit: Gianluca Masi

Nishiyama and Kabashima are on something of a hot streak. If confirmed, this would be their third nova discovery in a month! On March 8, they discovered Nova Cephei 2014 at magnitude 11.7 (it’s currently around 12th magnitude) and 10th magnitude Nova Scorpii 2014 (now at around 12.5) on March 26. Impressive.

Photo showing the possible nova in Cygnus. The star is described as being tinted red. Credit: Gianluca Masi

Charts for the two older discoveries are available on the AAVSO website. Type in either Nova Cep 2014 or TCP J17154683-3128303 (for Nova Scorpii)  in the Star finder box and click Create a finder chart. I’ll update this article as soon as a chart for the new object is posted.

** UPDATE April 2, 2014: This star has been confirmed as a nova. You can print out a chart by going to the AAVSO website and following the instructions above using Nova Cyg 2014 for the star name. On April 2.4 UT, I observed the nova at magnitude 11.o.