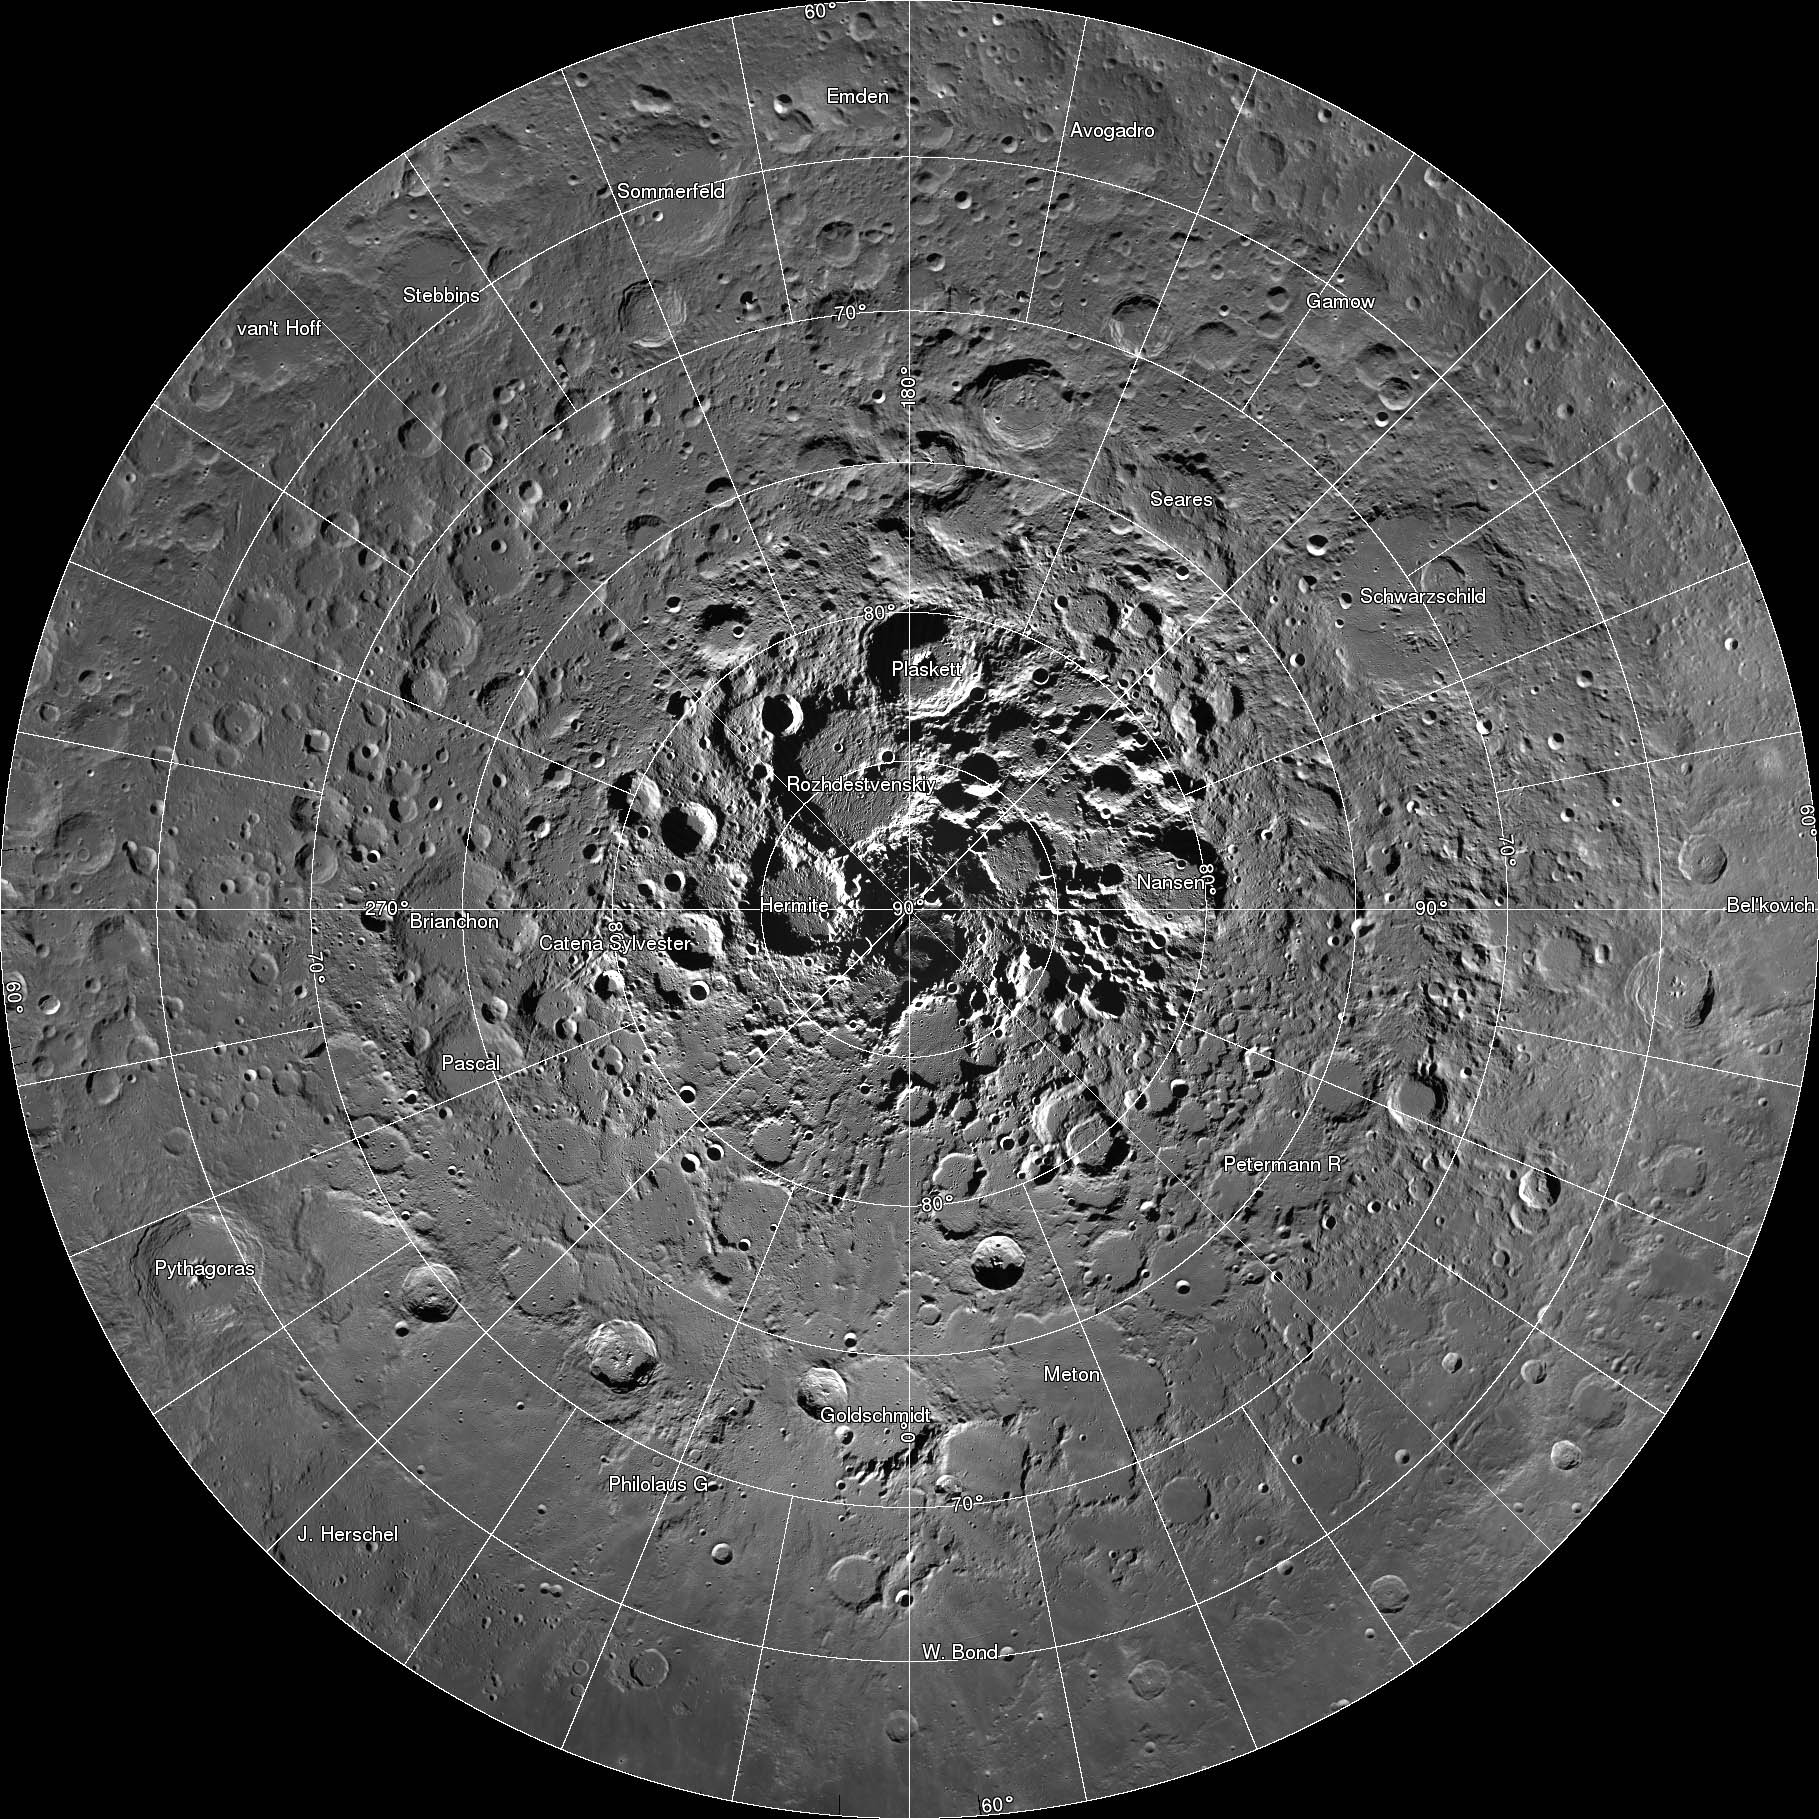
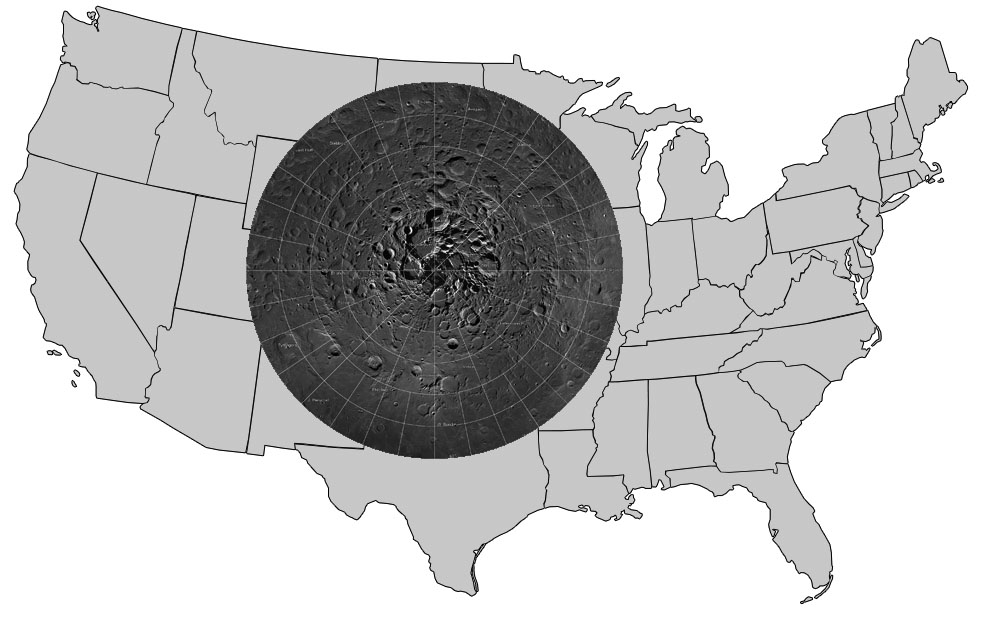
A new interactive mosaic from NASA's Lunar Reconnaissance Orbiter covers the north pole of the moon from 60 to 90 degrees north latitude at a resolution of 6-1/2 feet (2 meters) per pixel. Close-ups of Thales crater (right side) zoom in to reveal increasing levels of detail.
Image Credit: NASA/GSFC/Arizona State University
OMG – breathtaking! That was my reaction when I clicked on this incredible new interactive map of the moon’s north polar region. Be prepared to be amazed. It took four years and 10,581 images for the LROC (Lunar Reconnaissance Orbiter Camera) team to assemble what’s believed to be the largest publicly available image mosaic in existence. With over 650 gigapixels of data at a resolution of 2 meters per pixel, you’ll feel like you’re dropping in by parachute to the lunar surface.
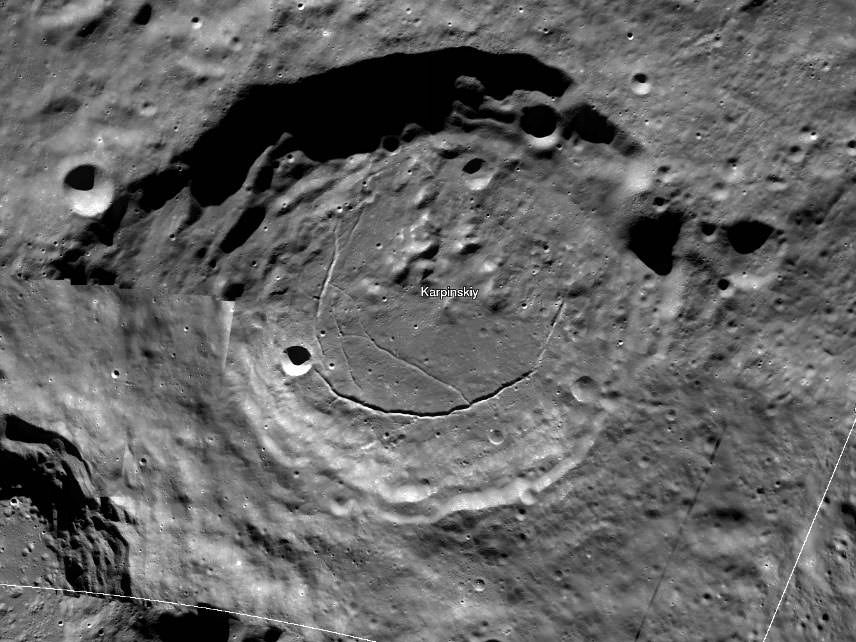
Wide view of the 91-km Karpinskiy Crater from the new interactive north pole mosaic. See image below for a zoomed-in view. Credit: NASA/GSFC/Arizona State Univ.
When you call up the map, be sure to click first on the full-screen button below the zoom slider. Now you’re ready for the full experience. With mouse in hand, you’re free to zoom and pan as you please. Take in the view of Whipple Crater shadowed in polar darkeness or zoom to the bottom of Karpinskiy Crater and fly like a bird over its fractured floor.
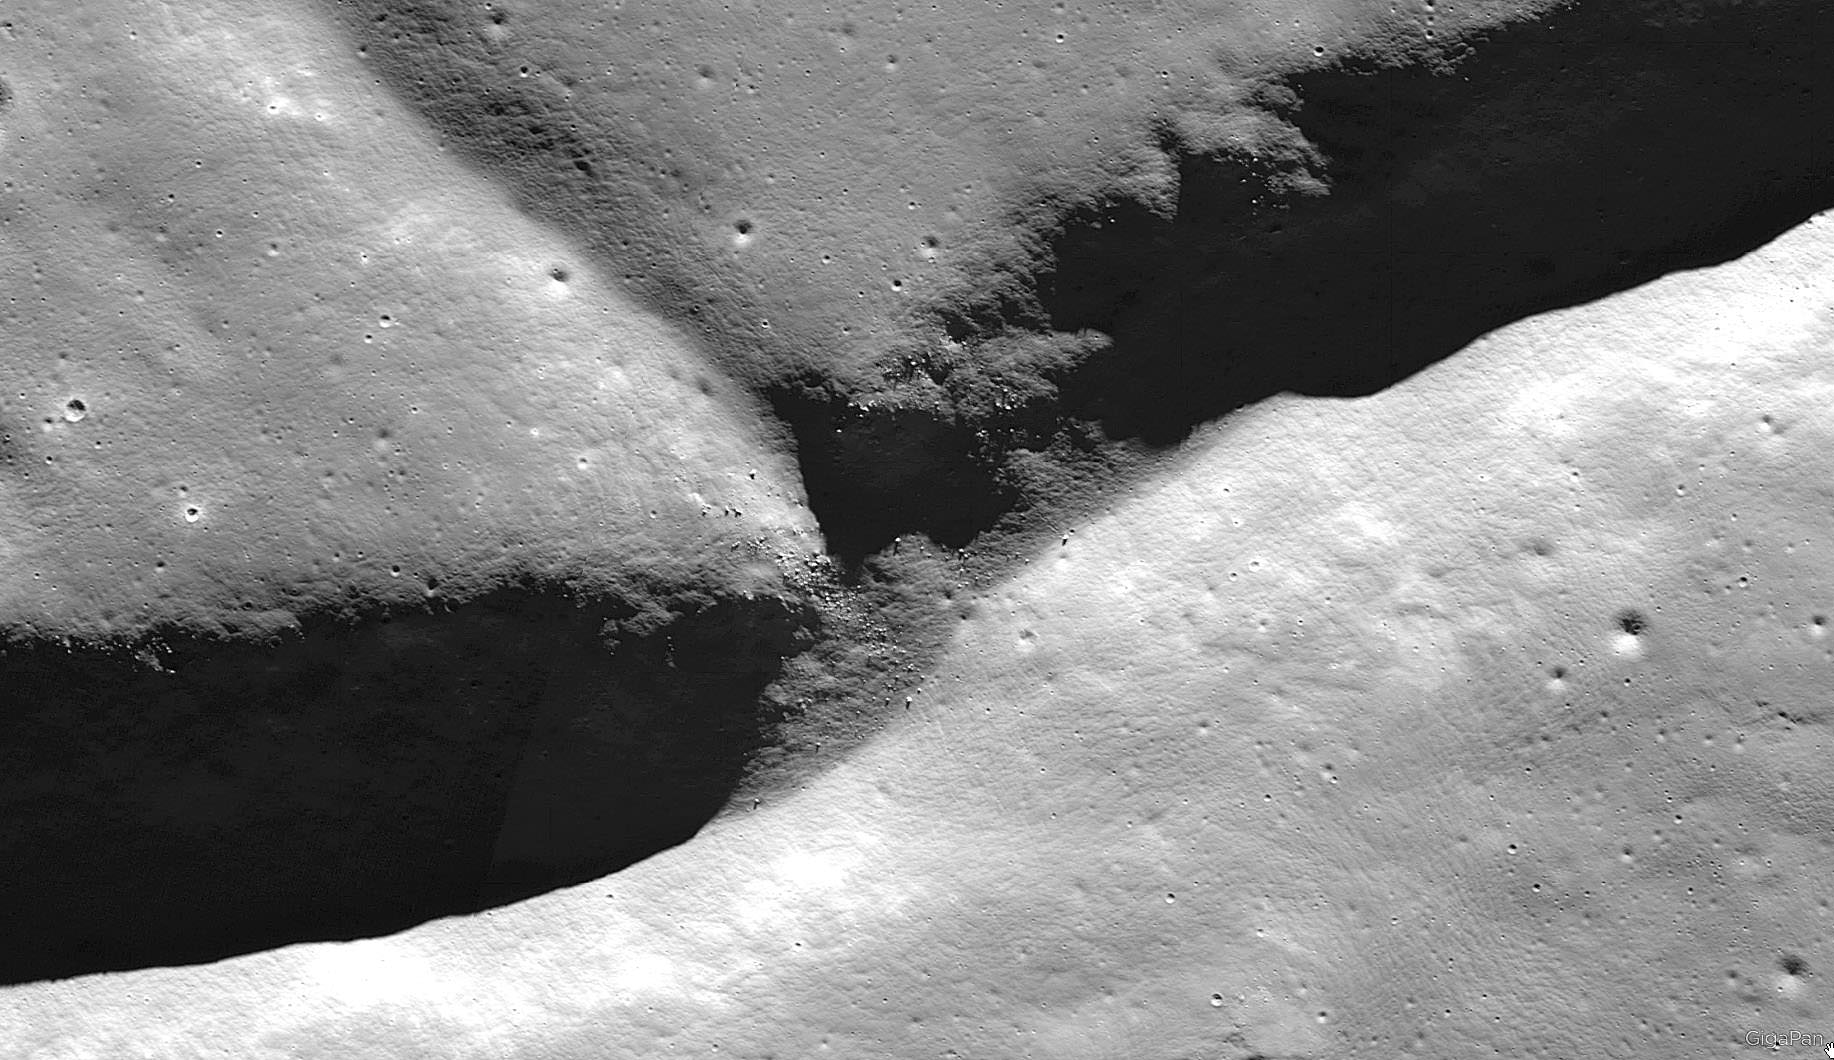
In this photo, we come in for a closer look at the fracture or rill in Karpinskiy’s floor. Notice the small, lighter-toned boulders on the cliff side. The images were all taken with the Lunar Reconnaissance Orbiter’s Narrow Angle Camera (NAC). Credit: NASA/GFSC/Arizona State Univ.
The images are so detailed and the zoom so smooth, there’s nothing artificial about the ride. Except the fact you’re not actually orbit. Darn close though. All the pictures were taken over the past few years by NASA’s Lunar Reconnaissance Orbiter which can fly as low as 50 km (31 miles) over the lunar surface and resolve details the size of a desk.
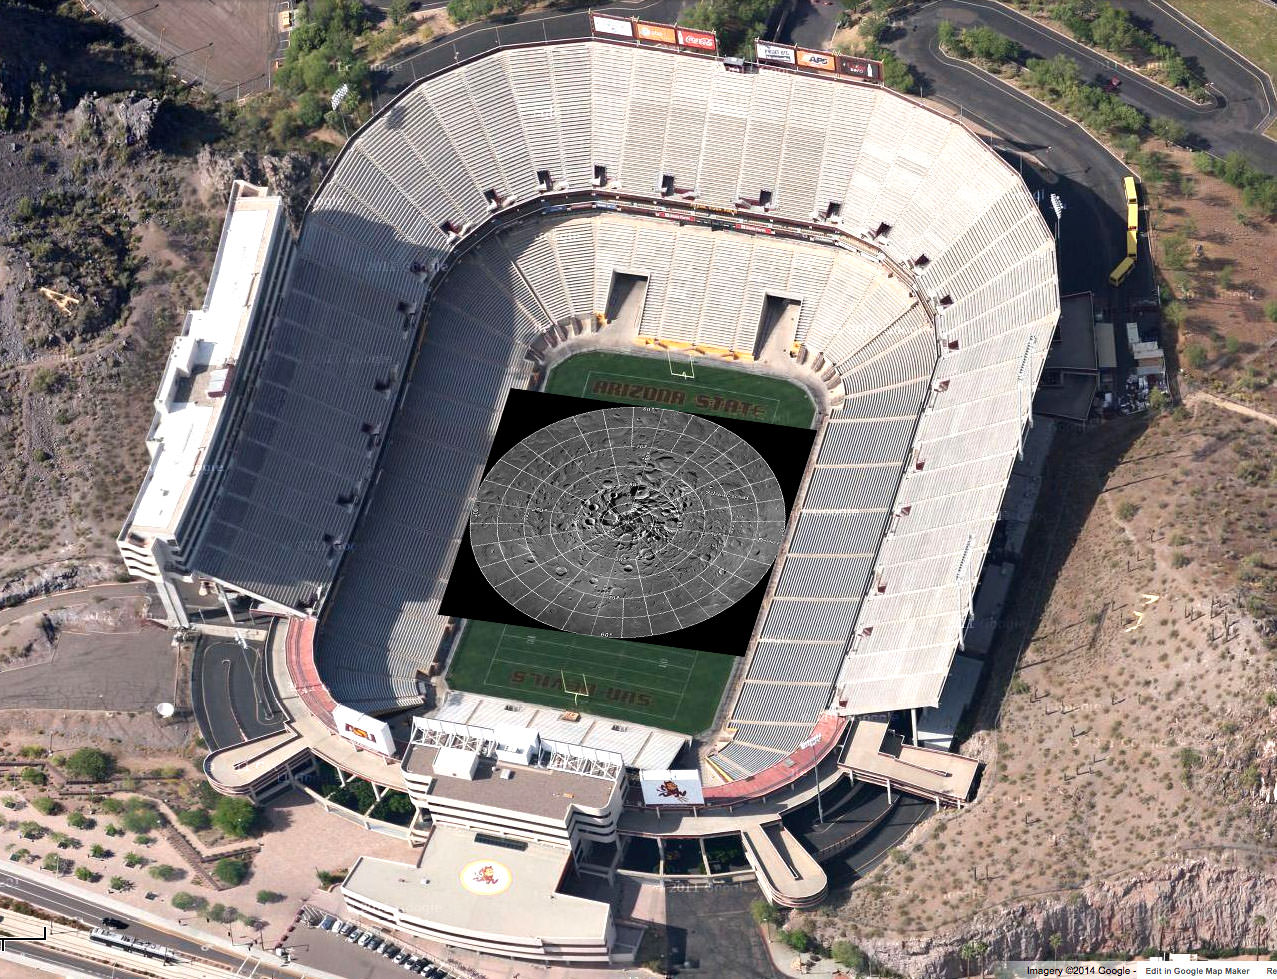
Printed at 300 dpi – a high-quality printing resolution that requires you to peer very closely to distinguish pixels – the mosaic map would be larger than a football field. Credit: NASA
There are 10 snapshots along the bottom of the map – click them and you’ll be swiftly carried directly to that feature. One of them is the lunar gravity probe GRAIL-B impact site.
The region the gigapixel map covers superimposed on the outline of the U.S. Credit: NASA
To create the 2-D map, a polar stereographic projection was used in to limit mapping distortions. In addition, the LROC team used information from the LOLA and GRAIL teams and an improved camera pointing model to accurately project each image in the mosaic to within 20 meters. For more information on the project, click HERE.
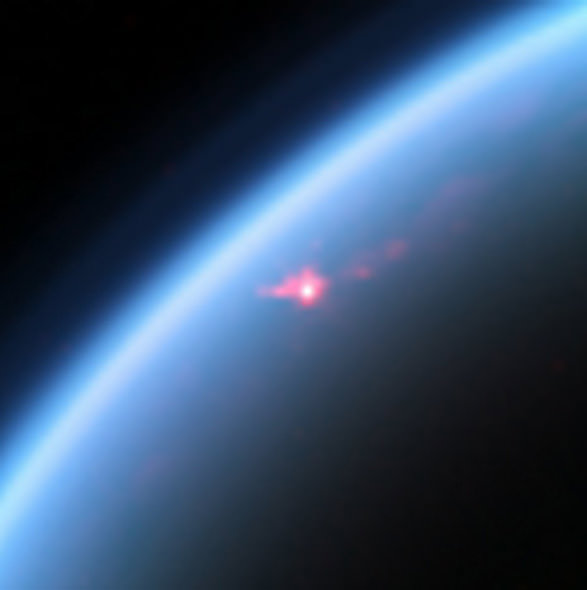
Cassini VIMS image of specular reflections in one of Titan's lakes from a flyby on July 24, 2012 (NASA/JPL-Caltech/SSI/Jason W. Barnes et al.)
It’s no surprise that Titan’s north polar region is covered with vast lakes and seas of liquid methane — these have been imaged many times by Cassini during its ten years in orbit around Saturn. What is surprising though is just how incredibly smooth the surfaces of these lakes have been found to be.
One would think that such large expanses of surface liquid — some of Titan’s seas are as big the Great Lakes — would exhibit at least a little surface action on a world with an atmosphere as dense as Titan’s. But repeated radar imaging has shown their surfaces to be “as smooth as the paint on a car.” Over the past several years scientists have puzzled over this anomaly but now they may have truly seen the light — that is, reflected light from what could actually be waves on Titan!
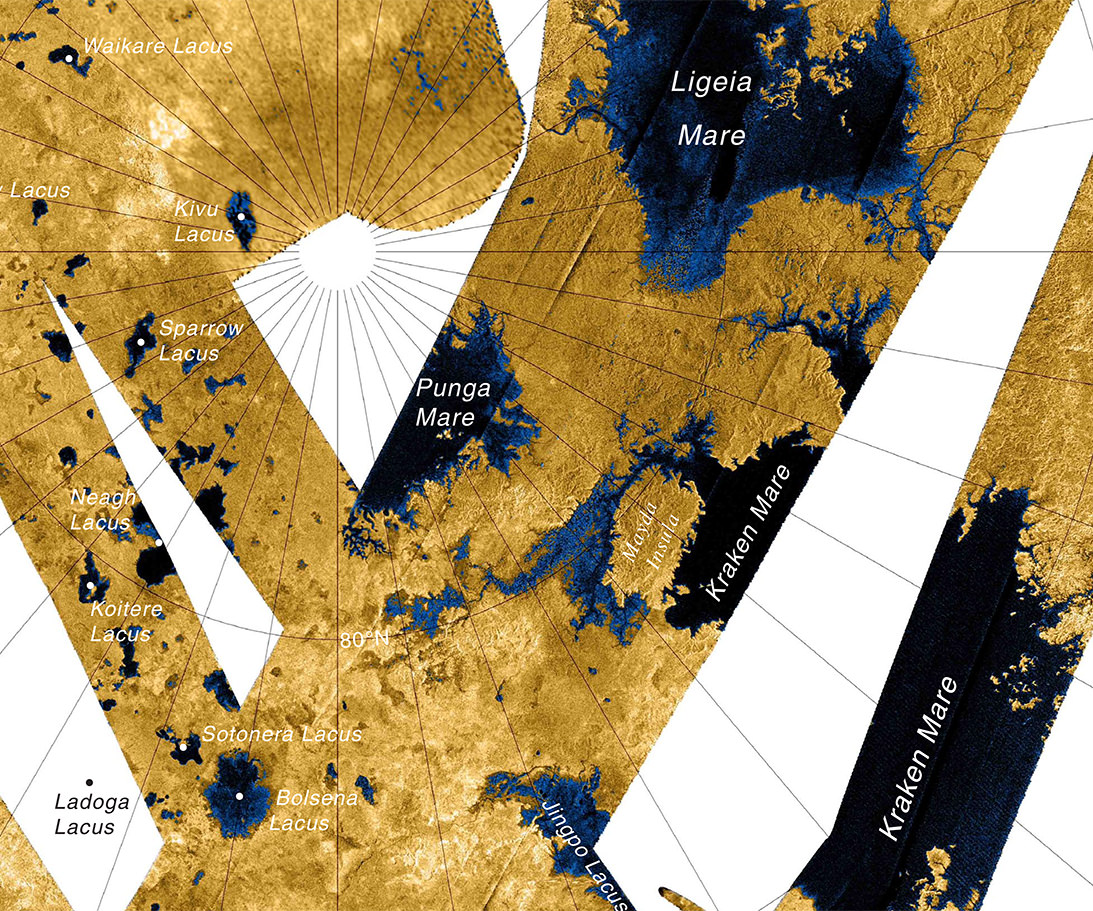
Using data acquired during flybys of Titan in 2012 and 2013, planetary scientist Jason Barnes from the University of Idaho and a team of researchers from several other institutions including JPL, Cornell, and MIT, have identified what might be waves in the surface of Punga Mare, one of Titan’s biggest lakes.
For a sense of scale, Lake Victoria, the largest lake in Africa, could fit lengthwise across Titan’s 380-km (236-mile) -wide Punga Mare.
Variations in specular highlights in four pixels observed in the surface of Punga Mare by Cassini’s VIMS (Visible and Infrared Mapping Spectrometer) have been interpreted by the team as being the result of waves — or, perhaps more accurately, ripples, seeing as that they are estimated to be a mere 2 centimeters in height.
Still, based on what’s been observed thus far on Titan, that’s downright choppy.
If the Cassini observations interpreted by Barnes et al. are indicative of waves in Punga Mare, they could also explain previous specular variations seen in other bodies of liquid, like the smaller Kivu Lacus (top image).
Map of Titan’s northern “Land o’ Lakes” made from Cassini high-resolution radar imaging (NASA/JPL/USGS)
“If correct this discovery represents the first sea-surface waves known outside of Earth.”
– Jason W. Barnes et al.
Then again, wave action isn’t the only possible answer. Similar varied specular highlights could also be caused by a wet surface — like a methane mud flat. Further observations will be needed to rule out other possibilities and obtain a more accurate “surf forecast” for Titan.
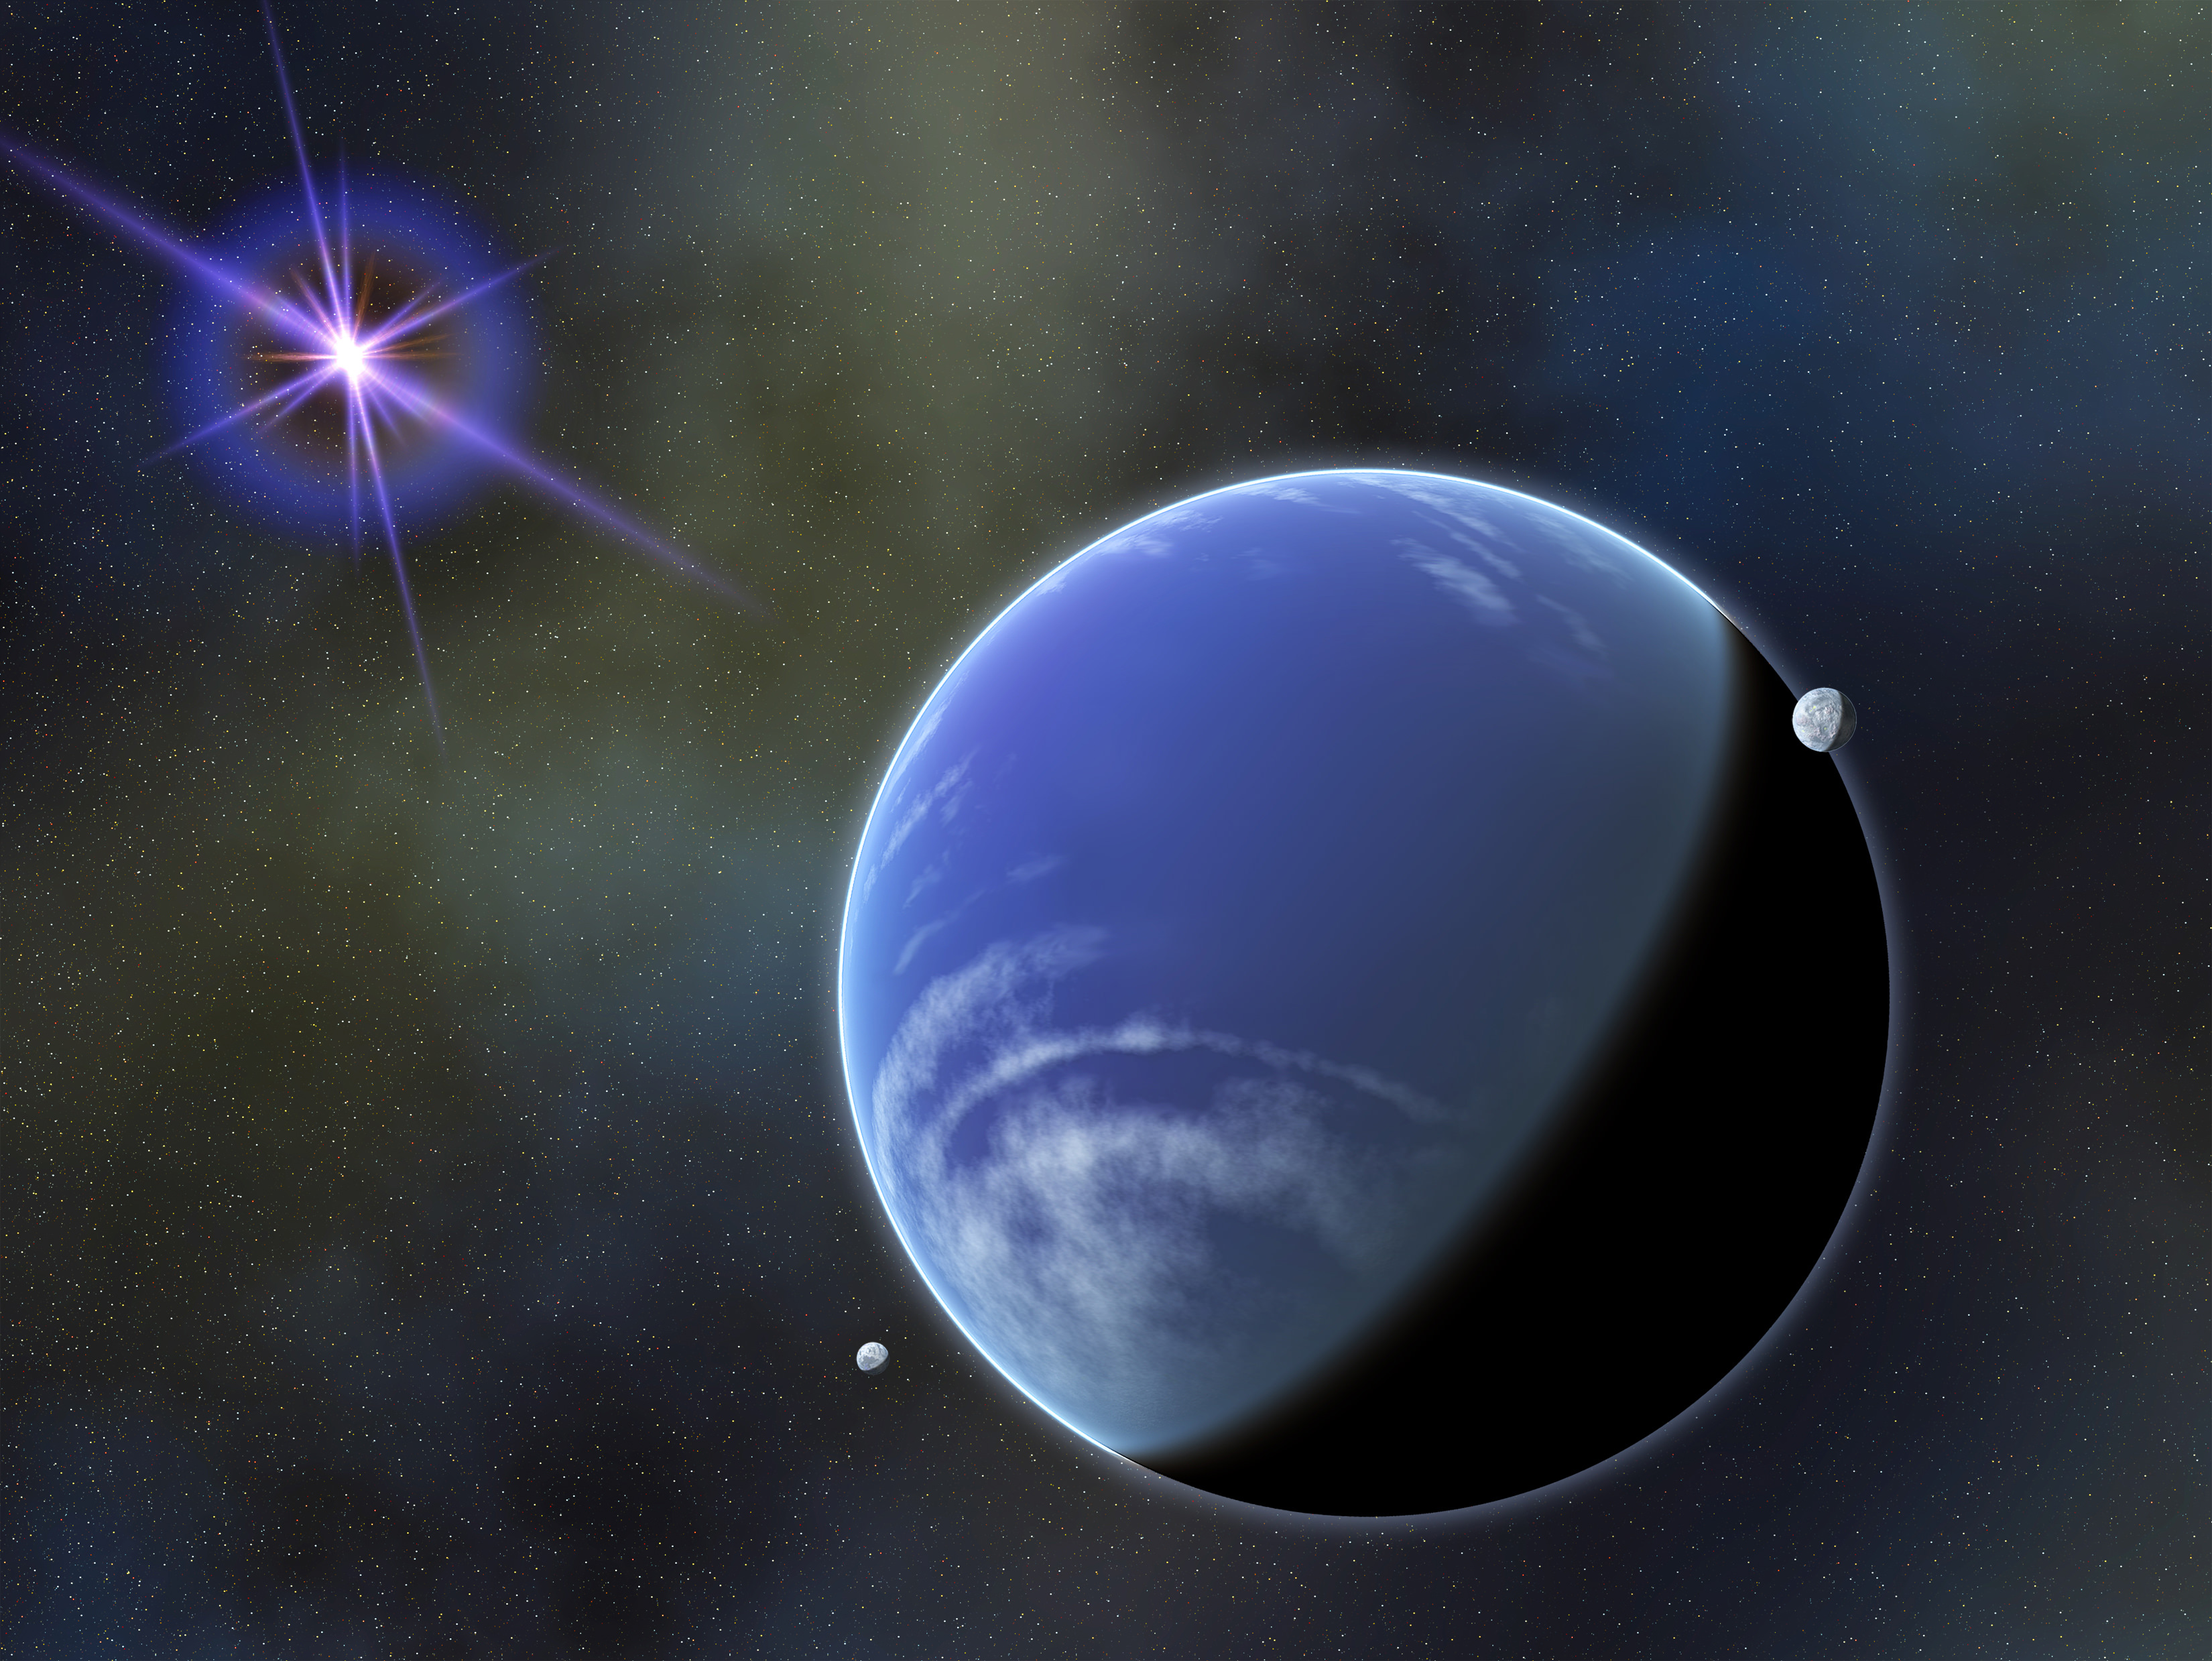
This artist's conception could resemble a planetary system in front of a background star. Image Credit: NASA Goddard Space Flight Center / Francis Reddy
When astronomers detect new exoplanets they typically do so using one of two techniques. First, there’s the famous transit technique, which looks for slight dips in light as a planet passes in front of its host star, and second is the radial velocity technique, which senses the motion of a star due to the gravitational pull of its planet.
But then there is gravitational microlensing, the chance magnification of the light from a distant star by the mass of a foreground star and its planets due to the distortion in the fabric of spacetime. While this technique sounds almost improbable, it is so accurate that every detection skips nominating planets as candidates and immediately verifies them as bona-fide worlds.
But without follow-up observations, the microlensing technique struggles with characterizing the incredibly faint host star. Now, a team of international astronomers led by PhD candidate Jennifer Yee from Ohio State University has detected the first microlensing signature, lovingly called MOA-2013-BLG-220Lb, that looks like a confirmed planet orbiting a candidate brown dwarf — an object so faint because it isn’t massive enough to kick-off nuclear fusion in its core.
Matter — no matter how great or small — curves the fabric of spacetime. It can ultimately acts like a lens by curving the background light around it and therefore magnifying the background source. In microlensing, the intervening matter is simply a faint star or perhaps a planetary system.
“As the ‘lens system’ passes in front of a distant, background star, the magnification of that background star changes as a function of time,” Yee told Universe Today. “By measuring the changing magnification of the background star, we can learn about the lensing star and perhaps whether or not it has a planet.”
In a planetary system, the light from the background star will be magnified when the foreground star passes in front of it. If there is a cirlcing planet, there will be an additional cusp in brightness (to a lesser extent but still a tell-tale detection nonetheless).
A sketch of a microlensing signature with a planet in the lens system. Image Credit: NASA / ESA / K. Sahu / STScI
At the moment the planetary system transits in front of the background star (and for many years after) we can’t separate the two objects. While the light of the background star may be greatly magnified, its image is distorted because its light merges with the planetary system.
So the microlensing signature cannot tell astronomers anything about the lens system’s star. “It’s out of the ordinary,” Andrew Gould, Yee’s PhD advisor and coauthor on the paper, told Universe Today. “In other techniques people have definitely detected a star and they’re struggling to detect the planet. But microlensing is just the opposite. We detect the planet very clearly, but we can’t detect the host star.”
However, the microlensing signature does give away the lens system’s proper motion — the apparent change in distance over time — as it passes in front of the background star. MOA-2013-BLG-220Lb’s proper motion is extremely high, clocking in at 12.5 milliarcseconds (a distance on the sky that is 2400 times smaller than the size of the full moon) per year. This is roughly three times higher than average.
A high proper motion may be caused by an object that is very close by and is moving slowly or a very distant object moving rapidly. As most stars tend not to move at high speeds, the team assumes the object is relatively close, placing it at a distance of 6,000 light-years.
With a distance fixed, the team is also able to assume a mass for the object. It weighs in below the hydrogen-burning limit and is therefore considered the best brown dwarf candidate microlensing has detected.
“The double-edged sword of microlensing is that no light from the lens star is required,” Yee told Universe Today. “On the one hand, microlensing can find planets around dark or faint objects like brown dwarfs. The flip side is that it’s very difficult to characterize the lens star if its light is not detected.”
Astronomers will have to wait until 2021 to take a second look at the lens system. This time frame is how long we expect it to take before the candidate brown dwarf separates appreciably on the sky from the background star. Once it has done so astronomers will be able to verify whether or not the candidate is truly a brown dwarf.
A portion of a collage of galaxies included in the Herschel Reference Survey, in false color to show different dust temperatures. (Blue is colder, and red is warmer). Credit: ESA/Herschel/HRS-SAG2 and HeViCS Key Programmes/L. Cortese (Swinburne University)
While dust is easy to ignore in small quantities (says the writer looking at her desk), across vast reaches of space this substance plays an important role. Stick enough grains together, the theory goes, and you’ll start to form rocks and eventually planets. On a galaxy-size scale, dust may even effect how the galaxy evolves.
A new survey of 323 galaxies reveals that dust is not only affected by the kinds of stars in the vicinity, but also what the galaxy is made of.
“These dust grains are believed to be fundamental ingredients for the formation of stars and planets, but until now very little was known about their abundance and physical properties in galaxies other than our own Milky Way,” stated lead author Luca Cortese, who is from the Swinburne University of Technology in Melbourne, Australia.
“The properties of grains vary from one galaxy to another – more than we originally expected,” he added. “As dust is heated by starlight, we knew that the frequencies at which grains emit should be related to a galaxy’s star formation activity. However, our results show that galaxies’ chemical history plays an equally important role.”
Galaxies in the Herschel Reference Survey in infrared/submillimeter wavelengths (with the Herschel space telescope, at left) and the Sloan Digital Sky Survey (right). Herschel’s false-color image shows galaxies with cold dust (blue) and warm dust (red). Sloan highlights young stars (blue) and old stars (red). “Together, the observations plot young, dust-rich spiral/irregular galaxies in the top left, with giant dust-poor elliptical galaxies in the bottom right,” the European Space Agency stated. Credit: ESA/Herschel/HRS-SAG2 and HeViCS Key Programmes/Sloan Digital Sky Survey/ L. Cortese (Swinburne University)
Data was captured with two cameras on the just-retired Herschel space telescope: Spectral and Photometric Imaging Receiver (SPIRE) and Photodetecting Array Camera and Spectrometer (PACS). These instruments examined different frequencies of dust emission, which shows what the grains are made of. You can see a few of those galaxies in the image above.
“The dust-rich galaxies are typically spiral or irregular, whereas the dust-poor ones are usually elliptical,” the European Space Agency stated. “Dust is gently heated across a range of temperatures by the combined light of all of the stars in each galaxy, with the warmest dust being concentrated in regions where stars are being born.”
Astronomers initially expected that a galaxy with speedy star formation would display more massive and warmer stars in it, corresponding to warmer dust in the galaxy emitting light in short wavelengths.
“However, the data show greater variations than expected from one galaxy to another based on their star formation rates alone, implying that other properties, such as its chemical enrichment, also play an important role,” ESA said.
Polarization patterns imprinted in the CMB. Image Credit: CfA
Days like these make being an astrophysicist interesting. On the one hand, there is the annoucement of BICEP2 that the long-suspected theory of an inflationary big bang is actually true. It’s the type of discovery that makes you want to grab random people off the street and tell them what an amazing thing the Universe is. On the other hand, this is exactly the type of moment when we should be calm, and push back on the claims made by one research team. So let’s take a deep breath and look at what we know, and what we don’t.
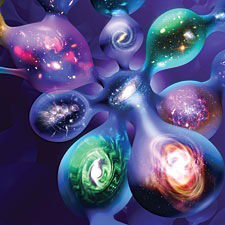
Inflation could mean our Universe is just one of many. Credit: Florida State University
First off, let’s dispel a few rumors. This latest research is not the first evidence of gravitational waves. The first indirect evidence for gravitational waves was found in the orbital decay of a binary pulsar by Russell Hulse and Joseph Taylor, for which they were awarded the Nobel prize in 1993. This new work is also not the first discovery of polarization within the cosmic microwave background, or even the first observation of B-mode polarization. This new work is exciting because it finds evidence of a specific form of B-mode polarization due to primordial gravitational waves. The type of gravitational waves that would only be caused by inflation during the earliest moments of the Universe.
It should also be noted that this new work hasn’t yet been peer reviewed. It will be, and it will most likely pass muster, but until it does we should be a bit cautious about the results. Even then these results will need to be verified by other experiments. For example, data from the Planck space telescope should be able to confirm these results assuming they’re valid.
That said, these new results are really, really interesting.
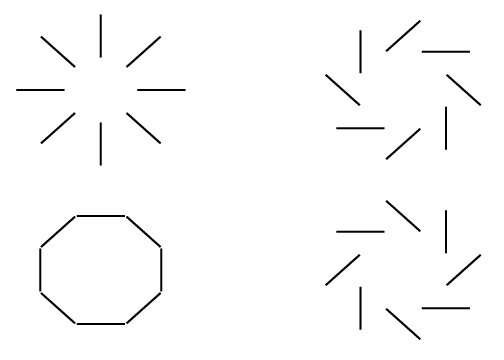
E-modes (left) and B-modes (right)
What the team did was to analyze what is known as B-mode polarization within the cosmic microwave background (CMB). Light waves oscillate perpendicular to their direction of motion, similar to the way water waves oscillate up and down while they travel along the surface of water. This means light can have an orientation. For light from the CMB, this orientation has two modes, known as E and B. The E-mode polarization is caused by temperature fluctuations in the CMB, and was first observed in 2002 by the DASI interferometer.
The B-mode polarization can occur in two ways. The first way is due to gravitational lensing. The first is due to gravitational lensing of the E-mode. The cosmic microwave background we see today has travelled for more than 13 billion years before reaching us. Along its journey some of it has passed close enough to galaxies and the like to be gravitationally lensed. This gravitational lensing twists the polarization a bit, giving some of it a B-mode polarization. This type was first observed in July of 2013. The second way is due to gravitational waves from the early inflationary period of the universe. As inflationary period occurred, then it produced gravitational waves on a cosmic scale. Just as the gravitational lensing produces B-mode polarization, these primordial gravitational waves produce a B-mode effect. The discovery of primordial wave B-mode polarization is what was announced today.
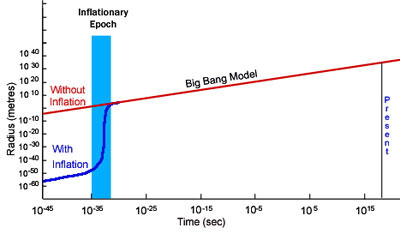
The effect of early inflation on the size of the universe. Credit: NASA/COBE
Inflation has been proposed as a reason for why the cosmic microwave background is as uniform as it is. We see small fluctuations in the CMB, but not large hot or cold spots. This means the early Universe must have been small enough for temperatures to even out. But the CMB is so uniform that the observable universe must have been much smaller than predicted by the big bang. However, if the Universe experienced a rapid increase in size during its early moments, then everything would work out. The only problem was we didn’t have any direct evidence of inflation.
Assuming these new results hold up, now we do. Not only that, we know that inflation was stronger than we anticipated. The strength of the gravitational waves is measured in a value known as r, where larger is stronger. It was found that r = 0.2, which is much higher than anticipated. Based upon earlier results from the Planck telescope, it was expected that r < 0.11. So there seems to be a bit of tension with earlier findings. There are ways in which this tension can be resolved, but just how is yet to be determined.
So this work still needs to be peer reviewed, and it needs to be confirmed by other experiments, and then the tension between this result and earlier results needs to be resolved. There is still much to do before we really understand inflation. But overall this is really big news, possibly even Nobel prize worthy. The results are so strong that it seems pretty clear we have direct evidence of cosmic inflation, which is a huge step forward. Before today we only had physical evidence back to when the universe was about a second old, at a time when nucleosynthesis occurred. With this new result we are now able to probe the Universe when it was less than 10 trillion trillion trillionths of a second old.
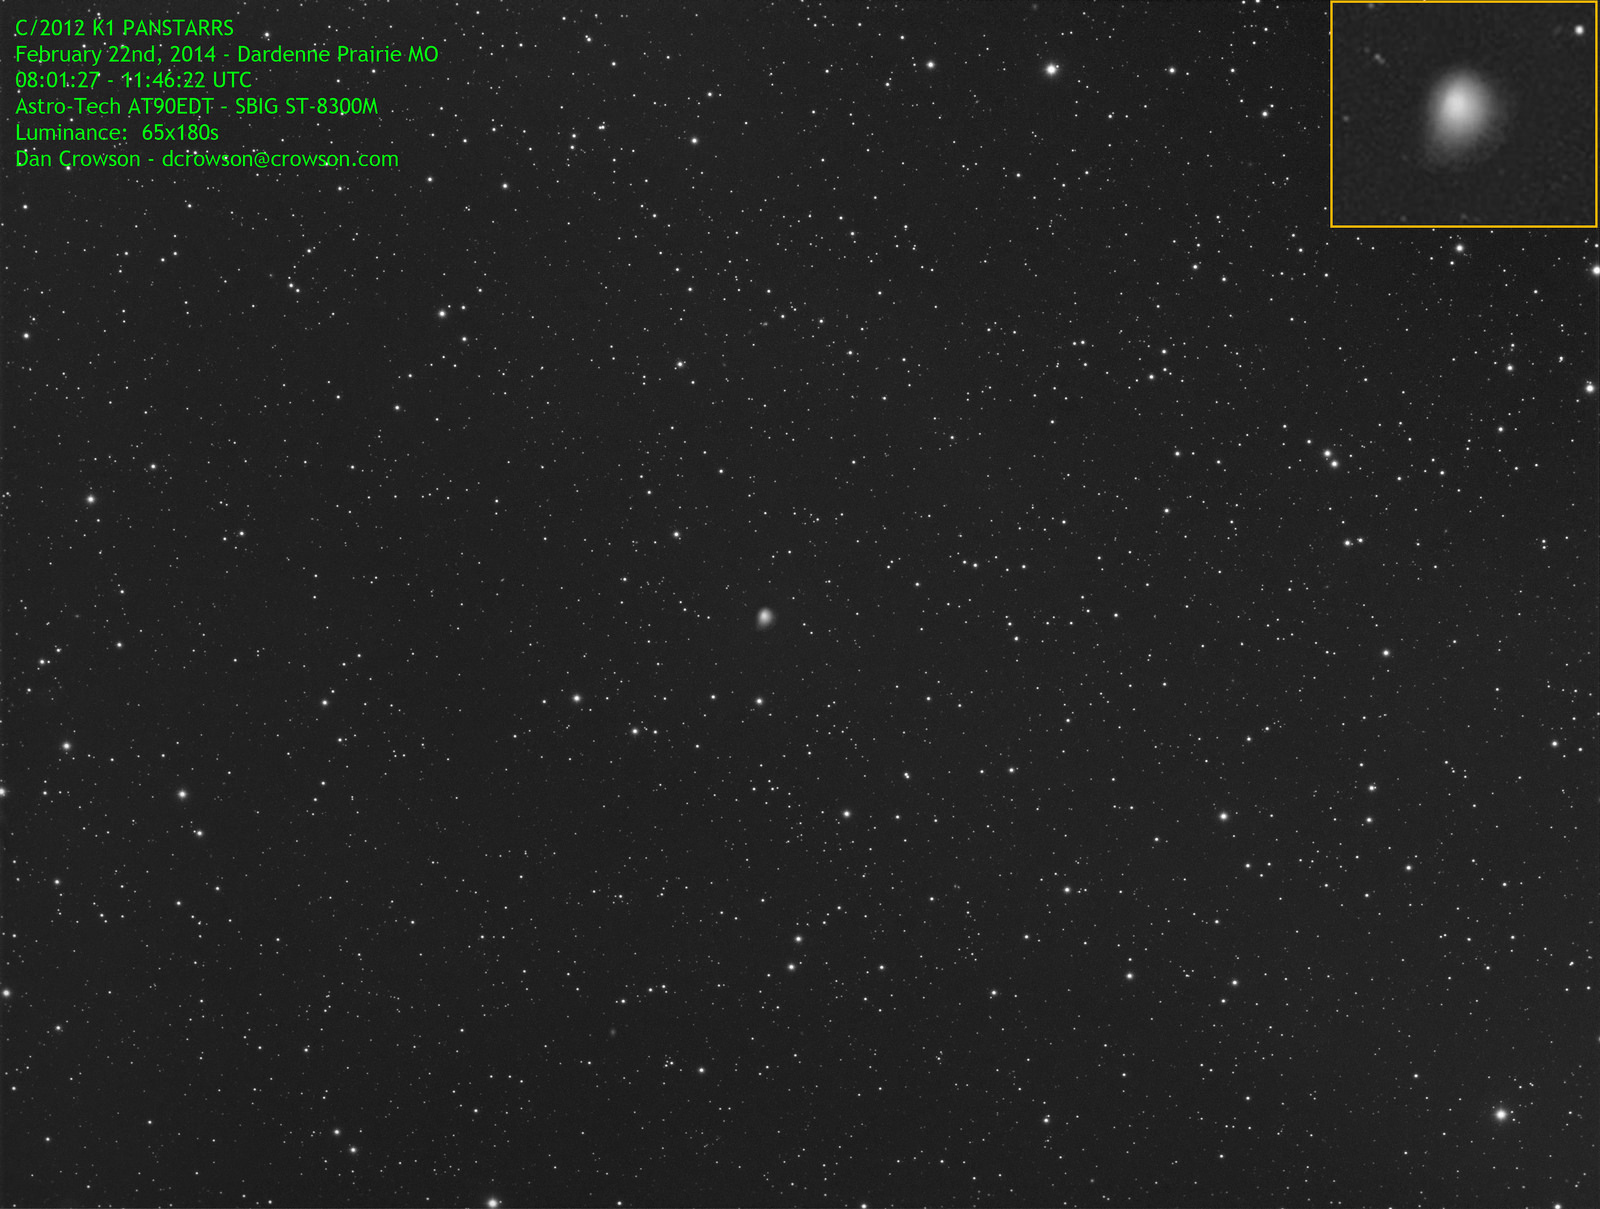
Comet c/2012 K1 PanSTARRS as imaged by Dan Crowson on February 22nd, 2014. Image credit: Dan Crowson, used with permission.
Get those binoculars ready: an icy interloper from the Oort cloud is about to grace the night sky.
The comet is C/2012 K1 PanSTARRS, and it’s currently just passed from the constellation Hercules into Corona Borealis and presents a good target for observers high in the sky in the hours before dawn. In fact, from our Tampa based latitude, K1 PanSTARRS is nearly at the zenith at around 6 AM local.
Observers currently place K1 PanSTARRS at magnitude +10.5 and brightening and showing a small condensed coma. Through the eyepiece, a comet at this stage will often resemble a fuzzy, unresolved globular star cluster.
And the good news is, K1 PanSTARRS will continue to brighten, headed northward through the early morning and then into the evening sky before reaching solar conjunction on August 9th, when it’ll actually pass behind the Sun for a few hours as seen from from our vantage point. We actually get two good apparitions of Comet K1 PanSTARRS: one for the northern hemisphere in the Spring and one for the southern hemisphere after it reaches perihelion and crosses south of the ecliptic plane in August.
And it’ll be worth keeping an eye out for K1 PanSTARRS online as well, as it passes into the view of SOHO’s LASCO C3 camera on August 2 before exiting its 15 degree field of view on August 16th.
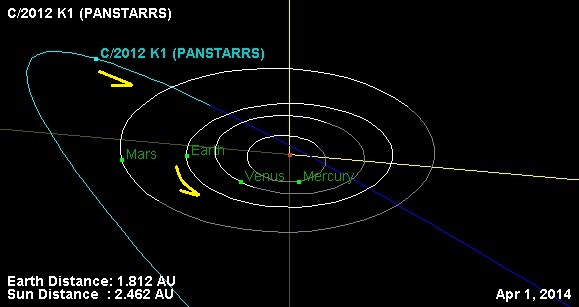
This actually means the comet will reach opposition twice from our Earthbound vantage point: once on April 15th, and again on November 7th. And, as is often the case, this comet arrives six months early –or late, depending how you look at it- to be a fine naked eye object. Had K1 PanSTARRS reached perihelion in January, we’d have really been in for a show, with the comet only around 0.05 Astronomical Units (about 7.7 million kilometers) from the Earth!
The orbit of comet K1 PanSTARRS through the inner solar system. The yellow arrows denote the motion of the planets and the comet as seen from north of the ecliptic plane. Credit-NASA/JPL Horizons Solar System Dynamics generator.
But alas, such was not to be. At its best, K1 PanSTARRS will be hidden by the glare of the Sun at its very best, to emerge into the southern sky. The comet has a steeply inclined 142 degree retrograde orbit, and thus approaches the inner solar system from high above the ecliptic plane.
These coming last weeks of March are a great time to search out K1 PanSTARRS as the Moon reaches Last Quarter this weekend and heads towards New on March 30th, beginning a two week “moonless period for AM observing in early April. Projections by veteran comet observer Seiichi Yoshida suggest that K1 PanSTARRS will begin to brighten dramatically towards +8th magnitude through April. We first picked up the now posthumous comet ISON with binoculars around this magnitude last Fall. Keep in mind, like nebula and galaxies, the apparent brightness of a comet is spread out over its surface area. This can make a +10th magnitude comet much tougher to spot than a pinpoint +10 magnitude star.
We actually prefer our trusty Canon 15x45IS image stabilized binoculars for comet hunting… they’re powerful and easy to deploy on a cold March morning!
Here’s a handy list of notable events to watch for as Comet C/2012 K1 PanSTARRS crosses the springtime sky. Only passages of less than one degree near stars greater than magnitude +6 are mentioned except where otherwise noted:
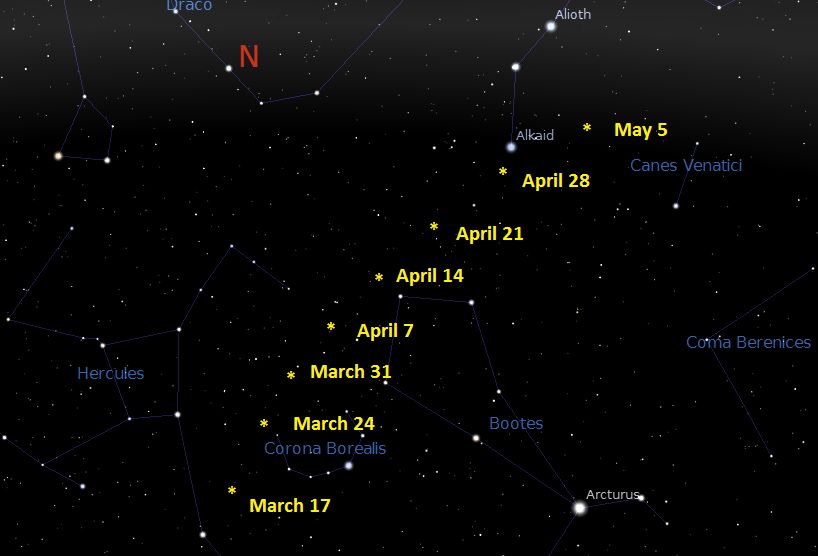
March 17th: Comet C/2012 K1 PanSTARRS passes into the constellation Corona Borealis.
March 21st: Passes the +5.8 magnitude star Upsilon Coronae Borealis.
March 29th: Passes the +5.4 magnitude star Rho Coronae Borealis.
March 30th: The Moon reaches New phase.
The path of comet K1 PanSTARRS in one week intervals through March and April. Created using Stellarium.
April 2nd: Passes the +4.8 magnitude star Kappa Coronae Borealis.
April 7th: Passes the +5.2 magnitude star Mu Coronae Borealis.
April 10th: Passes into the constellation of Boötes.
April 10th: Passes the +5 magnitude wide binary pair Nu Boötis.
April 15th: Comet K1 PanSTARRS reaches opposition, rising opposite to the setting Sun and moving into the evening sky.
April 20th: K1 PanSTARRS becomes circumpolar for observers above 45 degrees north until May 25th.
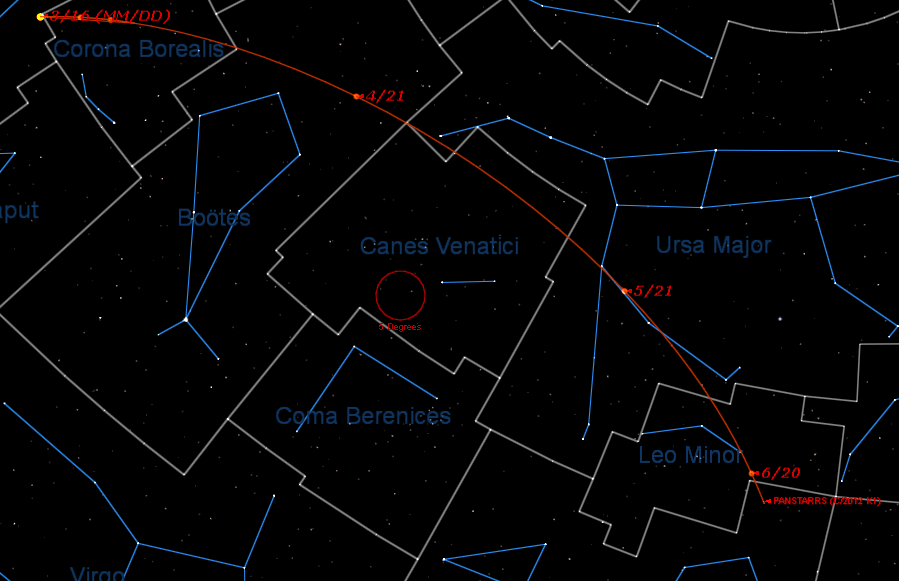
April 26th: Passes into the constellation Ursa Majoris.
April 29th: Passes the bright +1.9th magnitude star Alkaid in the handle of the Big Dipper asterism. This is the brightest star that K1 PanSTARRS will pass near for this apparition, and Alkaid will make a great “finder” to spot the comet.
April 29th: The Moon reaches New phase.
April 30th: Approaches the +4.7 magnitude star 24 Canum Venaticorum.
The Spring path of comet K1 PanSTARRS from mid-March through late June. Credit: Starry Night Education Software.
May 1st: Passes less than 2 degrees from the galaxy M51… photo op!
May 3rd: Passes the 5.1 magnitude star 21 Canum Venaticorum.
May 6th: K1 PanSTARRS Reaches a maximum declination of 49.5 degrees north.
May 11th: Passes the 5.3 magnitude star 3 Canum Venaticorum.
May 14th: Passes into the constellation Ursa Major.
May 17th: Another great photo ops awaits astrophotographers, as the comet passes the +3.7 magnitude star Chi Ursae Majoris and the +12 magnitude galaxy NGC 3877.
May 25th: Passes the 3rd magnitude star Psi Ursae Majoris.
May 28th: The Moon reaches New phase.
May 28th: Passes the 4.7 magnitude star Omega Ursae Majoris.
June 7th Passes into the constellation Leo Minor.
June 15th: Passes the +4.5 magnitude star 21 Leo Minoris.
June 22nd: Passes into the constellation Leo.
July 1- Passes to within 40 degrees elongation from the Sun.
And from there, Comet K1 PanSTARRS reaches perihelion just outside of the Earth’s orbit at 1.05 A.U. on August 27, and plunges south across the celestial equator on September 15.
Video animation of comet C/2012 K1 PanSTARRS over the span of an evening. Credit: Dan Crowson of Dardenne Prairie Missouri, used with permission.
It’s also worth noting that K1 PanSTARRS will make its first of two approaches at a minimum distance of 1.471 A.U.s from Earth May 4th and will be moving at about a degree a day – twice the diameter of the Full Moon – before receding from us once more for a closer 1.056 A.U. approach to Earth on August 25th.
Discovered on May 19th, 2012 by the PanSTARRS telescope based on the island of Maui, Comet K1 PanSTARRS was first spotted at 8.7 A.U.s distant, well past the orbit of Jupiter. The PanSTARRS survey has been a prolific discoverer of asteroids and comets, including the brilliant comet C/2011 L4 PanSTARRS that graced dusk skies in March of last year.
And those are just the binocular comets that are scheduled to perform… remember, the next “big one” could come barreling in towards the inner solar system at any time to put on a memorable performance worthy of another comet Hyakutake or Hale-Bopp… just not TOO close!
– Be sure to send those comet pics in to Universe Today.
Polarization patterns imprinted in the CMB. Image Credit: CfA
Andrei Linde, a professor in the Department of Physics at Stanford University, is one of the main authors of the inflationary universe theory, that the universe underwent a brief but remarkably accelerated expansion immediately following the Big Bang.
Today, scientists announced that they’ve found direct evidence of primordial gravitational waves, which would provide a “smoking gun” for inflation, and also tell us when inflation took place and how powerful the process was.
Above is a scientifically heartwarming video of Linde being told of the gravitational wave discovery by Chao-Lin Kuo, also from Stanford University, the designer of the BICEP2 detector that made the discovery.
And if you’re interested in looking back, here’s an archive to all the past Carnivals of Space. If you’ve got a space-related blog, you should really join the carnival. Just email an entry to [email protected], and the next host will link to it. It will help get awareness out there about your writing, help you meet others in the space community – and community is what blogging is all about. And if you really want to help out, sign up to be a host. Send an email to the above address.
Come on Betelguese, explode already. Or maybe it’ll be Eta Carinae. Which of the billions of stars in the galaxy can we count on to explode next, and when?
When a new supernova is discovered, we can take that as a reminder that we live in a terribly hostile Universe. Sometimes stars just explode, and devastate a corner of a galaxy. On average, a supernova goes off twice a century in a galaxy the size of the Milky Way. Since there are potentially hundreds of billions of galaxies out there, dozens of supernovae are detonating every second in the observable Universe.
The last bright supernova was SN 1987A, located in the Large Magellanic Cloud, about 168,000 light years away. Even though it was far, it exploded with so much energy it was visible to the unaided eye. That one wasn’t even in our galaxy.
The Milky Way’s most recent supernova that we know of was G1.9+0.3, recently confirmed by the Chandra X-Ray Observatory. It would have been visible from Earth about 100 years ago, but it was located in the dusty regions of the Milky Way and obscured from our view.
The last bright supernova was discovered in 1604 by the astronomer Johannes Kepler. This was a naked-eye supernova, in fact, at its peak, it was brighter than any other star in the night sky and for a few weeks it was even visible during the day.
So, which star is likely to explode next? Can we even know that?
Artist’s impression of the supergiant star Betelgeuse as it was revealed with ESO’s Very Large Telescope. Credit: ESO/L.Calçada
We can, and there are even likely candidates. There’s Betelgeuse, the red supergiant star located in the constellation of Orion, only 640 light-years from Earth. Betelgeuse is massive, and it’s only been around for 10 million years. It will likely explode within a million years. Which, in astronomical time, is just before lunch.
Another candidate is Eta Carinae, located about 8,000 light years from us. This blue supergiant has roughly 120 times the mass of the Sun, and it’s ready to explode in the next few hundred thousand years. Which, from the Universe’s perspective is any moment now.
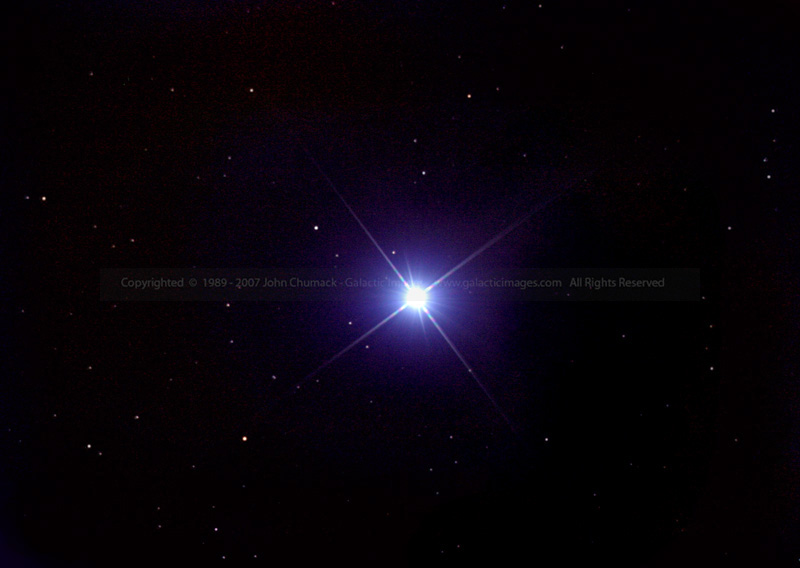
The closest star that could go supernova is most likely Spica, a short 240 light-years from Earth.
Spica has several times the mass of the Sun, it shouldn’t go off for a few million years yet. According to Phil Plait, the Bad Astronomer, another candidate is the star IK Pegasus A at just 150 light-years away.
Bright Star Spica – Brightest Star in Virgo by John Chumack
If any of these supernovae do go off, they’ll be incredibly bright. Supernova Betelgeuse would be visible during the day, it might even brighter than the full Moon. It would shine in the sky for weeks, possibly months before fading away.
These explosions are destructive, releasing a torrent of gamma radiation and high energy particles. Fortunately for us, we’re safe. You’d need to be within about 75 light years to really receive a lethal dose. Which means that even the closest supernova candidate is still too far to cause us any real harm.
Which star is set to explode next? Well, in the last second, 30 supernovae just went off, somewhere in the Universe. Here in our galaxy, there should be a supernova in the next 50 years or so, but we still might not be able to see it.
And if we’re really really lucky, Betelgeuse or Eta Carinae will detonate, and we’ll witness one of the most awe inspiring events in the cosmos from the safety of the front porch of our galactic suburban home. Any time now.
Which star would you like to see go supernova? Tell us in the comments below!
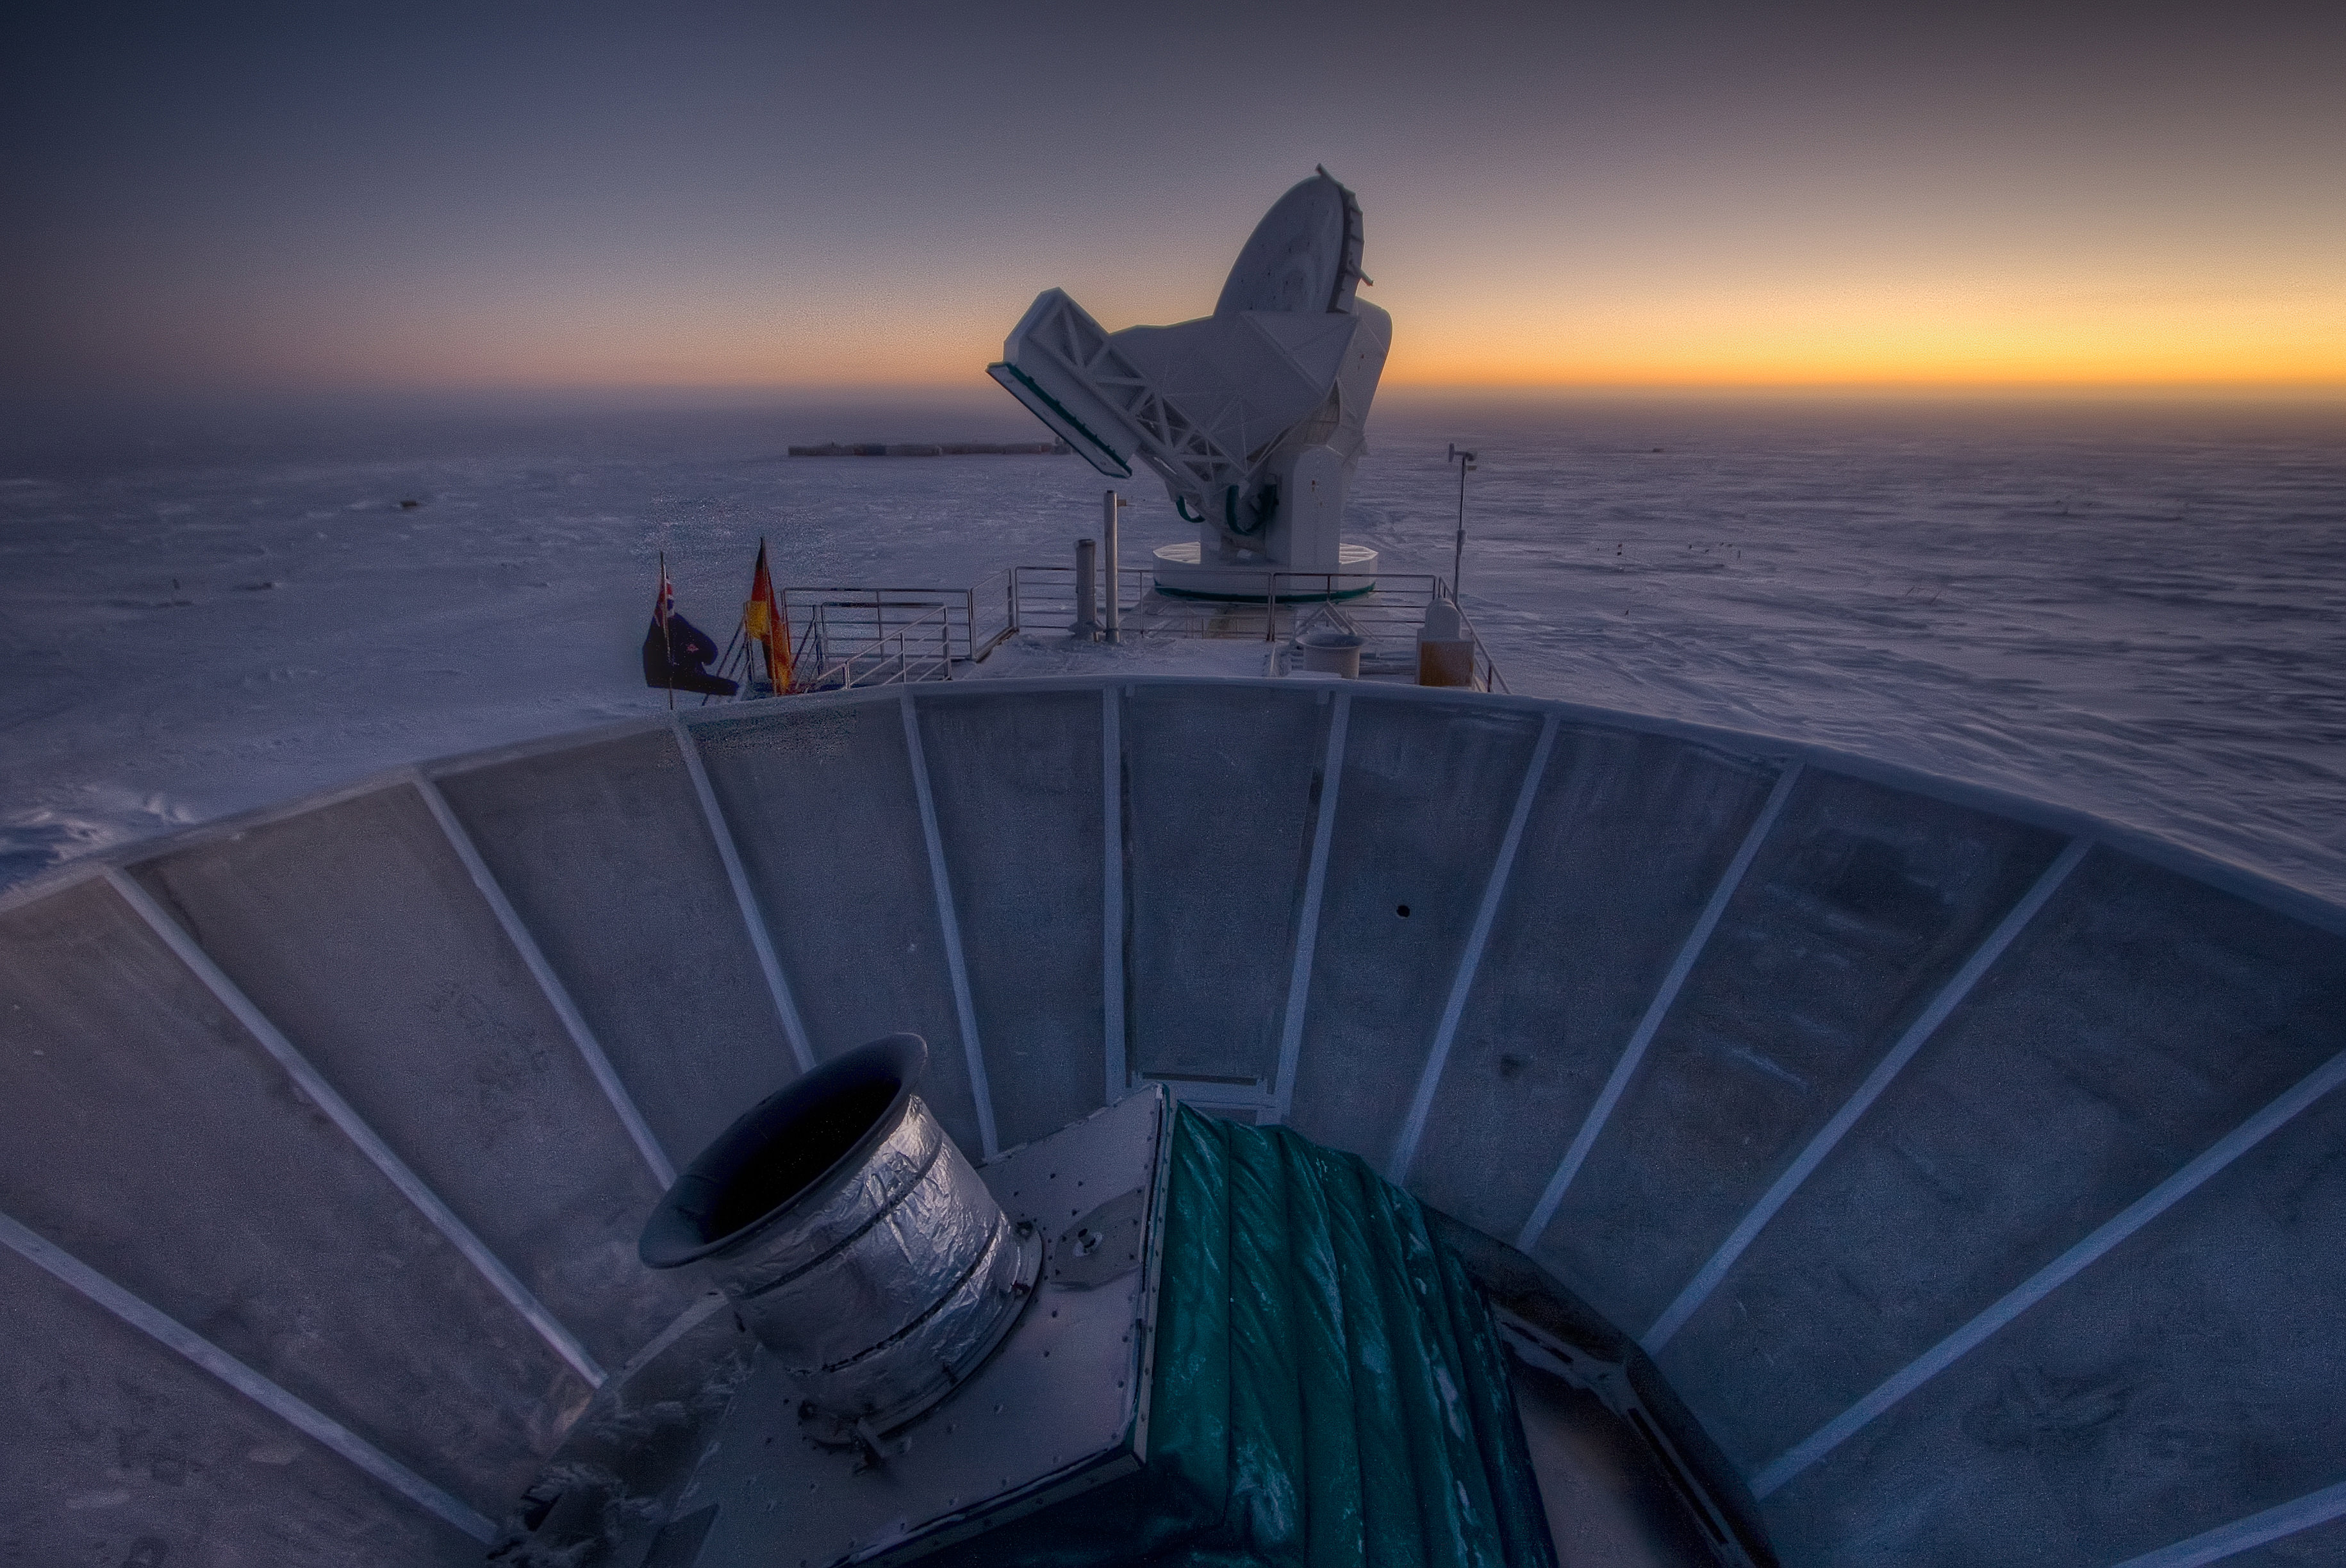
The BICEP telescope located at the south pole. Image Credit: CfA / Harvard
Astronomers have announced Nobel Prize-worthy evidence of primordial gravitational waves — ripples in the fabric of spacetime — providing the first direct evidence the universe underwent a brief but stupendously accelerated expansion immediately following the big bang.
“The implications for this detection stagger the mind,” said co-leader Jamie Bock from Caltech. “We are measuring a signal that comes from the dawn of time.”
BICEP2 (Background Imaging of Cosmic Extragalactic Polarization) scans the sky from the south pole, looking for a subtle effect in the cosmic microwave background (CMB) — the radiation released 380,000 years after the Big Bang when the universe cooled enough to allow photons to travel freely across the cosmos.
The CMB fills every cubic centimeter of the observable universe with approximately 400 microwave photons. The so-called afterglow of the big bang is nearly uniform in all directions, but small residual variations (on the level of one in 100,000) in temperature show a specific pattern. These irregularities match what would be expected if minute quantum fluctuations had ballooned to the size of the observable universe today.
So astronomers dreamed up the theory of inflation — the epoch immediately following the big bang (10-34 seconds later) when the universe expanded exponentially (by at least a factor of 1025) — causing quantum fluctuations to magnify to cosmic size. Not only does inflation help explain why the universe is so smooth on such massive scales, but also why it’s flat when there’s an infinite number of other possible curvatures.
While inflation is a pillar of big bang cosmology, it has remained purely a theoretical framework. Many astronomers don’t buy it as we can’t explain what physical mechanism would have driven such a massive expansion, let alone stop it. The results announced today provide a strong case in support of inflation.
The trick is in looking at the CMB where inflation’s signature is imprinted as incredibly faint patterns of polarized light — some of the light waves have a preferred plane of vibration. If a gravitational wave passes through the fabric of spacetime it will squeeze spacetime in one direction (making it hotter) and stretch it in another (making it cooler). Inflation will then amplify these quantum fluctuations into a detectable signal: the hotter and therefore more energetic photons will be visible in the CMB, leaving a slight polarization imprint.
E-modes (left side) look the same when reflected in a mirror. B-modes (right side) do not. Image Credit: Nathan Miller
This effect will create two distinct patterns: E-modes and B-modes, which are differentiated based on whether or not they have even or odd parity. In simpler terms: E-mode patterns will look the same when reflected in a mirror, whereas B-mode patterns will not.
E-modes have already been extensively detected and studied. While both are the result of primordial gravitational waves, E-modes can be produced through multiple mechanisms whereas B-modes can only be produced via primordial gravitational waves. Detecting the latter is a clean diagnostic — or as astronomers are putting it: “smoking gun evidence” — of inflation, which amplified gravitational waves in the early Universe.
“The swirly B-mode pattern is a unique signature of gravitational waves because of their handedness. This is the first direct image of gravitational waves across the primordial sky,” said co-leader Chao-Lin Kuo from Stanford University, designer of the BICEP2 detector.
Shown here are the actual B-mode polarization patterns provided by the BICEP2 Telescope. Image Credit: Harvard-Smithsonian Center for Astrophysics
The team analyzed sections of the sky spanning one to five degrees (two to 10 times the size of the full moon) for more than three years. They created a unique array of 512 detectors, which collectively operate at a frosty 0.25 Kelvin. This new technology enabled them to make detections at a speed 10 times faster than before.
The results are surprisingly robust, with a 5.9 sigma detection. For comparison, when particle physicists announced the discovery of the Higgs Boson in July, 2012 they had to reach at least a 5 sigma result, or a confidence level of 99.9999 percent. At this level, the chance that the result is erroneous due to random statistical fluctuations is only one in a million. Those are pretty good odds.
While the team was careful to rule out any errors, it will be crucial for another team to verify these results. The Planck spacecraft, which has been producing exquisite measurements of the CMB, will be reporting its own findings later this year. At least a dozen other teams have also been searching for this signature.
“This work offers new insights into some of our most basic questions: Why do we exist? How did the universe begin?” commented Harvard theorist Avi Loeb. “These results are not only a smoking gun for inflation, they also tell us when inflation took place and how powerful the process was.”
Not only does inflation succeed in explaining the origin of cosmic structure — how the cosmic web formed from the smooth aftermath of the big bang — but it makes wilder predictions as well. The model seems to produce not just one universe, but rather an ensemble of universes, otherwise known as a multiverse. This collection of universes has no end and no beginning, continuing to pop up eternally.
Today’s results provide a stronger case for “eternal inflation,” which gives a new perspective on our desolate place within the cosmos. Not only do we live on a small planet orbiting one star out of hundreds of billions, in one galaxy out of hundreds of billions, but our entire universe may just be one bubble out of a vast cosmic ocean of others.
The detailed paper may be found here.
The full set of papers are here.
An FAQ summarizing the data is here.