The private Dream Chaser mini-shuttle being developed by Sierra Nevada Corp. (SNC) has successfully completed a series of rigorous wind tunnel tests on scale models of the spacecraft – thereby accomplishing another key development milestone under NASA’s Commercial Crew Program to restore America’s human spaceflight access to low Earth orbit.
Engineers from SNC and NASA’s Langley Research Center in Hampton, Virginia conducted six weeks of intricate testing with several different Dream Chaser scale model spacecraft to study its reaction to subsonic, transonic and supersonic conditions that will be encountered during ascent into space and re-entry from low-Earth orbit.
The tests are among the milestones SNC must complete to receive continued funding from the Commercial Crew Integrated Capability initiative (CCiCAP) under the auspices of NASA’s Commercial Crew Program.
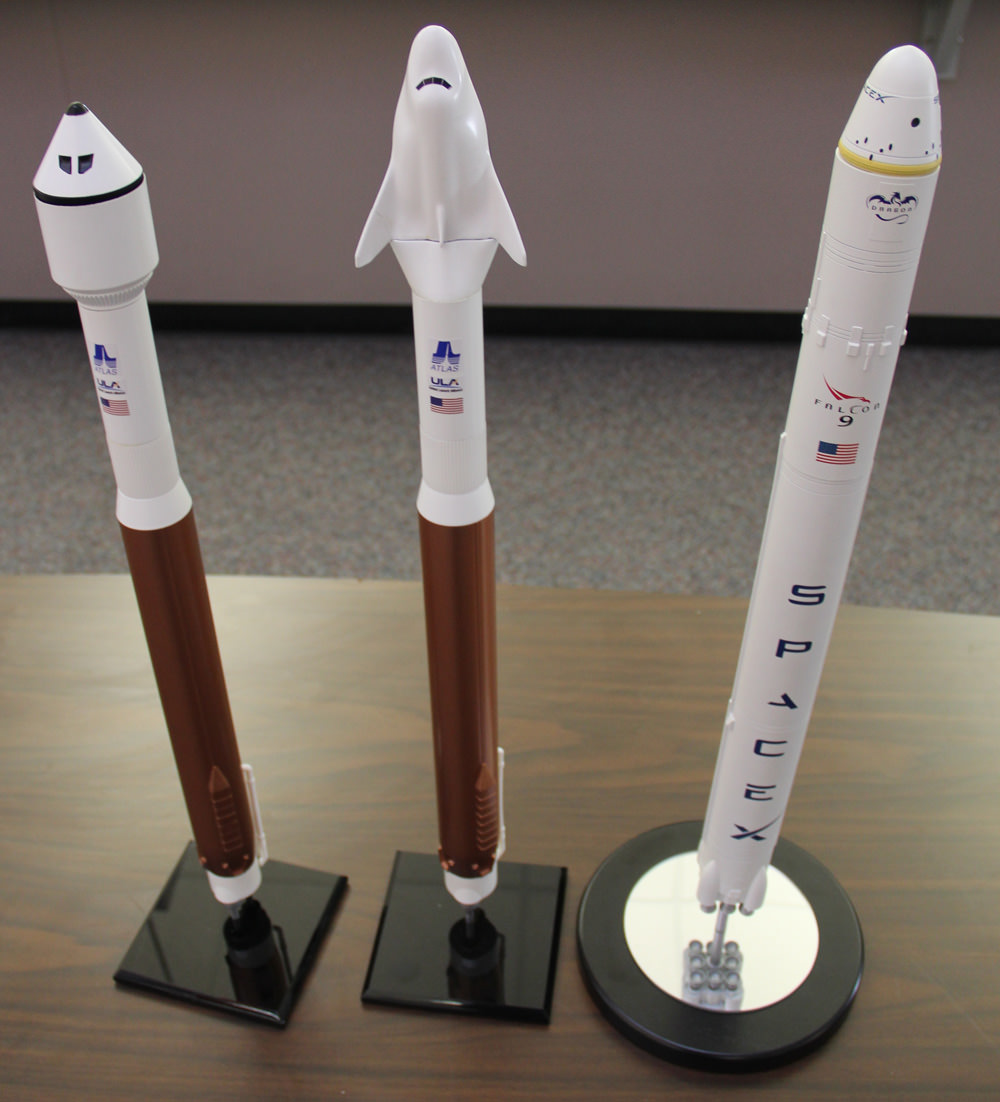
The Dream Chaser is among a trio of US private sector manned spaceships being developed with seed money from NASA’s Commercial Crew Program in a public/private partnership to develop a next-generation crew transportation vehicle to ferry astronauts to and from the International Space Station (ISS) by 2017 – a capability totally lost following the space shuttle’s forced retirement in 2011.
Since that day, seats on the Russian Soyuz are US astronauts only way to space and back.
The SpaceX Dragon and Boeing CST-100 ‘space taxis’ are also vying for funding in the next round of contracts to be awarded by NASA around late summer 2014.

“What we have seen from our industry partners is a determination to make their components and systems work reliably, and in turn they’ve been able to demonstrate the complex machinery that makes spaceflight possible will also work as planned,” said Kathy Lueders, NASA’s Commercial Crew Program manager. “These next few months will continue to raise the bar for achievement by our partners.”
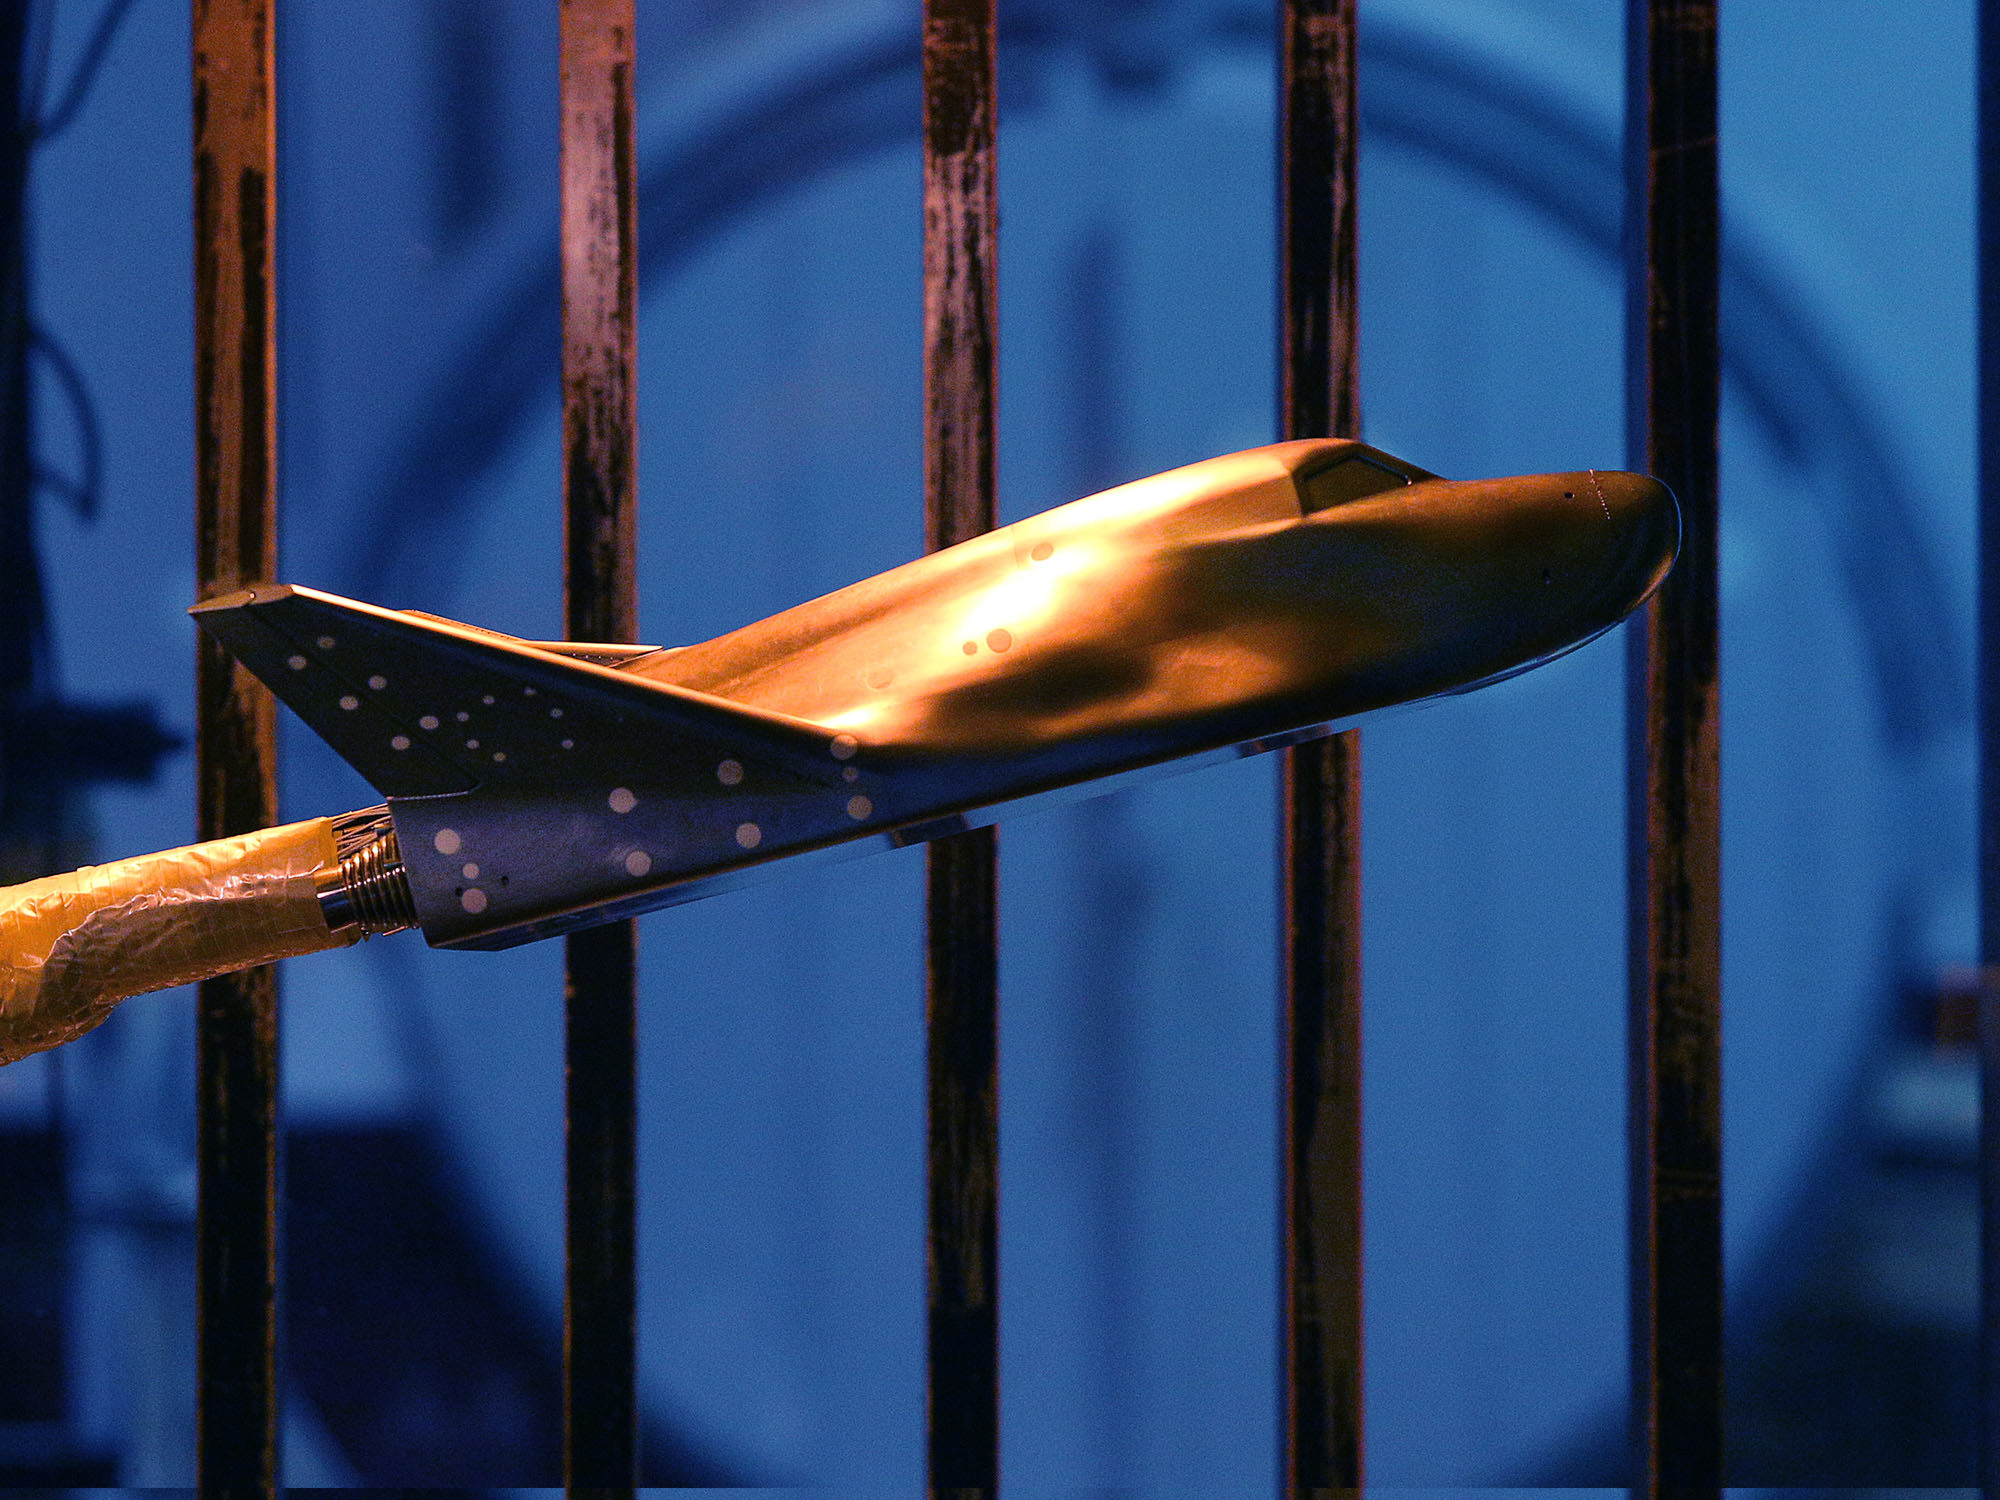
To prepare for the wind tunnel testing, technicians first meticulously hand glued 250 tiny sand grains to the outer surface of the 22-inch long Dream Chaser scale model in order to investigate turbulent flow forces and flight dynamic characteristics along the vehicle that simulates what the actual spacecraft will experience during ascent and re-entry.

Testing encompassed both the Dream Chaser spacecraft by itself as well as integrated in the stacked configuration atop the Atlas V launch vehicle that will boost the vehicle to space from Launch Complex 41 at Cape Canaveral Air Force Station in Florida.
The testing of the Dream Chaser model was conducted at different angles and positions and around the clock inside the Unitary Plan Wind Tunnel at NASA Langley to collect the data as quickly as possible.
“All the data acquired will be used to validate computer models and populate the Dream Chaser spacecraft performance database,” according to NASA test engineer Bryan Falman.
NASA says that the resulting data showed the existing computer models were accurate.
Additonal wind tunnel testing was done at NASA’s Ames Research Center in Moffett Field, California and the CALSPAN Transonic Wind Tunnel in New York.
The wind tunnel work will also significantly aid in refining the Dream Chaser’s design and performance as well as accelerate completion of the Critical Design Review (CDR) before the start of construction of the full scale vehicle for orbital flight tests by late 2016.
Video Caption: Engineers used a wind tunnel at NASA’s Langley Research Center in Hampton, Virginia, to evaluate the design of Sierra Nevada Corporation’s Dream Chaser spacecraft. Credit: NASA
“The aerodynamic data collected during these tests has further proven and validated Dream Chaser’s integrated spacecraft and launch vehicle system design. It also has shown that Dream Chaser expected performance is greater than initially predicted,” said Mark N. Sirangelo, corporate vice president and head of SNC’s Space Systems.
“Our program continues to fully complete each of our CCiCap agreement milestones assisted through our strong collaboration efforts with our integrated ‘Dream Team’ of industry, university and government strategic partners. We are on schedule to launch our first orbital flight in November of 2016, which will mark the beginning of the restoration of U.S. crew capability to low-Earth orbit.”
The Dream Chaser design builds on the experience gained from NASA Langley’s earlier exploratory engineering work with the HL-20 manned lifting-body vehicle.
“The NASA-SNC effort makes for a solid, complementary relationship,” said Andrew Roberts, SNC aerodynamics test lead. “It is a natural fit. NASA facilities and the extensive work they’ve done with the Dream Chaser predecessor, HL-20, combined with SNC’s engineering, is synergistic and provides great results.”
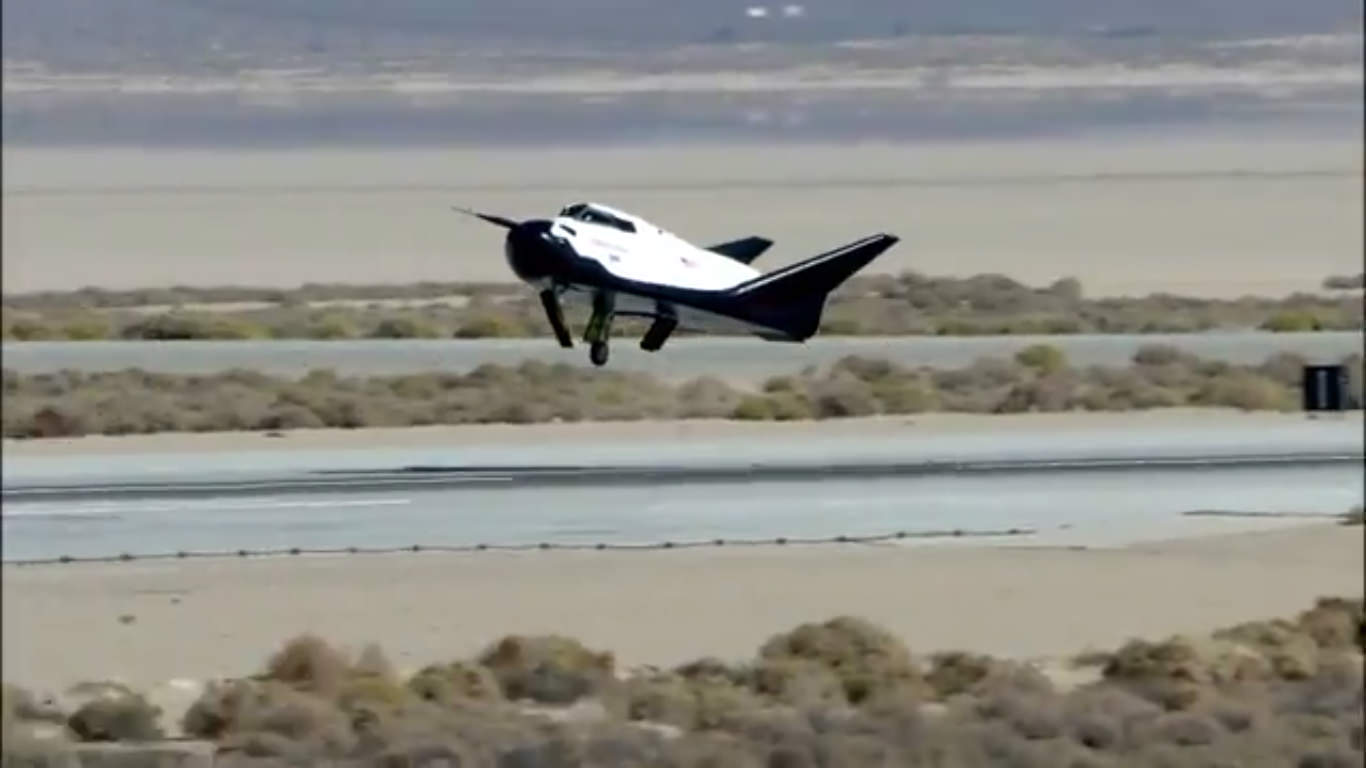
Dream Chaser will be reusable and can carry a mix of cargo and up to a seven crewmembers to the ISS. It will also be able to land on commercial runways anywhere in the world, according to SNC.
Stay tuned here for Ken’s continuing Sierra Nevada, Boeing, SpaceX, Orbital Sciences, commercial space, Orion, Curiosity, Mars rover, MAVEN, MOM and more planetary and human spaceflight news.